INTRODUCTION
As one of the most common psychiatric disorders, depression is a major cause of disability worldwide. According to the World Health OrganizationŌĆÖs (WHO) statistics, more than 300 million people worldwide suffer from depression [1]. However, its precise neurobiological mechanisms are not known yet [2]. Recently, many neuroimaging studies using magnetic resonance imaging (MRI) have elucidated disorder-related patterns of structural changes in brain associated with depressive disorder. Particularly several regional gray matter changes in frontal lobe, temporal lobe, hippocampus, amygdala, thalamus, and striatum related to mood regulation and cognitive function have supported the neurobiological basis on many psychological and behavioral symptoms of depressive disorder [3-5].
Suicide is a leading cause of death worldwide, and becomes a significant public health problem [1]. Sixty percent of people who committed suicide had a history of depressive disorder [6]. Although the close relationship between suicidal behaviors (SB) and depressive disorder has been well known, the underlying mechanisms between them have been suggested inconsistently. Previous studies investigating SB in depressive disorder patients reported local gray matter changes of several cortical and subcortical structures [7-10]. These findings suggest the possibility that the development of SB in depressive disorder may be associated with structural abnormalities of the brain.
There is growing evidence that genetic factors are involved in the pathophysiology both of depressive disorder and SB. Genetic variants of TPH1, a gene encoding the key enzyme tryptophan hydroxylase 1 (TPH1) in serotonin synthesis are ones of the most studied in genetic researches concerning depression and suicide [11]. The most investigated single nucleotide polymorphism (SNP) rs1800532 of TPH1 was reported to be associated with the occurrence of depression [12-14]. Bellivier et al. [12] reported a significant contribution of A allele in rs1800532 to SB from a meta-analysis of 9 studies. TPH1 SNP rs1799913 also has been studied along with rs1800532 to be known as a risk variant of depression and SB. The rs1800532/rs1799913 polymorphisms were shown as strongly associated with SB in both European and Asian populations [15].
Given the assumption that both structural changes of brain and genetic polymorphisms are involved in the pathogenesis of depression and SB simultaneously, we sought to investigate gray matter volume (GMV) differences, TPH1 polymorphisms, and the relationship between the two potential biomarkers in depressive disorder patients with suicidal attempts (SA). The authors performed voxel-based morphometry to detect regions of differential GMV. Based on these results, the regions of interest (ROIs) were selected, and the GMV differences of these ROIs were analyzed to investigate correlations with behavioral data related to suicide. Then the association between GMV differences and genotype data of rs1800532/rs1799913 was tested.
Methods
Subjects
Subjects were recruited from the department of psychiatry of Kyung Hee University Hospital at Gangdong, Seoul, Republic of Korea. Thirteen individuals with the diagnosis of depressive disorder were included. The diagnosis was determined according to ICD-10 criteria based on the structured interview by board-certified psychiatrists. All of them had history of SA, which were defined as any act carried out with a certain intent to die, and confirmed by others or psychiatric specialists in clinical settings. The patients group consisted of 12 females and 1 male, and was aged 20-47 years (31.9┬▒10.0 years, mean age┬▒standard deviation). Twenty healthy controls were without current or past diagnosis of psychiatric disorder, and had no history of SA. The control group consisted of 13 females and 7 males, and was aged 22-48 years (33.6┬▒6.2 years). Exclusion criteria were neurological disorders, serious head injury, mental retardation, severe somatic diseases, or contraindication to MRI scanning.
All subjects were assessed with the Scale for Suicide Ideation (SSI) [16], the Early Trauma Inventory Self Report-Short Form (ETISR-SF) [17], the Barratt Impulsiveness Scale (BIS-11) [18], and the Beck Hopelessness Scale (BHOP) [19]. For continuous variables, independent samples t-test was used, and for categorical variables, PearsonŌĆÖs chi-squared test was used to test the differences between the two groups. Written informed consent was obtained from each subject. This study was conducted according to the guidelines of the Helsinki Declaration, and was approved by the Institutional Review Board of Kyung Hee University Hospital at Gangdong (KHNMC IRB 2012-028).
MRI data acquisition
Images were acquired with a 3.0 Tesla MRI scanner (Achieva, Philips Medical Systems, Best, The Netherlands) using a dedicated 8-element phased array sensitivity-encoding head coil. A three-dimensional T1-weighted sagittal images (3DT1WI) were acquired with the magnetization-prepared rapid acquisition of gradient echo (MPRAGE) sequence with the following imaging parameters: TR=9.9 mm, TE=4.6 ms, flip angle=8┬░, FOV=240├Ś240 mm, slice thickness=1 mm, matrix size=240├Ś240, and resolution=1.00├Ś1.00├Ś1.00 mm. In addition, anatomical images were acquired with a fluid-attenuated inversion recovery (FLAIR) images (TR=11000 ms, TE=125 ms, TI=2800 ms) for finding structural abnormalities.
MRI data analysis
Statistical Parametric Mapping 12 (SPM12, Wellcome Department of Cognitive Neurology, London, UK) (http://www.fil.ion.ucl.ac.uk/spm/) was used for pre-processing of MRI data with the following steps. First, MRI images were realigned to minimize the subject motion during the scan. Second, the realigned MRI images and the 3D T1WI for each subject were co-registered. Third, the images were segmented into gray matter, white matter, and others including CSF. Then the 3D T1WI was spatially normalized into the Montreal Neurological Institute (MNI) standard anatomical space [20], and MRI images were also standardized with information of the normalization factor obtained from the 3D T1WI. Finally, the spatially normalized fMRI data were smoothed by 8├Ś8├Ś8 mm of the full within half maximum (FWHM) of the Gaussian filter to obtain 3D T1WI tissue volume maps.
To compare GMVs between the two groups, voxel-wise, one-way analysis of variance (ANOVA) tests with subjectŌĆÖs total intra-cranial volume and age as covariates were used. The threshold of p value was set at 0.001 without performing the correction of the multiple comparison with an extent threshold of 20 voxels. This extent threshold was chosen to be small enough to capture a small structure but not so small as to capture false positives. All local maxima were represented as Talairach coordinates. In addition, the cluster size and the peak T value of areas of significant increase were given. Relevant anatomical landmarks and BrodmannŌĆÖs areas (BA) were identified using GingerALE (http://www.brainmap.org), and analyzed step by step using Talairach Client (http://www.talairach.org). Then ROIs were chosen based on the significant results of voxel-based comparison between the two groups. The ROIs were fixed using Automated Anatomical Labeling and wfu_pickatlas toolbox for SPM12. The GMV values of each ROI were measured using MRIcroN. Differences of GMVs from each ROI between the two groups were assessed using t-test. To avoid chance findings due to multiple testing, Bonferroni correction was applied.
SNP genotyping
Genomic DNA was isolated from the whole blood of all subjects using the High Pure PCR Template Preparation kit (Roche, Mannheim, Germany). SNP genotyping was conducted using direct sequencing using the following primers for both rs1800532 and rs1799913 (sense,5ŌĆÖ-GCCAGGAATTCATCAAATGG-3ŌĆÖ; antisense,5ŌĆÖ-CAAGCCAATTTCTTGGGAGA-3ŌĆÖ). All PCR products were sequenced using an ABI PRISM 3730XL analyzer (PE Applied Biosystems, Foster City, CA, USA). Sequence data were analyzed using SeqManII software (DNASTAR Inc., Madison, WI, USA). Hardy-Weinberg equilibrium (HWE) was performed using SNPStats (http://bioinfo.iconcologia.net/snpstats/start.htm). Haploview 4.2 (Broad Institute, Cambridge, MA, USA) was used to calculate the pairwise linkage disequilibrium (LD) between the two SNPs. PearsonŌĆÖs chi-squared test was used to test for group differences of genotype and allele frequencies.
Relationship among GMV, behavioral, and genotype data
Each patientŌĆÖs GMV values were extracted for each ROI obtained by the procedures described above. Correlation matrices were used to evaluate the relationship between the GMV and the clinical variables (SSI, ETISR-SF, BIS-11, and BHOP) in the patients. The normality of the data was assessed using Shapiro-Wilk test, and SpearmanŌĆÖs rank correlation tests were applied on the parameters. In order to investigate the relationship between GMV differences and alleles, differences of GMV values according to genotypes (minor allele homozygotes and heterozygotes vs. major allele homozygotes; minor allele homozygotes vs. heterozygotes and major allele homozygotes) were compared using an independent samples t-test. All statistical analysis was performed using R version 3.4.3 (https://cran.r-project.org/), and Bonferroni correction was applied.
Results
Behavioral data
Table 1 summarizes the characteristics and behavioral data of the subjects. Age (p=0.556) and gender (p=0.169) were not significantly different between the two groups. The subjective ratings for SSI, ETISR-SF, BIS-11, and BHOP were obtained from 30 subjects, but not from 3 subjects of the controls denied to report those. The scores of SSI (p<0.001), ETISR-SF (p=0.005), and BHOP (p<0.001) were significantly much higher in the patients than those in the controls analyzed by using ttest. There was no significant difference in the scores of BIS-11 between the two groups (p=0.58). A lowered significance level of p value to 0.006 (=0.05/8 for the four behavioral variables and the two groups) by Bonferroni correction was applied to this comparison.
MRI data
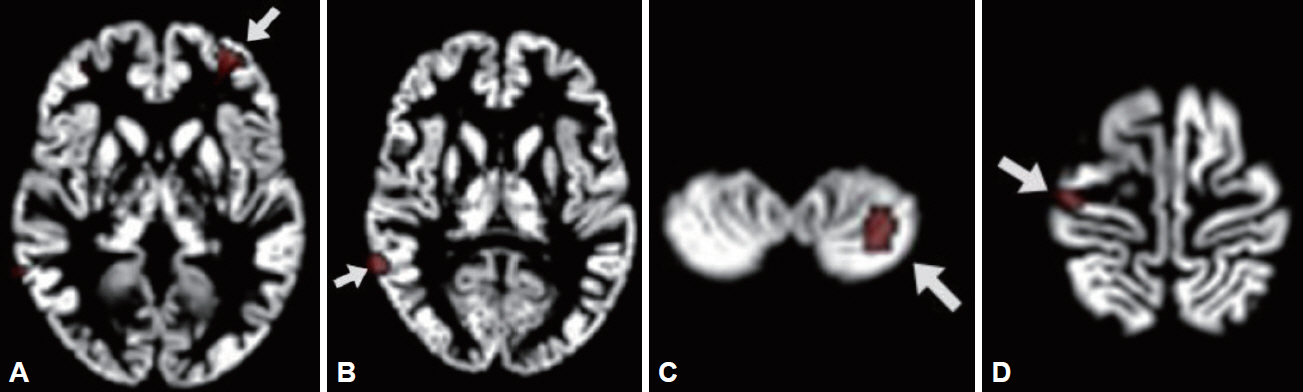
Compared to the controls, the patients showed reduced GMV in the left cerebral region including middle frontal gyrus (BA 10), inferior frontal gyrus, and anterior cingulate cortex (BA 32); in the right middle temporal gyrus (BA 21); in the left cerebellar tonsil; and in the right cerebral region including precentral gyrus (BA 4) and postcentral gyrus [BA 3, ANOVA, df=(1.0, 30.0), p<0.001]. These regions were selected for ROIs (Figure 1). ROI 1 consisted of left middle frontal gyrus, inferior frontal gyrus, and anterior cingulate cortex; ROI 2, right middle temporal gyrus; ROI 3, left cerebellar tonsil; and ROI 4, right precentral gyrus and postcentral gyrus. All the GMV values extracted from each ROI were significantly decreased in the patients than those in the controls (p<0.001) (Table 1). The p value of 0.006 (=0.05/8 for the four ROIs and the two groups) was applied to a significant threshold.
Genotype data
Genotype distributions of both rs180052 and rs1799913 in the controls and the patients groups were in HWE. The individuals included in the counts of genotypes and alleles for the two SNPs were same subjects. With the finding that the two SNPs were in LD (|DŌĆÖ|=1.0, r2=0.941) indicating strong association between the alleles, we considered the two SNPs as one for the correction of multiple comparisons. For both SNPs, the genotype and allele frequencies were not significantly different between the two groups (rs1800532: genotype, Žć2=3.540, df=2, p=0.170, allele, Žć2=2.128, df=1, p=0.145; rs1799913, genotype, Žć2=4.357, df=2, p=0.113, allele, Žć2=2.754, df=1, p=0.097).
Relationship between GMV and behavioral data
A correlation was found between BIS-11 scores and the ROI 3 GMV values (r=0.647, p=0.017) in the patients. However, it did not remain significant after Bonferroni correction. No significant correlation was found between other behavioral data and other ROIs GMV values.
Relationship between GMV and genotype data
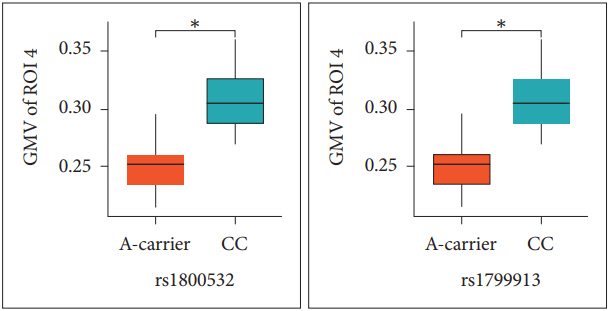
For investigating the GMV differences according to allele, we compared the GMV values from 4 ROIs between A-carriers (AA and CA genotypes) and CC genotype subjects in the patients (Table 2). For both rs180052 and rs1799913, the ROI 4 GMV values of A carriers were significantly decreased compared to those of CC genotype subjects in the patients (p=0.010) (Figure 2). The significance level of p value was 0.013 (=0.05/4 for the four ROIs). No difference was found for other ROIs GMV values between the two groups. Then we tried to analyze the GMV differences from 4 ROIs between C-carriers (CC and CA genotypes) and AA genotype subjects. However, we were not able to perform statistical analyses in the patients because the number of subject with AA genotype was one for both SNPs. In the controls, we found no difference of 4 ROIs GMV values between C-carriers and AA genotype subjects for both SNPs (data not shown).
Discussion
This is a study attempting to elucidate neurobiological mechanisms underlying depressive disorder with SB. A link between GMV differences and genetic polymorphisms was investigated. The patients showed significant GMV reductions in the left cerebral region including middle frontal gyrus (BA 10), inferior frontal gyrus, and anterior cingulate cortex (BA 32). GMV reductions in the middle frontal gyrus are consistent with previous studies with depressive disorder patients [5,21,22]. Abnormalities in activity of the middle frontal gyrus were reported in functional studies of depression [23,24]. Altered functional connectivity between the middle frontal gyrus and other regions such as insula and anterior cingulate cortex was also found in depression [25,26]. Taken together, changes in the middle frontal gyrus GMV could be essential to the pathophysiology of depression, particularly to emotional processing.
In the analysis among ROIs GMV and behavioral data, we found a trend of correlation between BIS-11 scores and the left cerebellar tonsil GMV values in the patients. Impulsivity is one of the most studied endophenotypes in suicide researches [27,28]. It was identified as a risk factor associated with SA in depression [29,30]. The cerebellum has been known as related traditionally to motor functions. However, recent findings showed that it was also related to the higher cortical functions such as cognition, learning, memory, and prediction [31]. While the neurobiological mechanisms of impulsivity related to the cerebellum have not been known, our results may suggest an evidence of cerebellar function involvement in the neurobiology of impulsivity.
Recently, several neuroimaging findings have supported the potential role of the precentral gyrus in neurobiological understandings of depression and suicide. Decreased cortical thickness in the precentral gyrus was noted in major depressive disorder patients [32]. A strong association between accelerated cortical thinning of precentral regions and depression symptomatology was observed in adolescents [33]. In a functional neuroimaging study, suicidal attempters with depressive disorder exhibited a reduced precentral regional response than those without SA [34]. Minzenberg et al. [35] reported that past SB was associated with higher control related activation in several brain regions including precentral gyrus in mood disorder patients. The precentral gyrus is a part of the frontal lobe that consists primarily of the primary motor cortex, and it is involved in the task of controlling the execution of the response inhibition [36,37]. Disabilities in inhibition control are associated with a more propensity to act on suicidal feelings [38]. These findings suggest that the precentral gyrus may be an important role in impulsivity regulation related to SB.
Consistent with the previous reports, we observed that the GMV values in the ROI 4 consisted of right precentral and postcentral gyri were significantly decreased in the depressed patients with SA than in the controls. Moreover, for both rs1800532 and rs1799913, the ROI 4 GMV values of A carriers were significantly reduced compared to those of CC genotype subjects in the patients. Mirkovic et al. [39] reported a strong overall association of the two SNPs with SB, and suggested that the A allele increased a risk of SB in dose-dependent manner. Taken together, our results suggest that A allele may modulate the structural changes in the precentral gyrus, which affect suicidal acts in the depressive disorder patients.
The limitation of this study is relatively small sample size to be verified in the further study with larger samples. Other limitations are as follows: diagnoses were not assessed with Structured Clinical Interview for DSM Disorders, the depressed patients who did not attempt suicide were not included in the control group, and there are needs to investigate other variants in TPH1 and to perform further molecular biologic studies for elucidating their functions. With an attempt to identify a link between cerebral structural changes and genetic polymorphisms observed in the depressive disorder patients with SA, our findings suggest an evidence of neurobiological mechanisms underlying these patients.
In conclusion, we found significant GMV reductions in several regions of frontal lobe, temporal lobe, paracentral gyrus, and cerebellum in depressive disorder patients with SA. The paracentral gyrus GMV reduction was associated with A carriers of rs1800532/rs1799913 in the patients. These results suggest that GMV differences and TPH1 polymorphisms may be simultaneously implicated in the pathogenesis of depression with SB.