INTRODUCTION
In the elderly, differentiation of cognitive impairment due to Alzheimer's disease (AD) from that of depression is one of the major challenges in both clinical and research settings.1 Dementia and depression are common and frequently comorbid in the elderly.2 Depressive symptoms are associated with poor cognitive function and rapid cognitive decline with advancing age.3 However, there are no biological markers that can successfully discriminate early AD from cognitive impairment associated with depressive disorders in the elderly. Previous studies indicate that changes in electroencephalography (EEG) associated with AD may be different from those associated with depressive disorders.45678910 Compared to normal controls, patients with AD had increases in slow waves and decreases in fast waves in EEG.4567 On the other hand, patients with major depressive disorder (MDD) had increased alpha activity and asymmetric alpha activity in frontal regions.9 However, thus far only a few studies have directly compared the EEG spectrum in both patients with AD and those with depressive disorders. Furthermore, there are no reports describing consistent common features that may be used to differentiate AD from depressive disorders. In this study, we directly compared EEG activity in patients with AD without depression with that in age- and cognitive function-matched patients with MDD. We adjusted for structural brain differences using brain magnetic resonance imaging (MRI) and found EEG features that successfully differentiated these two conditions.
METHODS
The research protocol was reviewed and approved by the Seoul National University Bundang Hospital (SNUBH) Institutional Review Board (IRB No: B-1610-366-108). The subjects included 11 patients with probable AD (7 females), who were diagnosed according to the National Institute of Neurological and Communicative Disorders and Stroke and Alzheimer's Disease and Related Disorders Association diagnostic criteria.11 Our study also included 11 age- and Short Blessed Test (SBT) score-matched patients with MDD (9 females), who were diagnosed according to the 4th edition of Diagnostic and Statistical Manual of Mental Disorders diagnostic criteria. The SBT, originally designed to identify dementia, consists of six items to evaluate orientation, registration or attention.1213 Our subjects were selected from elderly Koreans aged 60 years or older who had visited the Dementia Clinic of SNUBH from 2012 to 2013 with complaints of cognitive decline. The Clinical Dementia Ratings (CDR) of the patients with AD were 1 or 0.5 when they undergo the clinical assessment and EEG motoring. Subjects with comorbid neurologic or psychiatric disorders that may have influenced EEG activity and those taking antiepileptic or mood-stabilizing medications were excluded.
All subjects underwent a standardized clinical assessment within a month of their EEG motoring, using the Korean version of the Consortium to Establish a Registry for Alzheimer's Disease Assessment Battery (CERAD-K)14 and the Mini International Neuropsychiatric Interview (MINI).15 The subjects also completed the Korean version of the Geriatric Depression Scale (GDS-K)16 by themselves. We obtained brain MRIs from the subjects, and based on the agreements, 4 geriatric psychiatrists who blinded to the subjects' EEG results graded the following 3 indices to adjust the influence of structural brain asymmetry on EEG activity: medial temporal atrophy (MTA) score,17 Koedam score for the posterior atrophy,18 and Fazekas scores for the white matter hyperintensities (WMH).19
Resting-state EEGs were recorded for 15 minutes (7 minutes with eyes closed, 1 minute with eyes open, and 7 minutes with eyes closed) by using a 64-channel quick-cap with a Neuroscan SynAmp2 amplifier (Compumedics, Victoria, Australia). The EEG data were transformed in computer-averaged mastoids (M1 and M2) in an offline analysis. Twelve 10-second closedeye noise-free epochs were prepared for each subject using a manual screen. Fast Fourier transformation (FFT) was performed on 62 electrodes split into 5 frequency bands (delta, 1-3 Hz; theta, 4-7 Hz; alpha, 8-12 Hz; beta, 13-25 Hz; and gamma, 30-50 Hz) and 2 sub-bands of alpha and beta (alpha1, 8-10 Hz; alpha2, 11-12 Hz; beta1, 13-20 Hz; and beta2, 21-25 Hz). To calculate the relative global band powers, we followed the method of previous studies.4720 A total of 9 regions were selected based on previous EEG study21 for further analysis: left-frontal, mid-frontal, right-frontal, left-central, midcentral, right-central, left-posterior (parieto-occipital), mid-posterior, and right-posterior.
Repeated measures multivariate analysis of variance (MANOVA) was performed to compare EEG relative power in the AD and MDD groups. The polarity (frontal, central, and posterior) and laterality of the electrodes (left, mid, and right) were computed as within-subject variables. To evaluate the efficacy of EEG as a diagnostic tool for discriminating AD from MDD, a stepwise logistic regression analysis was performed with EEG parameters that were significantly different between groups in the former analyses.
RESULTS
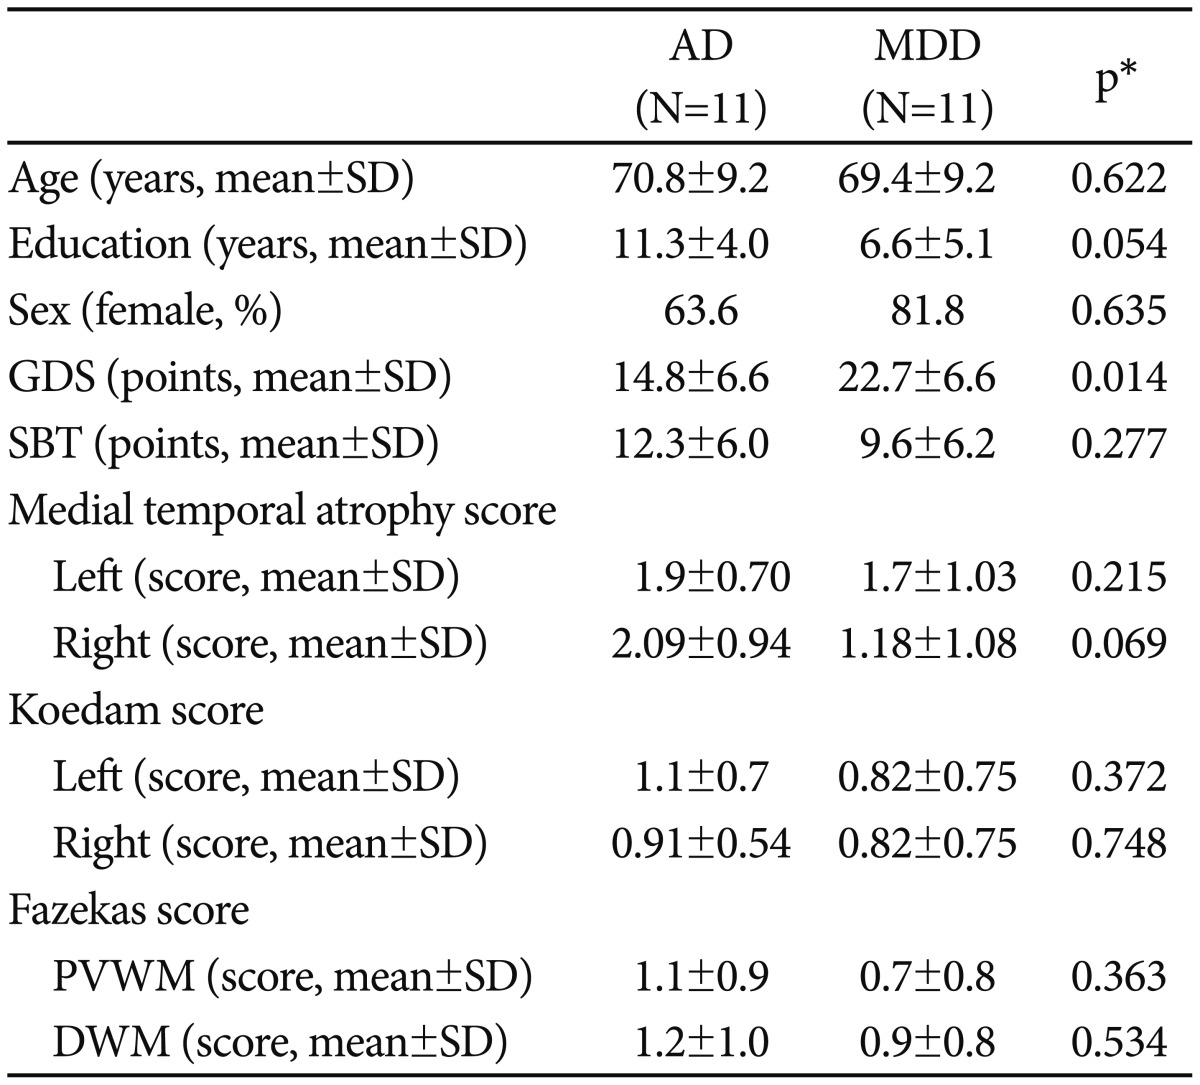
There were no significant differences in the demographics (age, sex, and education level) and the 3 indices of brain structure between the AD and MDD groups. Patients in the MDD group had higher GDS scores than those in the AD group (p=0.014) (Table 1). The repeated measures MANOVA analysis indicated that the AD group had higher global power in the theta band than the MDD group (17.43┬▒10.41 vs. 9.168┬▒8.84, F=6.302, p=0.021). In addition, the 2-way interaction between the laterality and the diagnostic group was significant in the beta (F=4.19, p=0.031) and beta1 (F=4.145, p=0.027) bands. In the MDD group, the relative powers of the beta, beta1, and beta2 bands were higher in the mid-central region compared to the left-central or right-central regions (p<0.01). They were also higher in the mid-frontal region compared to the left-frontal region (p<0.05). However, such regional differences in the beta were not observed in the AD group.
To develop the score representing the regional differences of beta power, we calculated the regional beta index (RBI) as follows: RBI=[Beta_MC-(Beta_LC+Beta_RC)/2], where Beta_ MC, Beta_LC, and Beta_RC denote the beta relative power in the mid-central, left-central, and right-central regions, respectively. Global theta power and RBI were used as independent variables and the diagnostic group (AD versus MDD) was used as a dependent variable in the stepwise regression analysis. Global theta power and RBI were included in the final predictive model for differentiating early AD from MDD with cognitive impairment (Žć2=12.00, p=0.002). The prediction ability of this model was better (Žć2=5.84, p=0.016) than that of a model including only global theta power (Žć2=6.16, p=0.013). According to receiver operating characteristic curve analysis, the area under the curve (AUC) of the model that included global theta power alone was 0.793 (p=0.020) while that of the model that included both global theta power and RBI was much better (AUC=0.893, p=0.002).
DISCUSSION
In this study, patients with AD had higher theta wave activities over all scalp areas. In addition, patients in the AD group did not have intra-individual regional differences in beta power, as was observed in the central regions in patients with MDD. The model used to differentiate AD from MDD with cognitive impairment had good discrimination (AUC=0.893).
Increased theta activity had been reported to be a pathognomonic EEG feature of AD.722 AD patients had higher theta relative power than MDD patients in both the resting state 2 and in the REM-sleep state.23 In addition, in patients with AD, theta activity had a strong negative correlation with performance in the Test for the Early Detection of Dementia with Discrimination from Depression.24 In line with these studies, global theta power was a principal predictor in discriminating AD from MDD with cognitive impairment in the current study. However, the accuracy of this predictor was limited as a diagnostic marker (ACU=0.793).
Interestingly, in patients with MDD, the relative powers of the beta bands were stronger in the midline areas than in the left or right areas, particularly in the central regions. These intra-individual differences in beta relative power, however, were not observed in patients with AD. When we employed the RBI that reflects this hyper beta activity in the mid-central area compared to the right or left central areas in combination with global theta power in the predictive model for discriminating AD from MDD with cognitive impairment, the AUC of the model significantly improved to 0.893. Ihl and Brinkmeyer10 reported that patients with MDD had more distinct beta segments than patients with AD, as indicated by spaceoriented adaptive segmentation. A segment is a stable topographic distribution of the EEG signal over a period of time. The intra-individual regional differences in beta relative power in patients with MDD in the current study may be related to the higher number of such segments.
In this study, we rigorously controlled potential confounding factors (age, sex, education, cognitive function, and structural abnormalities of the brain) in both patients with AD and those with MDD. However, our observations warrant further investigation, as our sample size was small and the use of medications was not controlled for.