Schneiderian First Rank Symptoms and Gamma Oscillatory Activity in Neuroleptic Naïve First Episode Schizophrenia: A 192 Channel EEG Study
Article information
Abstract
Objective
Schneiderian first-rank symptoms (FRS) and abnormal EEG gamma activity in schizophrenia have been reported independently to have a neurodevelopmental basis. We aimed to investigate spontaneous gamma power in two groups of first episode schizophrenia patients (those who experience FRS and those who do not).
Methods
A comparative hospital based study having 37neuroleptic naïve male patients with schizophrenia divided into two groups-FRS(+) and FRS(-) groups based on the presence of FRS. Thirty age, sex, education and handedness matched individuals served as controls (N). All participants underwent a 192-channel resting Electroencephalography (EEG) recording. Gamma spectral power was calculated for low- (30-50 Hz) and high-gamma 1 & 2 (51-70 and 71-100 Hz) bands. Spectral power was compared between three groups using MANOVA and supplementary one-way ANOVA with Bonferroni test controlling for multiple comparisons. Linear regression was used to identifying predictor variables for FRS. Pearson correlation coefficient was computed between spectral power parameters and various clinical variables.
Results
Significantly higher high gamma band-1 power was observed over right frontal (p<0.05), parietal (p<0.05) and temporal (p<0.05) regions in FRS(+) than FRS(-) group and normal controls. Right parietal high gamma-1 power and paranoid cluster on PANSS significantly predicted number of FRS in total schizophrenia patients; paranoid cluster on PANSS showed significant correlation with number of FRS in FRS(+) group.
Conclusion
Findings of our study add to the evidence that areas contained within the hetero modal association cortex are associated with FRS. The study findings also strengthen the neurodevelopmental basis of FRS in schizophrenia.
INTRODUCTION
Various symptom dimensions-positive, negative, and cognitive have been described in patients of schizophrenia.1 Each of these dimensions has an interactive effect on one other. The First Rank Symptoms (FRS) of schizophrenia described by Kurt Schneider2 represent such an interaction. Where on one hand paranoia is fundamental to FRS and these symptoms are reported most commonly by patients of positive schizophrenia, on the other hand aberrant sensory systems and abnormalities in sensory processing have been proposed to underlie these symptoms.3 These sensory processing abnor-malities cease a patient's ability to distinguish self from others and, thoughts from actions. Schizophrenia patients experiencing FRS distinguish themselves from patients experiencing psychotic symptoms other than FRS in terms of specific symptom clusters,4,5 specific abnormalities on neuroimaging (e.g., inferior parietal lobule cortical thickness),6 neuropsychology (time discrimination deficits)7 and poorer long term prognosis especially in acute phase.8
Neural oscillations in the gamma range (>30 Hz) play an important role in the development and maturation of cognitive functions like sensory processing.9,10 Not surprisingly, various studies have shown that gamma oscillations are abnormal in schizophrenia patients.11 There are several hypotheses that suggest a neurodevelopmental basis for gamma oscillations11 and hence there has been a speculation that abnormal gamma oscillations could provide support to the neurodevelopmental hypothesis of schizophrenia. First empirical evidence that developmental insults leading to aberrant cortical networks may be responsible for abnormal gamma oscillations in schizophrenia has come in the form of increased gamma power and synchrony in schizophrenia with higher number of minor physical anomalies.12 FRS on the other hand are also being proposed to have a neurodevelopmental basis.6,13 Structural abnormalities of the inferior parietal lobule, found to have an association with FRS in neuroleptic naïve schizophrenia patients,6 has been reported to be developmentally influenced.14 Imbalances of regional gray matter volumes and functional connections of the inferior parietal lobule have also been found in developmental disorders like fragile X syndro-me, Williams syndrome and Autism spectrum disorders.15,16
Considering the functional aspects, computational models describing neuronal chains for the sensorimotor integrating function of inferior parietal lobule primarily include glutaminergic and GABAergic neurotransmission.17 Moreover, glutaminergic and GABAergic neurotransmission forms the basis for functional and connectional organization of the human inferior parietal lobule.18 Hypothetically, abnormal glutaminergic and GABAergic functions might either underlie or occur simultaneously with structural deficits in the inferior parietal lobule, together leading to FRS in schizophrenia patients. Interestingly, anomalies in the networks of glutaminergic and GABAergic neurotransmission networks have been strongly implicated in the pathophysiology of dysfunctional gamma oscillations.11 Relation between abnormal gamma oscillations and FRS in schizophrenia has not yet been explored. Additionally, among the gamma oscillations, spontaneous ones are the least studied despite evidence showing close association between cognitive performance and cortical functional connectivity at rest.19,20
Although, endophenotypic nature of gamma abnormalities in schizophrenia has been emphasized, there is evidence that abnormal gamma oscillations are related to the core dimensions of schizophrenia-positive and negative symptoms.11,12 Surprisingly however, there are few studies which aimed at studying the correlation between duration of untreated psychosis and gamma oscillations in schizophrenia.
Considering all these issues, we aimed to investigate spontaneous gamma power in two groups of neuroleptic naïve first episode schizophrenia patients (those who experience FRS and those who do not) in comparison to normal controls using dense array EEG. We also aim to study the correlation between age of onset of psychosis, duration of untreated psychosis and abnormal gamma oscillations. Specifically, we hypo-thesized that patients with FRS would have significantly diff-erent spontaneous gamma power when compared to patients without FRS suggesting schizophrenia patients with FRS as a distinct subgroup of schizophrenia.
METHODS
The study was approved by the Institute Ethics Committee of Central Institute of Psychiatry (CIP), Ranchi, India. Written informed consent was taken from all the participants (and their legally qualified representatives in case of patients) before enrolling them for the study.
Data collection and participants
From the institute's research database, EEG data of schizophrenia patients recorded on 192-channel EEG was retrieved. This consisted of data of dissertations and theses whose inclusion and exclusion criteria were similar. All the patients were recruited by purposive sampling. They were in the age group of 18-50 years, having a diagnosis of schizophrenia as per ICD-10 DCR.21 Patients having history of neurological illness, significant head injury, co-morbid substance dependence (excluding nicotine and caffeine), other psychiatric disorder or history of electroconvulsive therapy within previous 6 months were excluded. EEG data recorded on 192 channels was retrieved from the institute's EEG database. Out of a total of 107 recordings, data of 7 patients was dropped due to insufficient artifact free EEG. Of the remaining 100, 37 EEG recordings belonged to neuroleptic naïve first episode schizophrenia patients. Case record files (18 page record, where 3 pages are meant for the mental status examination and two pages for consultant psychiatrist's notes) of these 37 patients were thoroughly studied for documentation of first rank symptoms. FRS are assessed according to definitions given by Mellor22 in all the cases of psychoses. Eleven symptoms described by Mellor include the following: audible thoughts, voices arguing, voices commenting, thought insertion, thou-ght withdrawal, thought broadcast, made feelings, made impulses, made volitions, somatic passivity and delusional percept.22 17 out of 37 patients were reported of experiencing one or more FRS. Presence of FRS was unequivocally established (FRS documented on 2 or more mental status examinations and seconded by a consultant psychiatrist). EEG data of 30 (age, sex, education and handedness matched) normal controls, recorded on 192 channel EEG, was also retrieved.
Clinical assessment
Relevant socio-demographic and clinical data of all the participants was collected. Handedness was assessed using the Sidedness Bias Schedule (SBS)-Hindi version.23 Baseline severity of psychopathology in patients was evaluated by administering the Positive and Negative Syndrome Scale (PANSS).24 Cluster scores were also obtained from PANSS-Anergia (N1+N2+G7+G10), Thought disturbance (P2+P3+P5+G9), activation (P4+G4+G5), paranoid/belligerence (P6+P7+G8) and depression (G1+G2+G3+G6). Healthy controls were screened with General Health Questionnaire (GHQ)-12);25 only those with scores less than 3 were included.
EEG recording
All participants had undergone an EEG recording at the Centre for Cognitive Neurosciences, CIP. Recording was carried out between 0900 and 1200 hours and participants were advised to avoid use of tea, coffee or nicotine for at least one hour before recording. Ten minutes of spontaneous resting EEG was recorded for each participant, while sitting, eyes closed, on a reclining chair in a sound attenuated room. A custom-made scalp cap with 192 Ag-Ag/Cl electrodes (Electro-Cap International, Inc., OH, USA) placed according to the international 10-5 system,26 referred to linked ear lobes, was used (Figure 1). Eye movement potentials were monitored using right and left electro-oculogram (EOG) channels. Electrode impedance was kept <5 kΩ. EEG was filtered (time constant -0.1 sec, high frequency filter -120 Hz) and digitized (sampling rate -512 Hz, 16 bits) using Neurofax EEG-1100K (Nihon-Kohden, Tokyo, Japan).
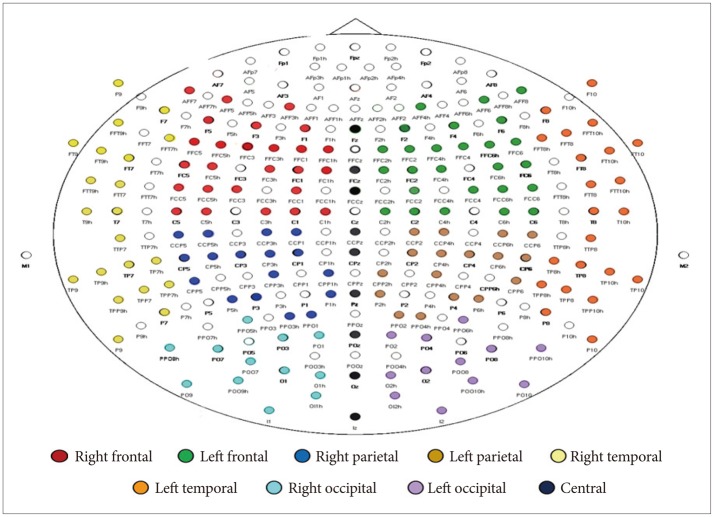
Placement of the electrodes according to the 10-5 system. Color codes show the region wise distribution of electrodes used for spectral power and coherence computations.
Spectral power analysis
First sixty-second epochs of artifact-free EEG data were visually selected from each recording after carefully excluding segments with eye movement, blink and electromyogram (EMG), movement, electrode, and perspiration artifacts or dr-owsiness changes. Selected EEG epochs were recomputed against common average reference. Spectral power, expressed in µV, (fast Fourier transform routine, Hamming window) was calculated using Welch's averaged periodogram method.27 Frequencies between 30 and 100 Hz were analyzed, divided into low-gamma (30-50 Hz) and High-gamma (51-70 Hz, 71-100 Hz) bands, with a resolution of 0.25 Hz. Spectral power was averaged region-wise (right and left frontal, parietal, temporal and occipital, and central) (Figure 1). Matlab 7.0 version (The MathWorks, Inc., MA, USA) was used for EEG analysis.
Statistical analysis
Patients were divided into two groups [FRS(+) and FRS(-)] depending on whether they experienced any first rank symptoms of schizophrenia or not respectively. Group differences for the continuous and categorical variables were computed using one-way ANOVA and Fisher's exact test, respectively. Comparison of clinical variables between the FRS(+) and FRS(-) groups was done using Independent t-test and Fisher's exact test. As the spectral power and coherence data were not normally distributed (Shapiro-Wilk test), normalization was achieved by log and Fisher's z transformation, respectively, as recommended by 'neurometrics'.28,29 The schizophrenia group (SCZ, n=37) was compared with healthy controls using Independent t-test on spectral power data (transformed). Multifactorial ANOVA for comparison of two subgroups with healthy controls was performed with gamma band frequency (3 levels: low, high 1, and high 2), laterality (2 levels: right and left) and regions (4 levels-frontal, parietal, temporal and occipital). Supplementary one-way ANOVA with post-hoc Bonferroni test was used to analyze the directionality of the group main effect and to control for multiple comparisons. We performed a linear regression analysis for total schizophrenia patients (n=37) with FRS number as dependent variable and PANSS scores and significant gamma spectral measures as independent variables using separate entry and stepping method with F value of 3.84 for entry and 2.71 for removal. Subsequently we computed Pearson correlation coefficients in the FRS(+) (n=17) and FRS(-) groups (n=20) between FRS number, PANSS scores and significant gamma spectral measures. Additionally, a linear regression analysis for PANSS scores as predictor variables for gamma spectral power (in areas where significant variation across groups and subgroups was found) was performed. The level of significance was kept at 0.05. Statistical analysis was done using Statistical Package for Social Sciences version 19.0 (SPSS Inc., Chicago, IL, USA).
RESULTS
Socio-demographic and clinical profile
Sample characteristics have been summarized in Table 1. The three groups were comparable in terms of socio-demographic characteristics, except occupation. Significantly higher number of healthy controls were employed as compared to patients in both the schizophrenia groups (p<0.01). Also, positive family history of psychiatric illness was absent in significantly higher number of healthy controls than both the schi-zophrenia groups (p<0.01). The two patient groups were comparable on age of onset of psychosis, duration of untreated psychosis as well as individual and composite PANSS scores (Table 2). Table 2 also shows that among the PANSS cluster scores, 'activation' and 'paranoid/belligerence' were significantly higher in the FRS(+) group than the FRS(-) group; 'anergia' 'thought disturbance' and 'depression' scores showed no significant difference.
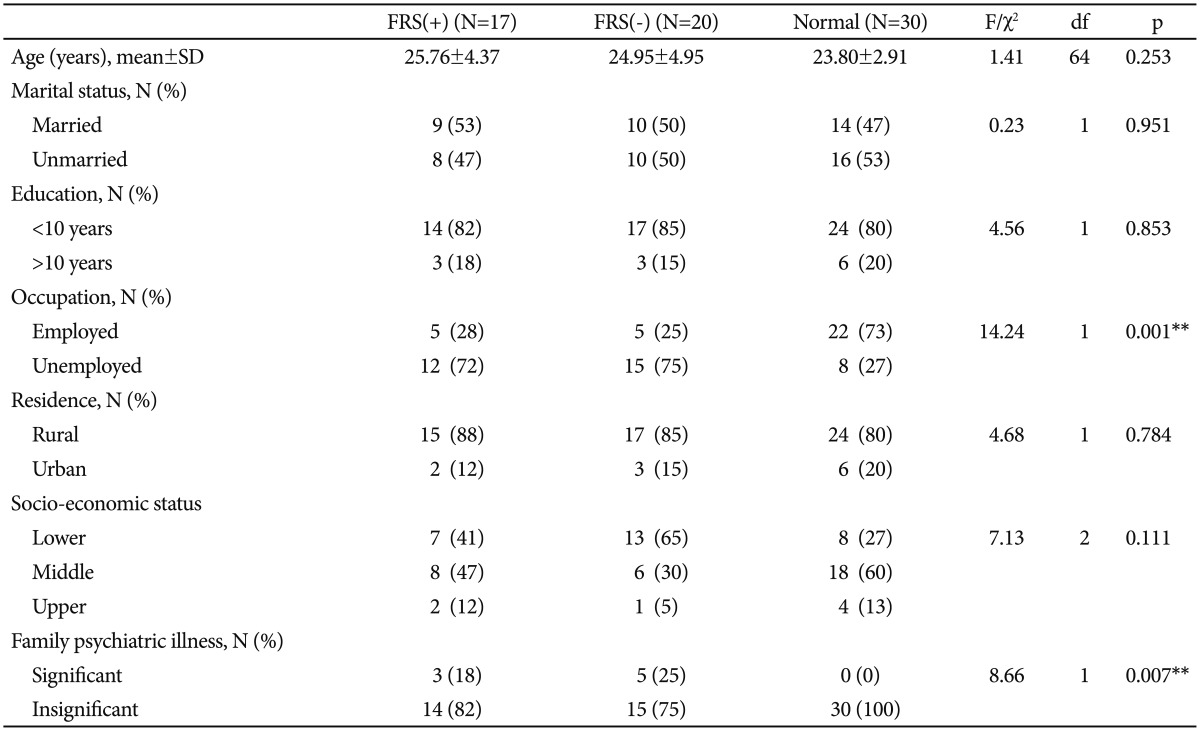
Sample characteristics
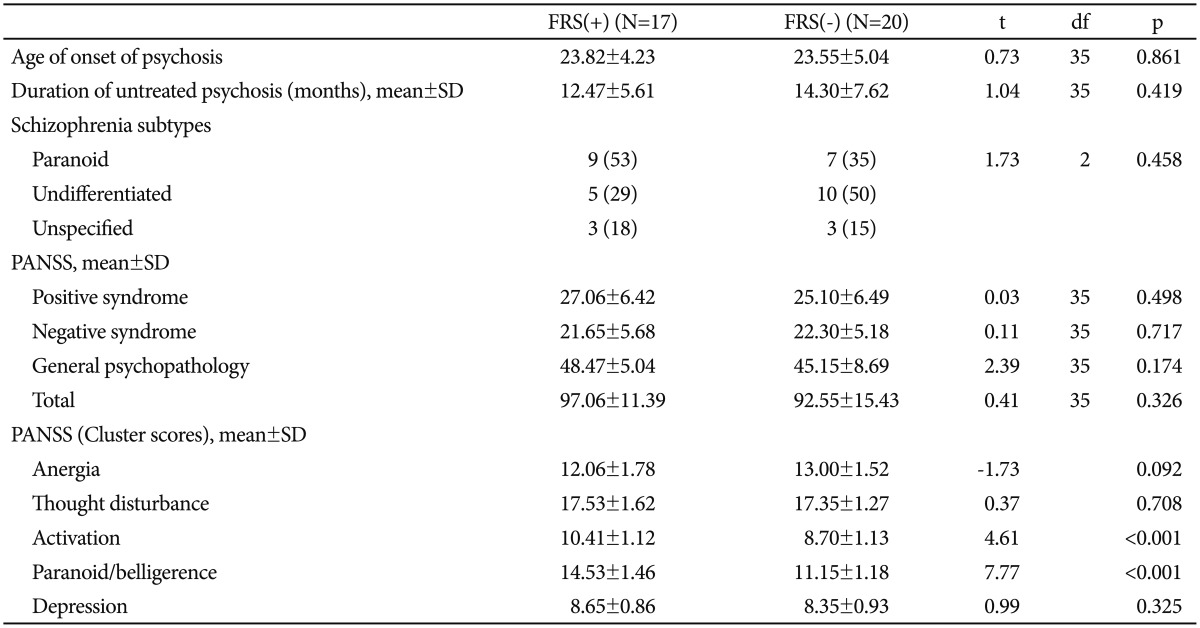
Clinical characteristics
First rank symptoms
Among the 17 patients who were experiencing FRS, 2 patients had 4 FRS each; 2 patients had 3 FRS each; 6 patients had 2 FRS; and remaining 7 patients had 1 FRS. Most frequent FRS found was auditory hallucinations with voices commenting in 3rd person (64.7%), followed by thought broadcast (52.9%) and somatic passivity (29%). Other FRS present in the sample were thought insertion and made volition (11.8%) each.
Spontaneous gamma (>30 Hz) spectral power
Comparison between schizophrenia group (n=37) and he-althy controls (n=30) showed that low gamma band (30-50 Hz) power was significantly higher in the patients group than the controls in left frontal (p<0.05) and left parietal (p<0.05) regions (Table 3). MANOVA for comparison of 2 subgroups [i.e., FRS(+) and FRS(-)] and controls showed significant interaction effect for laterality×region×group (Roy's largest root=0.142; F=2.975; p<0.05) and for gamma band×laterality×region×group (Roy's largest root=0.306; F=3.058; p<0.05). No significant interaction was found for gamma band×group (Roy's largest root- 0.016; F=0.526), laterality×group (Roy's largest root=0.027; F=0.877), region×group (Roy's largest root=0.035; F=0.740), gamma band×laterality×group (Roy's largest root=0.083; F=2.646) and gamma band×region×group (Roy's largest root=0.199; F=1.989). Supplementary one way ANOVA (Table 3) showed significant difference among three groups (i.e., FRS(+), FRS(-) and normal controls) in high gamma band-1 (51-70 Hz) power over right frontal (p<0.05), parietal (p<0.05) and temporal (p<0.05) regions. Post-hoc tests revealed significantly higher high-gamma-1 power (51-0 Hz) for these regions in FRS(+) group than FRS (-) group and normal controls. A similar trend was observed over the left temporal region, though it did not reach the significance level of <0.05. Spectral power in the low-gamma band (30-50 Hz) and the high gamma band-2 (71-100 Hz) did not show any significant difference while comparing the three groups.
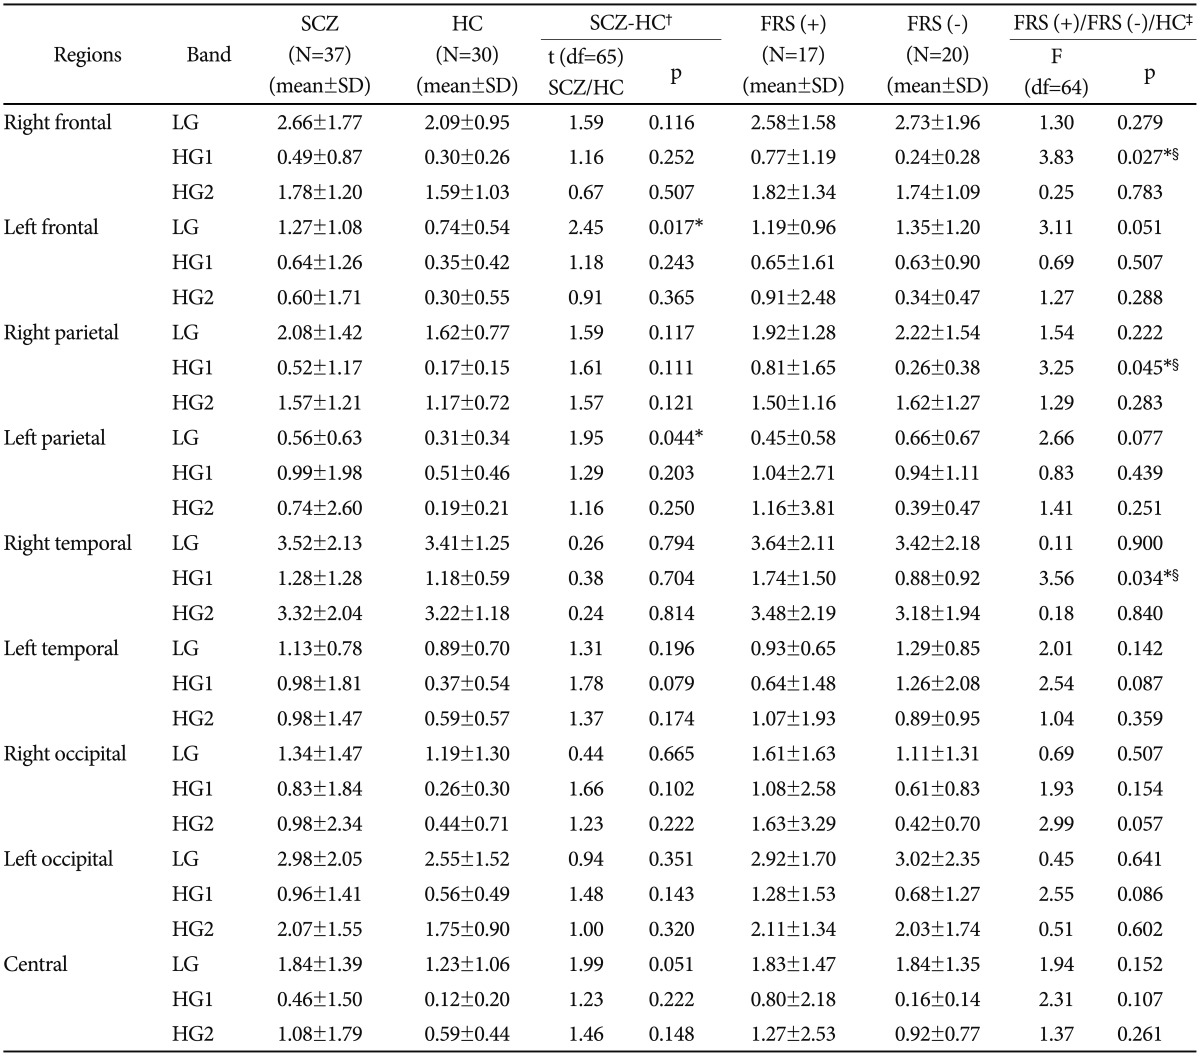
Comparison of spectral power in the low-gamma (30-50 Hz, LG), and high-gamma (51-70 Hz, HG1 and 71-100 Hz, HG2) bands across schizophrenia (SCZ) and healthy controls (HC); and, FRS(+), FRS(-) sub groups, and healthy controls (HC)
Regression and correlation analyses
Stepwise linear regression analysis found paranoid cluster on PANSS (R=0.798; Constant=-4.765; p<0.01) and right parietal high gamma-1 power (R=0.338; Constant=-0.715; p<0.05) as predictor variables for number of FRS in total schizophrenia patients (n=37). Paranoid cluster on PANSS and right parietal high gamma-1 power combined together (R=0.823; Constant=-4.619; p<0.05) too predicted the number of FRS. Among sub groups, paranoid cluster on PANSS showed significant correlation with number of FRS (r=0.562; p<0.05) in FRS (+) group (Figure 2 shows the scatter plot). No correlation between any of the PANSS scores and gamma spectral power values were found.
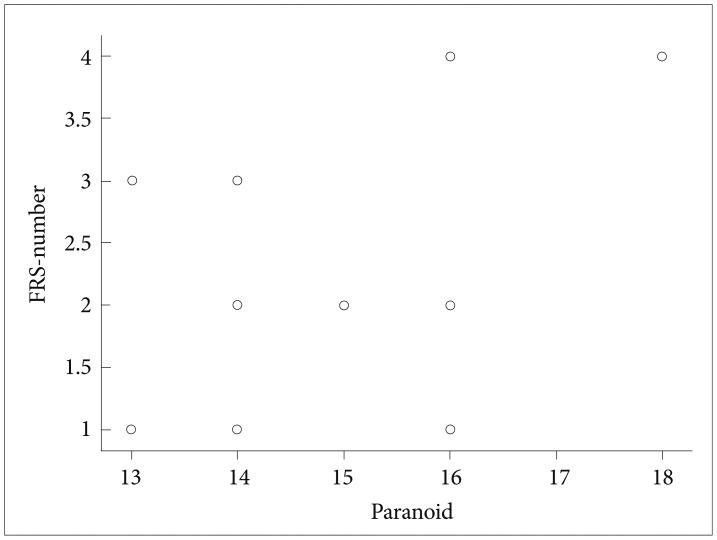
Scatter plot showing the correlation between FRS number and the core on paranoid sub cluster of PANSS in patients of schizophrenia with FRS. FRS: first-rank symptoms, PANSS: Positive and Negative Syndrome Scale.
Additional linear regression analysis for PANSS scores as predictor variables for gamma spectral power (in areas where significant variation across groups and subgroups was found) showed no significance.
DISCUSSION
Results show schizophrenia patients have increased gamma spectral power in low gamma band (30-50 Hz) than the controls in the left frontal and parietal regions. Abnormalities of the gamma activity are well documented in schizophrenia. Both increase30,31 as well as decrease32,33 in the power and syn-chrony of spontaneous gamma activity has been reported. A study using dense array EEG and unmedicated schizophrenia patients has shown similar increased gamma spectral power.12 This discrepancy may in part be explained by the heterogeneous profiles of schizophrenia patients in these studies. This heterogeneity might as well explain the discrepancy in the correlation analysis. The study results fail to show correlation of positive symptoms with increased gamma power as reported previously in studies on spontaneous, evoked and induced gamma power and synchronization.34,35,36,37,38,39,40
Significant interaction effect for gamma band, laterality and region with group was found in the study. Interestingly, spectral power in the high-gamma band-1 (51-70 Hz) is significantly higher in the FRS(+) group; specifically right frontal, parietal and temporal regions. Interest in studying the physiological role of high-gamma activity (>50 Hz) and its abnormalities in schizophrenia is a recent development. High-gamma oscillations seem be distinct in terms of temporal, spatial and functional specialization from low-gamma activity.5 As there are no studies of gamma activity in schizophrenia based on the presence or absence of FRS, further research is needed to understand the pathophysiological significance of abnormal high-gamma activity in schizophrenia and specifically in schizophrenia patients with FRS in the context of this study.
While the abnormalities in gamma activity are found in the low gamma band on left sided regions when schizophrenia patients, in general, are compared to controls, patients with FRS showed abnormal gamma power in high gamma band 1 on right sided areas. This finding emphasizes that apart from clinical, neuroimaging, neuropsychological and prognostic distinctions, schizophrenia patients with FRS are unique in terms of pattern of abnormal dense array gamma activity. Between FRS(+) and FRS(-) groups, significant differences are found in the right cortical regions specifically frontal, parietal and temporal. Moreover, right parietal power in high gamma band 1 along with PANSS paranoid cluster predicted number of FRS. These regions are comparable to the constituent regions forming hetero modal association cortex.41 These regions are particularly important for integration and appraisal of visual, auditory and tactile sensory information and are in turn crucial for 'awareness of self'.42,43 Abnormalities in the process of 'awareness of self' have been hypothesized to underlie the experience of FRS in schizophrenia.3 Findings of our study add to the evidence that areas contained within the hetero modal association cortex are associated with FRS. Further, 'increase' in gamma power in patients with FRS supports the association between functional hyperactivity in these regions and FRS.44 Moreover, right parietal spectral power in high gamma band 1 predicted number of FRS. This suggests that division of patients with schizophrenia based on the number of FRS to study gamma spectral power is apt to a certain extent as well.
Aberrations in multimodal cortical networks have been sh-own to be having neurodevelopmental underpinnings.14 In light of these findings, FRS have been suggested to have a neurodevelopmental basis.6 On the other hand, aberrations in gamma oscillatory activity have also been proposed to be developmentally modulated.11 Presence of significantly increased gamma power in schizophrenia patients with FRS in the present study strengthens neurodevelopmental basis of FRS in schizophrenia. Patients recruited in the study were neuroleptic-naïve; hence effect of antipsychotic treatment is negated. Moreover, patients sub-groups did not differ on duration of untreated psychosis and there was no significant correlation between duration of illness and abnormalities in gamma activity; this rule out the possibility that increased gamma power is due to the progression of illness. Further, to clarify whether the two groups differed on thought disturbance or not, we extracted cluster scores of PANSS (given in Table 2). Comparison of cluster scores showed that although 'thought disturbance' did not differ across the two groups, activation and paranoid/belligerence were significantly higher in the FRS (+) group than the FRS(-) group. Paranoid cluster score on PANSS was found as a predictor for the number of FRS in the total schizophrenia group and it showed significant correlation with FRS in patients with FRS. This suggests that FRS in the given group is related to thought 'content' than thought 'form'. Lack of significant correlation between thought disturbance and gamma power rules out the possibility of abnormal gamma power being associated with thought-form in the given sample.
Recruitment of patients with first episode psychosis in the present study is particularly crucial while explaining neurodevelopmental basis as the period of onset of psychosis is related to over pruning of synaptic connections.45 This is the period during which changes in the GABAergic neurotransmission and myelination of axonal fibres occurs and is compatible with maturation of gamma activity during this period.46 Animal studies show a shift from increased expression of GABA α2 subunit in early life to α1 subunit as development proceeds, which is consistent with the predominant α1expression in parvalbumin (PV)-positive basket cells involved in the generation of gamma activity.46,47,48 Observations from the present study support the implication that abnormal GABAergic neurotransmission might be associated with aberrations in multimodal cortical networks during neurodevelopment and hence may underlie genesis of FRS.
Identifying diverse sub groups of schizophrenia based on electrophysiological measures has found new interest. Schizophrenia patients with higher number of minor physical anomalies12 and with history of homicide49 are proposed to represent distinct subtypes of schizophrenia based on presence of increased gamma oscillatory activity. Investigation into the association between various developmental abnormalities, violence and FRS may be conducted in future and also observe whether presence of these variables together could classify patients with schizophrenia better.
Strengths and limitations of the study
Division of patients based on FRS in the present study formed two relatively homogeneous groups; overcoming the problem of heterogeneity. There is evidence that antipsychotic medications can alter gamma activity, which may explain some of the discrepancy in studies.50 Also, the use of common reference for estimation of gamma synchrony in some studies remains an issue. Drug naïve status before EEG recording in our patients, use of averaged reference for estimation of gamma synchrony, and the high spatial and temporal resolution offered by 192-channel EEG adds credibility to our findings. Limited sample size, recruitment of only male subjects and more importantly retrospective nature of assessment of FRS are the major limitations of our study. Future studies with larger sample size, evenly divided gender groups and prospective assessment of FRS might provide more robust evidence for the association between FRS and gamma activity.