INTRODUCTION
Alzheimer's disease (AD) is the most common form of dementia and has a strong genetic component, with up to 80% heritability, as estimated from twin-concordance studies.1,2 It is generally divided into two main subtypes. One subtype is the autosomal-dominant, familial early-onset AD (EO-AD). A very small percentage of people who develop AD have the EO variety, which is classified as the beginning of the disease presentation before the age of 65. Researchers have found out three genes whose mutations cause EO-AD. These are APP3 (amyloid precursor protein) on chromosome 21; PS14 (presenilin 1) on chromosome 14; and PS25,6 (presenilin 2) on chromosome 1. The other group is sporadic, non-familial AD, most commonly termed "late-onset AD" (LO-AD), which is defined with the disease presentation after the age of 65.
Genetic studies have provided significant insights into the molecular basis of AD. Rare hereditary EO forms of the disease have been linked to mutations of three different genes, as mentioned. These mutations explain, however, less than 1% of all cases of AD.7 Some people who have EO-AD do not have mutations in any of these three genes. That suggests that EO-AD is linked to other genetic mutations that have not been identified yet.
In this paper, "neuroimaging genetics" refers to the use of computationally-derived neuroanatomical, functional, or connectivity imaging markers as phenotype assays to evaluate the genetic variation. Recent and ongoing advances in neuroimaging genetics have made it possible to scan populations with multimodality neuroimaging to collect genome-wide data8,9 and to study the influence of genetic variation on the brain structure and function.10,11,12 Quantitative trait (QT) association studies have been shown to have increased the statistical power and thus, decreased the sample size requirements.13 In addition, neuroimaging phenotypes may be closer to the underlying biological etiology of the disease, which makes it easier to identify underlying genes.10 This study focuses on analyzing gene interactions and collective genome effects on the brain structure in ADNI EO-AD and EO-mild cognitive impairment (MCI) data. Specifically, this study uses existing LONI computational tools and techniques (e.g., the LONI Probabilistic Brain Atlas,14 BrainParser,15 and the LONI Pipeline environment16,17) to study interrelations between phenotypes, genotypes, and biomedical neuroimaging features in the subjects from ADNI.
A broad search for genes, SNPs, and alleles was used holistically to identify their associations with brain shape changes and subject phenotypes. We investigated whether or not there are collective multi-gene patterns that are significantly associated with imaging biomarkers. SNPs and other types of polymorphisms in single genes such as APOE have been related to neuroimaging measures in both healthy controls and cognitive impairment (such as MCI and AD) patients; however, a single gene or a few imaging measures may be insufficient to understand the multiple mechanisms and imaging manifestations of these complex diseases. Thus, we used a genome-wide association study (GWAS) to relate high-throughput SNP data to large-scale neuroimaging data. We conducted a GWAS on the EO-AD and EO-MCI subjects to study the genes that influence the brain structure across all the brain regions.
This article uses data from subjects aged 55 to 65 to broaden our understanding of EO cognitive impairment (especially EO-AD and EO-MCI) in terms of neuroimaging genetics. We hypothesize that some specific SNPs that discriminate between EO-AD and EO-MCI subjects may be extracted in terms of GWAS, and EO cognitive impairment patients have different ROIs specific to EO cognitive impairment. Thus, we can associate the two results and identify a significant relationship between them. Several studies have been conducted on the relationship between neuroimaging phenotypes and genetic variants, but nothing has been reported yet on either shape-based neuroimaging measures or EO cognitive impairment subjects.10,18,19 Therefore, we are attempting to expand the narrow scope of studies, in terms of EO cognitive impairment, in the field of neuroimaging genetics.
METHODS
ADNI data
ADNI was launched in 2003 by the National Institute on Aging (NIA), the National Institute of Biomedical Imaging and Bioengineering (NIBIB), the Food and Drug Administration (FDA), private pharmaceutical companies, and non-profit organizations as a $60 million, five-year public-private partnership. The primary goal of ADNI has been to test if serial magnetic resonance imaging (MRI) and positron emission tomography (PET) results, other biological markers, and clinical and neuropsychological assessment results can be combined to measure the progression of MCI and early AD. The determination of sensitive and specific markers of very early AD progression is intended to aid researchers and clinicians to develop new treatments and to monitor their effectiveness, as well as to lessen the time and cost of clinical trials. The Principle Investigator of this initiative is Michael W. Weiner, M.D., of VA Medical Center and the University of California San Francisco. ADNI is the result of the efforts of many co-investigators from a broad range of academic institutions and private corporations, and its subjects were recruited from over 50 sites across the U.S. and Canada. The initial goal of ADNI was to recruit 800 adults aged 55 to 90 to participate in the research, in which approximately 200 cognitively normal older individuals were to be followed for three years, 400 people with MCI were to be followed for three years, and 200 people with early AD were to be followed for two years. For up-to-date information, see http://www.adni-info.org.
Study participants
Data (ADNI study design): The participants were screened, enrolled, and followed up prospectively according to the ADNI study protocol described in detail elsewhere.20 The degree of clinical severity of the condition of each participant was evaluated with an annual semi-structured interview. This interview generated an overall Clinical Dementia Rating (CDR) score and the CDR Sum of Boxes.21 The Mini-Mental State Examination (MMSE) for each structural MRI scan was also conducted. APOE genotyping was determined using DNA obtained from the subjects' blood samples and was performed at the University of Pennsylvania.
The participants were selected from the ADNI database if they were classified at the baseline as 1) cognitively normal control individuals with a CDR score of 0; 2) patients with MCI with an MMSE score of between 24 and 29, a subjective memory complaint verified by an informant, objective memory loss as measured by the Wechsler Memory Scale-Revised, a CDR score of 0.5, absence of significant levels of impairment in other cognitive domains, essentially preserved activities of daily living, and absence of dementia at the time of the baseline MRI scan, and who were classified as having the amnestic type of MCI based on the revised MCI criteria; and 3) patients with AD who met the criterion for probable AD (a CDR score of 1).
These 36 EO-AD and EO-MCI subjects were chosen from among all the subjects in the ADNI database (DB) who were aged between 55 and 65 as of September 2010. Nine of them (four male and five female) had EO-AD, and 27 (15 male and 12 female) had EO-MCI.
Genotyping and PLINK (genotype data)
Individual-level genotype data in the ADNI DB were downloaded and merged to form a single dataset that contained genome-wide information for 36 individuals. Genetic analyses were performed using PLINK version 1.09 (http://pngu.mgh.harvard.edu/~purcell/plink/).
Blood samples were obtained from each participant and sent to Pfizer for DNA extraction. All the DNA extractions and genotyping were blinded to the group assignments. TGen genotyped the blinded DNA using the Illumina Human610-Quad BeadChip. Approximately 200 ng of DNA was used to genotype each subject sample according to the manufacturer's protocol (Illumina, San Diego, CA, USA). After amplification, fragmentation, and hybridization, the specifically hybridized DNA was fluorescently labeled with a single base extension reaction and detected using a BeadArray scanner. Non-specifically hybridized fragments were removed by washing them off, and the remaining specifically hybridized DNA were processed for the single base extension reaction, stained, and imaged on an Illumina Bead Array Reader. The normalized bead intensity data obtained for each sample were loaded into the Illumina BeadStudio 3.2 software, which generated SNP genotypes from fluorescent intensities using the manufacturer's default cluster settings. The data analyzed with BeadStudio are publicly available on the LONI website (http://ADNI.loni.usc.edu). The raw genotypic data were imported into a genome-wide data management system, i.e., SNPLims, to allow the export of user-defined formats compatible with the genetic programs used for the statistical analysis.
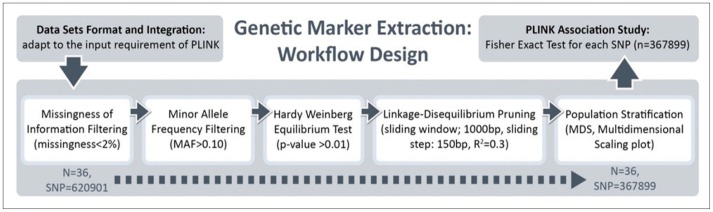
The quality control (QC) procedures were implemented for the genome-wide data. We performed all data analyses and QC procedures using the PLINK software package (http://pngu.mgh.harvard.edu/purcell/plink/), release v1.09. SNPs were excluded from the imaging genetics analysis if they could not meet any of the following criteria: 1) a call rate per SNP >90%; 2) a minor allele frequency (MAF) >10%; and 3) a Hardy-Weinberg equilibrium test result of p>0.01. A total of 367,899 SNPs were finally included in the analyses. A total of 36 EO individuals enrolled had genotype data available for analysis without exclusion.
MRI data (ADNI data)
We used the data obtained from the ADNI DB (http://www.loni.usc.edu/ADNI). The ADNI MRIs analyzed here were the baseline, screening, or follow-up scans at the entry to the study. They were acquired at multiple sites using the GE Health Care (Buckinghamshire, England), Siemens Medical Solutions USA (Atlanta, Georgia), or Philips Electronics 1.5 T (Philips Electronics North America; Sunnyvale, California) system.22 Two high-resolution T1-weighted volumetric-magnetization-prepared 180° radiofrequency pulses and rapid gradient-echo scans were collected from each study participant and normalized for intensity inhomogeneities, non-brain tissue was removed, and subcortical white matter and deep gray matter volumetric structures were segmented.23,24 The raw Digital Imaging and Communications in Medicine images were downloaded from the public ADNI site (http://www.loni.usc.edu/ADNI/Data/index.shtml). All the MRIs were processed according to previously published methods25 using the FreeSurfer version 4.1.0 software package (http://surfer.nmr.mgh.harvard.edu). The intensity gradients were followed outward from the white matter surface to find the gray matter surface (gray-cerebrospinal fluid boundary).26,27
LONI pipeline environment
LONI Pipeline16,28 is a graphical workflow environment that allows the design, execution, validation, and provenance of complex heterogeneous computational protocols. In this paper, the Pipeline environment was used to investigate the interrelations between the subjects' phenotypes, genotypes, and biomedical imaging markers, including volumetric and shape-based measures of their brain structure. For the EO ADNI subjects, our analysis protocols included automatic imaging feature extraction, geometric modeling, and statistical analysis of various global and regional anatomical measures.
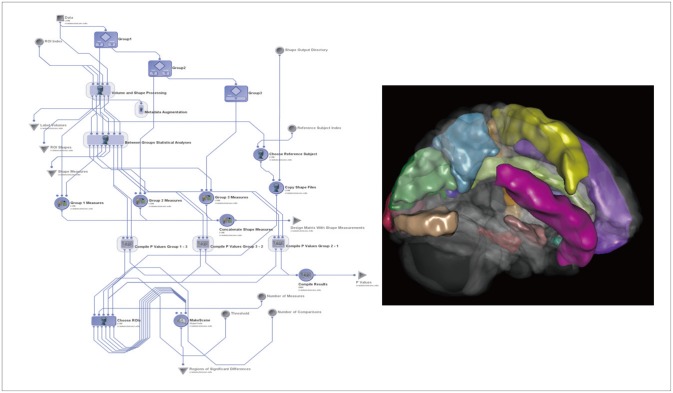
The Global Shape Analysis1,2 Pipeline workflow16 provides an automated protocol for high-throughput data preprocessing (e.g., skull-stripping29 and volumetric registration30), brain anatomical parcellation into 56 ROIs,14,15 and extraction of shape and volume measures (average mean curvature, surface area, volume, shape index, and curvedness) between the group statistical analyses of the shape regional differences, as well as generation of 3D scene files that illustrate the statistically significant regional anatomical differences between the EO-AD and EO-MCI cohorts.
Figure 1 illustrates the completed GSA workflow for this study and one 3D scene file that corresponded to the ROI volume metric. We used this GSA Pipeline workflow to obtain a set of 15 neuroimaging biomarkers.
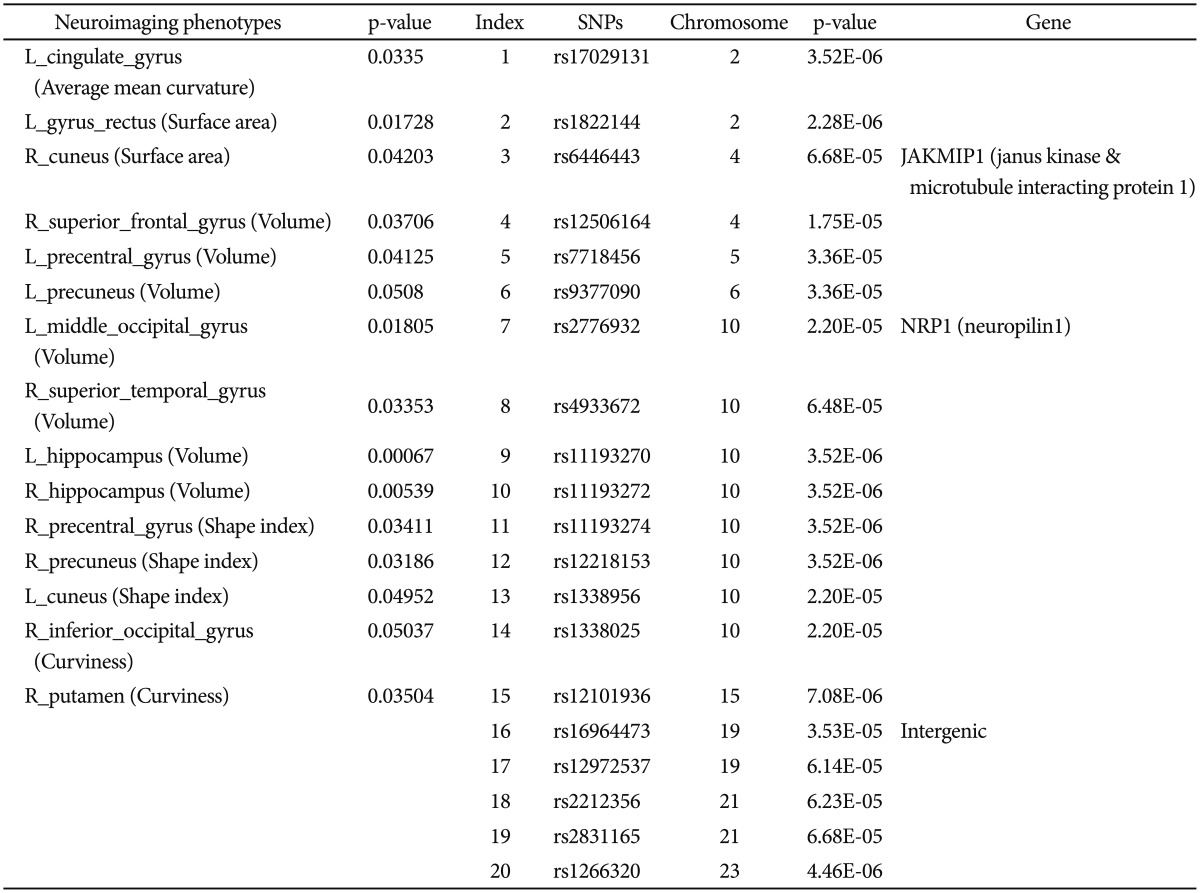
From the collection of 280 imaging markers (56 ROIs x five shape measures), we chose the 15 most significant neuroimaging biomarkers that provided the highest discrimination between the EO-AD and EO-MCI groups. We selected 15 neuroimaging phenotypes using t-tests that compared the EO-AD and EO-MCI groups (with an a priori false-positive rate of 0.05). These biomarkers are described in Table 1. The 15 neuroimaging biomarkers were derived from the structural imaging data using the GSA workflow and are based on the automated ROI extractions generated by BrainParser.14,15
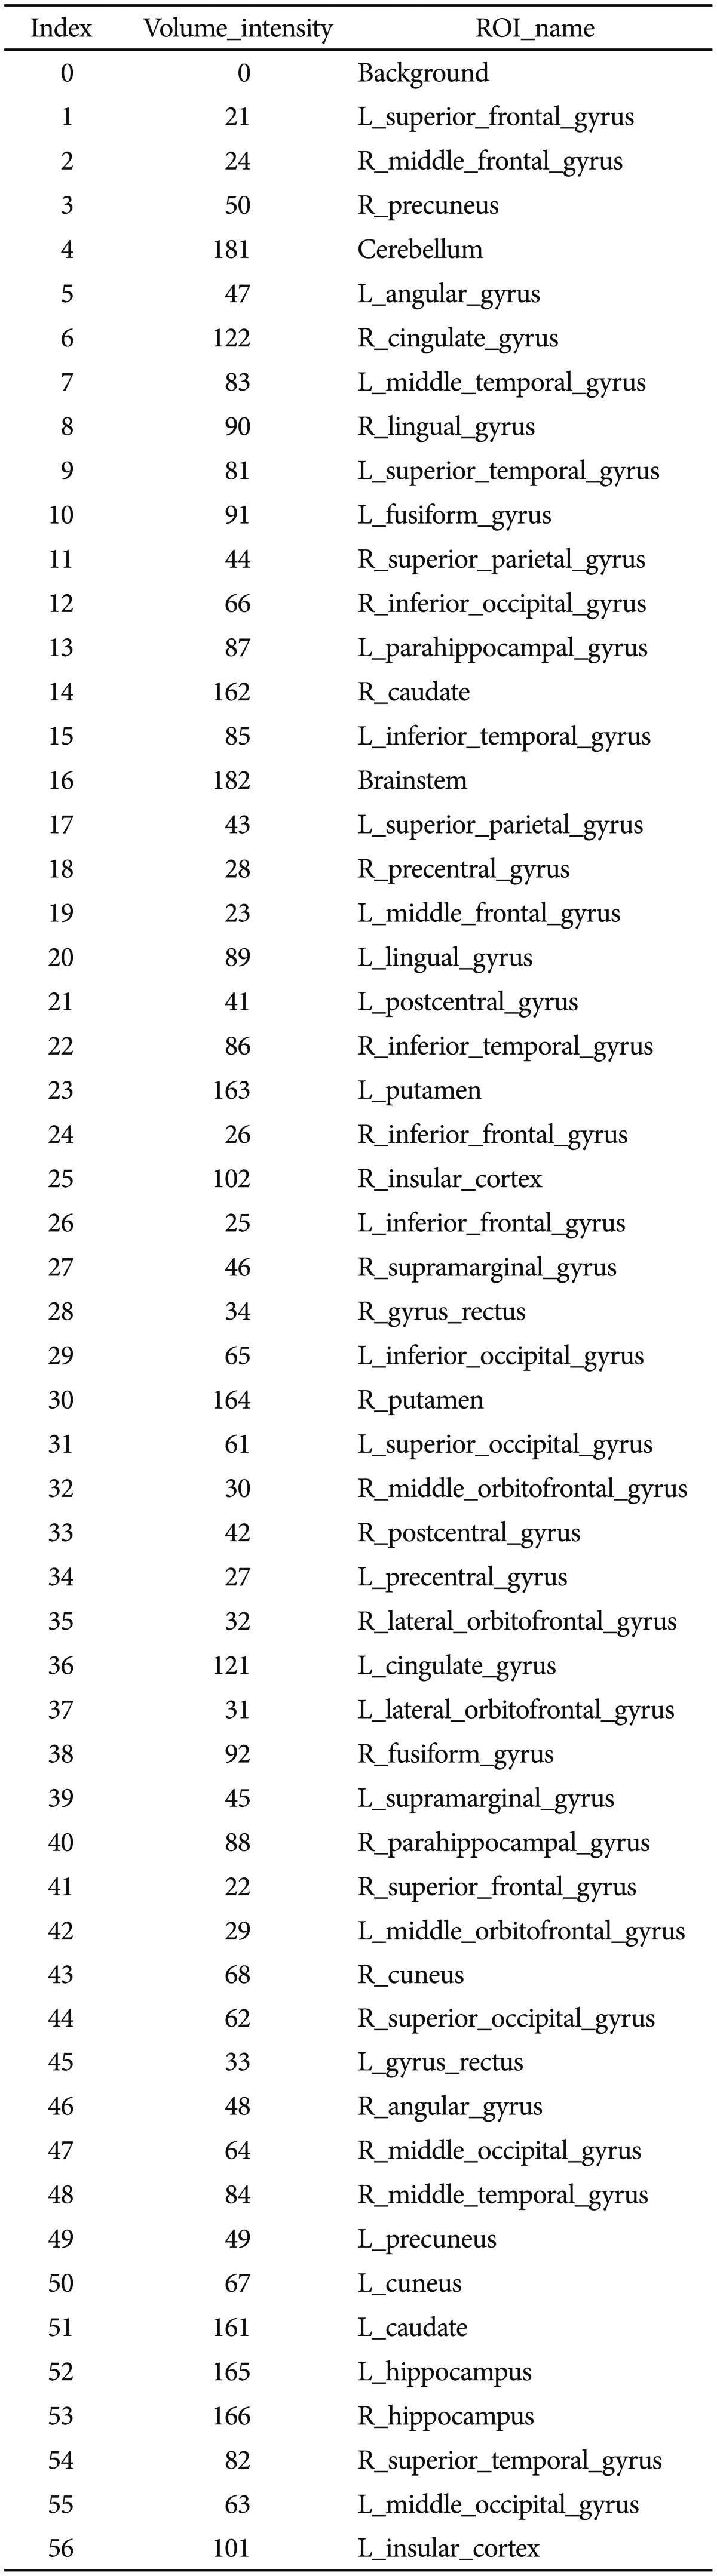
Figure 2 illustrates the LPBA40 atlas, an example of the 3D reconstruction of the BrainParser output for one subject, and the names of the 56 ROIs are shown in Table 2.
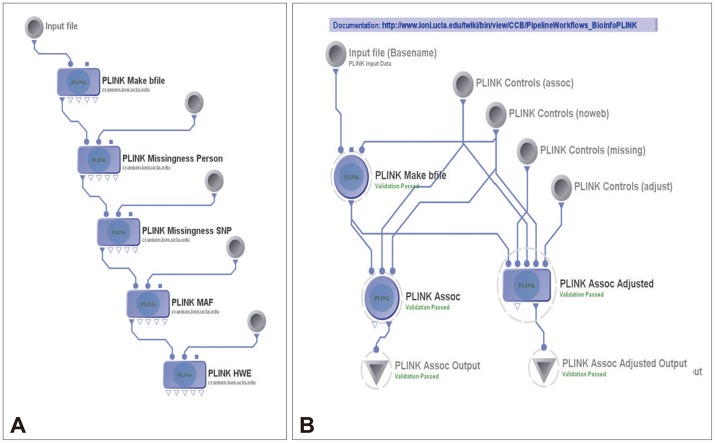
Then the 15 neuroimaging biomarkers were associated with the top 20 SNPs that were chosen with PLINK. The Pipeline workflow, as shown in Figure 3A and B, provided the most significant genotypic discriminants between the EO-AD and EO-MCI subjects. Figure 3A shows the quality control pipeline workflow, and Figure 3B illustrated the genetic association study workflow.
Genetic association analysis
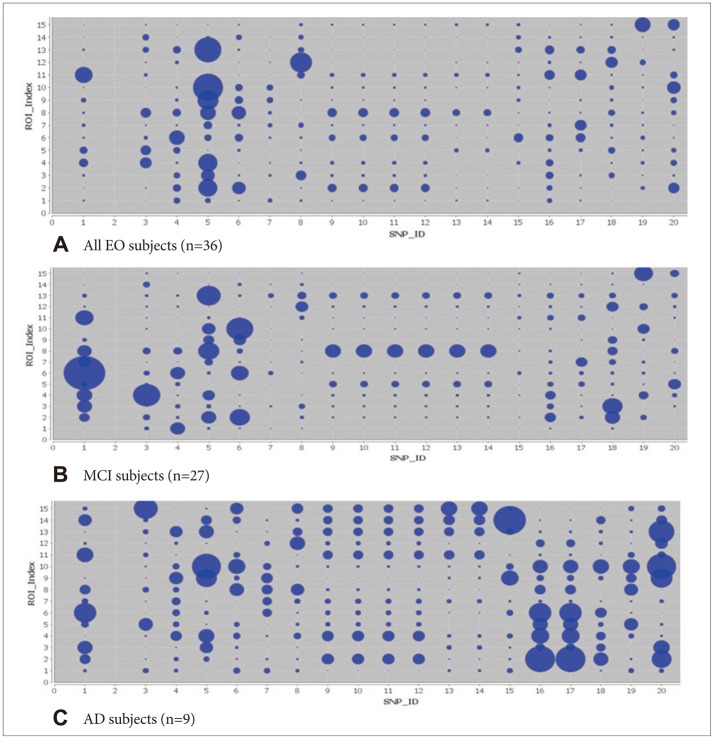
We used standard genome-wide association study (GWAS) techniques31,32,33 to extract 20 SNPs according to their p-values that showed significant differences between the EO-AD and EO-MCI subjects. The results of the association between the 20 SNPs phenotypes and the 15 neuroimaging biomarkers are shown using circular connections34 and bubble35 charts.
RESULTS
Demographic characteristics
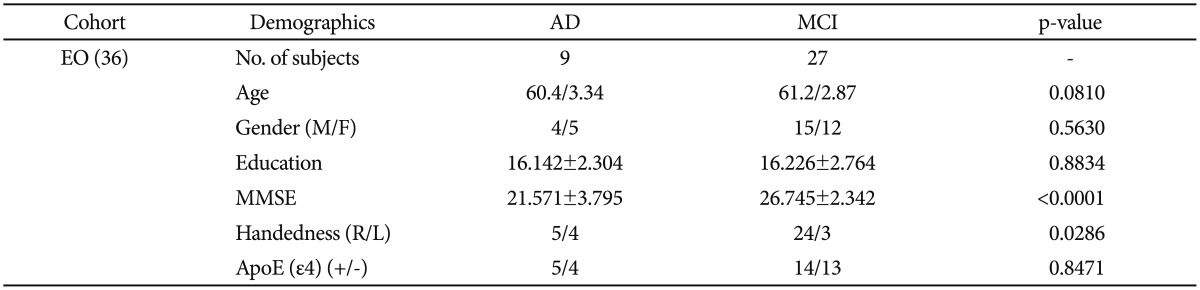
The demographic and clinical data of the subjects at the baseline are summarized in Table 3 (using chi-square and t-test analyses). EO subjects (aged between 55 and 65 years) were chosen from the 589 ADNI datasets. There was no statistically significant difference in age between the EO-AD and EO-MCI subjects.
SNP phenotypes and neuroimaging biomarker selection
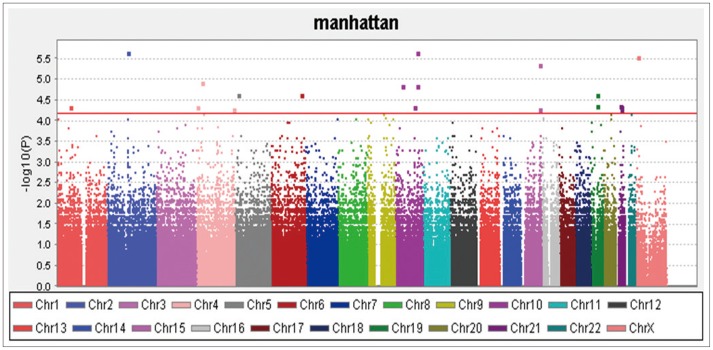
The QC results are shown in Figure 4 and the 20 SNPs that were chosen according to their p-values are shown in Figure 5 and Table 1. The QQ normal probability plot is shown in Figure 6. The 15 most significant neuroimaging biomarkers were selected from among the 56 ROIs and five different volume- and shape-based metrics, based on how well they discriminated between the two cohorts in Table 1.
Genetic association study
The genetic association study between the 20 SNPs and the 15 neuroimaging phenotypes are shown in Figure 7. The Pipeline workflow used to compute these SNP-imaging biomarker associations is shown in Figure 3B.
In the association results of all 36 subjects, as shown in Figure 7A, there were several significant results (p<0.01) such as between rs7718456 (Chr 15) and L_rectus_gyrus (surface area) (p=0.00964); rs7718456 (Chr 15) and R_superior_frontal_gyrus (volume) (p=0.00867); rs7718456 (Chr 15) and L_hippocampus (volume) (p=0.00566); rs7718456 (Chr 15) and R_hippocampus (volume) (p=0.000618); rs4933672 (Chr 10) and R_precuneus (shape index) (p=0.00476); and rs7718456 (Chr 5) and L_cuneus (shape index) (p=0.00125).
In the association results of the 27 MCI subjects, as shown in Figure 7B, there were several significant results (p<0.001) such as between rs9377090 (Chr 6) and L_rectus_gyrus (surface area) (p=0.000121); rs2212356 (Chr 21) and R_cuneus (surface area) (p=0.000131); rs17029131 (Chr 2) and R_superior_frontal_gyrus (volume) (p<0.000950); rs6446443 (Chr 4) and R_superior_frontal_gyrus (volume) (p=0.000005269); rs17029131 (Chr 2) and L_Precuneus (volume) (p=0.000000008832); rs9377090 (Chr 6) and L_Precuneus (volume) (p=0.000371); rs7718456 (Chr 5) and R_superior_temporal_ gyrus (volume) (p=0.000086); rs11193270 (Chr 10) and R_superior_temporal_gyrus (volume) (p=0.000748); rs11193272 (Chr 10) and R_superior_temporal_gyrus (volume) (p=0.000748); rs11193274 (Chr 10) and R_superior_temporal_gyrus (volume) (p=0.000748); rs12218153 (Chr 10) and R_superior_temporal_gyrus (volume) (p=0.000748); rs1338956 (Chr 10) and R_superior_temporal_gyrus (volume) (p=0.000748); rs1338025 (Chr 10) and R_superior_temporal_gyrus (volume) (p=0.000748); rs9377090 (Chr 6) and R_Hippocampus (volume) (p=0.000006); rs17029131 (Chr 2) and R_precentral_gyrus (shape index) (p=0.000290); rs7718456 (Chr 5) and L_Cuneus (shape index) (p=0.000024); and rs2831165 and R_Putamen (curvedness) (p=0.000232).
In the association results of the nine AD subjects, as shown in Figure 7C, there were several significant results (p<0.009) such as between rs16964473 (Chr 19) and L_rectus gyrus (surface area) (p=0.00235); rs12972537 (Chr 19) and L_rectus_gyrus (surface area) (p=0.00235); rs7718456 (Chr 5) and R_hippocampus (volume) (p=0.00272); rs1266320 (Chr 23) and R_hippocampus (volume) (p=0.00275); rs1266320 (Chr 23) and L_cuneus (shape index) (p=0.00537); rs12101936 (Chr 15) and R_inf_occipital_gyrus (curvedness) (p=0.00138); and rs6446443 (Chr 4) and R_putamen (curvedness) (p=0.00821).
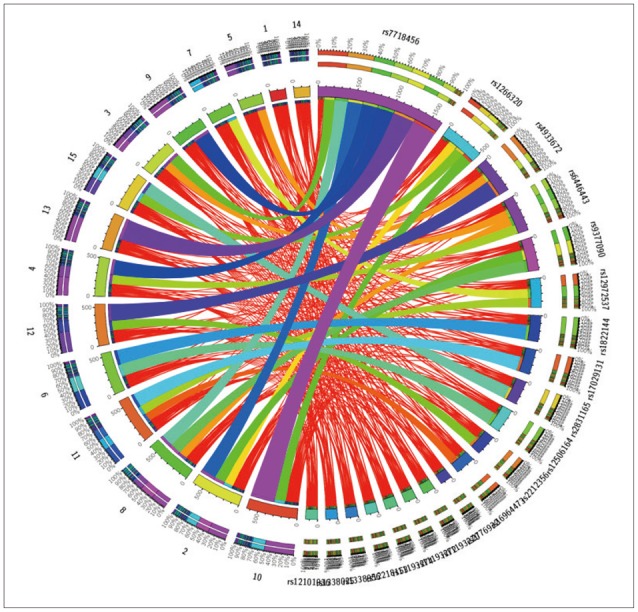
In addition, we used dynamic circular connection graphs to illustrate the relationship between the significant SNPs and the neuroimaging biomarkers, as shown in Figure 8. The left and right semicircles of the connectogram graph contain the 15_ROI imaging markers and the 20_SNPs genotypes, respectively. The width and brightness of the ribbon connecting each SNP-ROI pair presents the strength of the phenotype-genotype association.
DISCUSSION
Demographic characteristics
The demographic and clinical data of the subjects at the baseline are summarized in Table 1 (using chi square and t-test statistics). We chose EO subjects who were between 55 and 65 years old from the entire 589 ADNI data set. There were significant differences in gender, MMSE score, and APOE status between total AD and total MCI subjects. On the other hand, between the EO-AD and EO-MCI subjects, there was no significant difference in age, gender, years of education, handedness, and APOE status, but the MMSE scores significantly differed, as we expected.
SNP selection
A total of 36 EO individuals enrolled in this study had genotype data available for analysis without exclusion. The flow sheet for the workflow is shown in Figure 3. We obtained the 367,899 SNPs from 620,901 SNPs via the LONI pipeline QC workflow (Figure 4A is for the QC workflow). These SNPs were selected by computing their association with the diagnosis of AD or MCI as a dependent variable using PLINK. We generated a Manhattan plot to see which SNPs were associated with the diagnosis of MCI or AD. From this plot, we were able to derive the 20 most significant SNPs, as shown in Table 2. The QQ normal probability plot (Figure 6) shows us that the EO-AD and EO-MCI groups significantly differed in their genetic findings of cognitive impairment. Two SNPs were associated with genes such as rs6446443 for the JAKMIP1 (janus kinase and microtubule interacting protein 1) gene and rs2776932 for the NRP1 (neuropilin-1) gene. The JAKMIP1 gene is associated with microtubules and may play a role in the microtubule-dependent transport of the GABA-B receptor and in JAK1 signaling and regulation of microtubules cytoskeleton rearrangements.36 The NRP1 (neutrophilin-1) gene plays versatile roles in angiogenesis, axon guidance, cell survival, migration, and invasion.37 These two genes were involved in the development of MCI to AD in a total of 36 EO individuals in this EO cognitive impairment study.
Shape measures
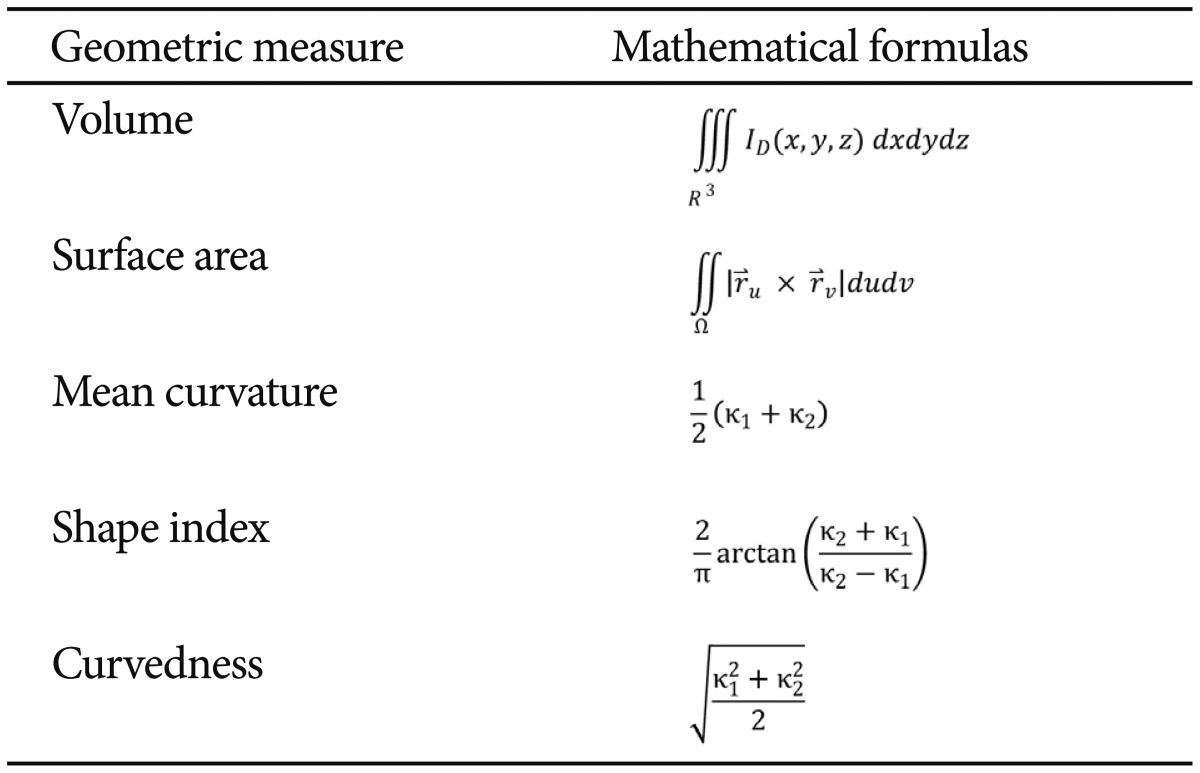
Table 4 defines the five intrinsic geometric cortical measures used in this study, and the formulas used to compute them. The principal curvatures (κ1 and κ2) were computed using triangulated surface models that represented the boundaries of different brain areas.38 ID(x, y, z) represents the indicator function of the region of interest (D),39 and SΩ:r=r(u, v) and (u, v) Є Ω is the parametric surface representation of the region boundary.40 In the local shape analysis (LSA) protocol, the structural attributes and cortical measures were calculated per vertex in specific shape regions that were first co-registered across the subjects to establish homologous anatomical features before statistically analyzing them against various demographic, clinical or phenotypic subject data.28
Global shape analysis
The left and right hippocampal volumes were the most significant neuroimaging biomarkers, as we expected. The available data seem to suggest that evaluating hippocampal atrophy may be helpful in EO-AD,41 but it is difficult to say that hippocampal volumes have closer relationships in EO-AD than in LO-AD because we did not directly compare the two groups. It has been reported that EO-AD and LO-AD can differ in their typical topographic patterns of brain atrophy, which suggests that the neocortical functions can be more affected in EO-AD.41,42 The left precuneus volume was significantly reduced in the EO group, which supports the findings of some previously mentioned studies, which may explain why precuneal atrophy is more prominent in patients with EO than in patients with LO.43,44 The precuneus is located beside the temporo-parietal junction, where greater neocortical atrophy is reported in EO-AD than in LO-AD.41 In this study, the 'shape index' measure of the right precuneus was also significant, which indicates the possibility of various shape-metric changes in the precuneal region. The 'average mean curvature' metric indicated that the left cingulated gyrus and the left superior temporal gyrus significantly differed between EO and LO, which suggests that EO-AD differences may be preferentially related to atrophy of the posterior cingulated cortex and the temporal lobe.45
Genetic Association Study (GWAS using selected SNPs and shape measures)
We can see all the results in the bubble charts (Figure 7) and the circular representation (Figure 8). The bubble size increased according to the increase in the significance of the association between the neuroimaging phenotypes and the SNPS. The stripes in the circus could be seen better from the foreground as the significance increased. The results for all the 27 MCI subjects and nine AD subjects show that several associations between the neuroimaging genetics and the SNPs were statistically significant, although they could not be survived by FDR correction. The left and right hippocampal volumes, and the left precuneal volume and the right precuneal shape index, were as significantly associated as the neuroimaging phenotypes in this analysis. In this study, the JAKMIP1 gene (rs6446443) and the NRP1 gene (rs2776932) were associated with the neuroimaging and genetic phenotypes. For all the 36 subjects, SNP rs7718456 at chromosome 5 was most significantly associated with both hippocampi volumes. For the 27 EO-MCI subjects, SNP rs17029131 at chromosome 2 was most significantly related to the left precuneus volume. For the nine EO-AD subjects, SNP rs1822144 at chromosome 2 was significantly associated with the left precuneus volume. Similar to these, both hippocampal volumes and the left precuneus volume were significantly associated with specific SNPs. Thus, we could conclude that the hypotheses we mentioned in the introduction correspond with these results. We expect to validate these results using a large population of EO cognitive impairment patients and to compare them with the results for LO cognitive impairment patients in terms of neuroimaging genetics.
Limitations
In this EO study, the sample size was rather small due to significant data stratification and lack of available data. This contributed to the relative weakness of the statistical results. The small sample size also kept us from statistically analyzing individual APOE 2, 3, and 4 alleles. Since the ADNI did not include genetic information for the normal controls, we had no way of comparing the AD and MCI subjects against age-matched healthy individuals. Even with the small number of EO subjects, though, we were able to make several neuroimaging genetics observations regarding the EO-AD and EO-MCI cohorts. In this study, we developed a protocol for performing neuroimaging genetics analysis using the LONI Pipeline environment. The methodology presented here can be used as a basis for future large-scale neuroimaging genetics studies.