Wake Up Time, Light, and Mood in a Population Sample Age 40-64 Years
Article information
Abstract
Objective
Concern that disturbances of sleep and light exposures at night might increase cancer risks have been expressed, but little actual exposure data has been collected. Measurements from a representative population sample were examined to understand the magnitude of in-bed light exposure at night and possible correlates.
Methods
From 1990 to 1994, a home survey of sleep disorders among adults ages 40-64 was conducted in the City of San Diego California, using stratified representative sampling techniques. Along with questionnaires, sleep logs, and 3-night wrist activity and pulse oximetry measures, bedside illumination was measured with a computer recording system. Questionnaires included the CESD depression scale and a scale of symptoms typical of winter depression.
Results
Complete data were available from 286 men and women, whose mean in-bed intervals averaged 7 hours and 42 minutes. The mean room illumination during the first part of the night was mean 12.7 lux (median 3.2 lux) and during the last 2 hours in bed averaged 28.7 lux (median 18.9 lux). Nocturnal light exposure was positively correlated with age, male gender, summer season, time in bed, wake-up time, and depressive symptoms.
Conclusion
Complex bi-directional interactions may take place between sleep disturbances, depression, time in bed, wake-up-time, and in-bed illumination. The most crucial light exposures appear to occur in the last 2 hours in bed, largely after dawn, so daylight exposure may be an important factor.
INTRODUCTION
Recent studies demonstrate that the suprachiasmatic nucleus (SCN) in the hypothalamus is a circadian clock. The production and degradation of clock-related genes are central to the biochemical generation of the circadian oscillation.1 Photic stimulation leads to increased production of immediate-early genes and certain clock-related genes in the SCN in a phase-dependent manner, inducing phase shifts. In rodents, unusual lighting schedules can cause reorganization and splitting of circadian phase components between subgroups of SCN cells.2,3
In nocturnal rodents, the circadian light-responsive interval is the dark active interval known as the subjective night or alpha. Light responsiveness may be reduced by wakefulness, since waking stimulates serotonin release that presynaptically inhibits retinohypothalamic input to the SCN.4 In human studies, the phase response curve (PRC) for bright light has been examined.5,6,7,8,9,10,11,12,13 The most responsive interval for light phase resetting is during the hours usually spent in bed, similar to the dark interval in nocturnal rodents. Light responsiveness might be greater if the person has eyes-closed in-bed, undergoing dark adaptation, making it conceivable that dim illumination passing through the eyelids could affect the circadian system. The most recent animal studies demonstrate that remarkably dim nocturnal illumination enhances the entrainment of circadian rhythms to lengthened light-dark cycles, expands circadian alpha, and alters the coupling of circadian pacemakers.14,15 Recent human studies indicate that environmental illumination during the in-bed interval can play an important role in circadian phase regulation,16 raising a question whether light-at-night might affect mood. Furthermore, exposure to light at night in shift workers has been associated with an increased cancer risk in several observational studies, but a causal role of melatonin suppression has not been demonstrated. 17,18,19
The purpose of the present analysis was to investigate the relationships between room illumination and sleep phase in a representative sample aged 40-64 years.
METHODS
Participants
Participants were recruited by random telephone calls as a structured representative sample of adults in the city of San Diego. The recruitment was performed from July 1990 through June 1994 in ethnically-balanced areas of the city with stratification by age (40-64), gender and ethnicity, as part of a survey assessing the prevalence of sleep disorders. A detailed description of the survey method has been provided elsewhere,20 and aspects of the data were published previously. 21,22,23,24,25 The UCSD Institutional Review Board approved the study, which accorded with the principles of the Declarations of Helsinki.
Procedure and instruments
Participants were interviewed at home by a trained interviewer. Questionnaires were collected concerning sleep complaints, sleep habits, general health conditions and medications. In addition, each subject completed mood scales consisting of The Center for Epidemiologic Studies Depression Scale (CES-D) plus eight questions related to atypical symptoms of seasonal affective disorder symptoms (SAD).26,27 The possible ranges of scores were 0-60 for CES-D and 0-24 for SAD, with higher scores indicating more depressive symptoms.
All participants were monitored in the community while engaging in usual daily routines including work, exercise, and habitual bedtimes. Portable lunch-box-shaped home-recording computer systems were used for the monitoring of sleep-related breathing disorders with pulse oximeters. These systems also incorporated room illumination measurement at the bedside. Photosensors monitored illumination with a range of sensitivity from 0.01 lux to more than 100,000 lux. Recordings were conducted at home for 3 consecutive nights. The subjects also wore Actillume I monitors (Ambulatory Monitoring, Inc., Ardsley, NY, USA) on the wrist to monitor activity and illumination patterns for three consecutive nights and days (i.e., ~72 hours). Since the Actillume was often covered by bedclothes during the in-bed interval, the bedside measurements of room illumination were considered the best available measures of illumination experienced during sleep.
Analysis methods
In-bed intervals for each night were estimated from the interval when the pulse oximeter transducer was worn, combined with Actillume data and daily sleep logs. The in-bed interval was divided into two parts. Two hours before getting out of bed was defined as the late in-bed period (LIBP), and the time from lights out to 2 hours before arising was defined as an early in-bed period (EIBP). Because the cross-over point of the human light phase response curve (PRC) is estimated at around 2 hours before time getting out of bed, light experienced in EIBP would usually be phase-delaying and light experienced in LIBP would usually be phase-advancing. 5,28 Analyses were applied to the logarithm of measured illumination. Because variations from 10-2 to 10-0 lux were suspected to have small or negligible biologic effect but might be weighted excessively on a log scale, lower values were set to lux=100. The mean room illumination for each in-bed period was calculated and then averaged for 3 nights. The times of going to bed and getting out of bed, and the in-bed interval length were also averaged for 3 nights. The relative variation in environmental day length was estimated by computing the cosine of the phase of the annual cycle, where June 21 was 0°.
RESULTS
Demographics
From 417 participants completing home interviews, data of 286 participants were judged technically satisfactory, based on complete technically satisfactory recordings. The final sample consisted of 153 women and 133 men ages 40-64 years when recorded. Of the sample, 75% were non-Hispanic Whites and the remaining 25% comprised an aggregate of Hispanics, African Americans, Native Americans, Asians, and Others. The mean age was 51 and 52 years for women and men, respectively. Recordings were balanced across seasons: 22% of the recordings were obtained in spring, 24% in summer, 26% in autumn, and 27% in winter.
Sleep timing
In this sample, the mean time going to bed was 22:54 (median 22:50, SD 65 min, range 19:58-2:50), the mean time getting out of bed was 6:36 (median 6:33, SD 72 min, range 3:41-11:05), and the mean in-bed interval was 7 hr 42 min (median 7 hr 44 min, SD 64 min, range 4 hr 46 min-12 hr 47 min). The time getting out of bed was positively correlated with the time going to bed (product-moment correlation; r=0.552, p<0.0001), and with age (r=0.121, p<0.05) but not with gender (ANCOVA controlled for age: F=0.12, DF=1, p=0.91), environmental day length (partial correlation controlled for age: rp=0.03, p=0.64) nor ethnicity (ANCOVA controlled for age: F=0.77, DF=4, p=0.57). Figure 1 illustrates the times getting out of bed, summarized by 5-year age intervals. The time getting out of bed was affected by age group (ANOVA: F=3.35, DF=4, p<0.05). The time getting out of bed in the oldest group (60-64 years) was significantly phase-delayed compared to the other age groups.
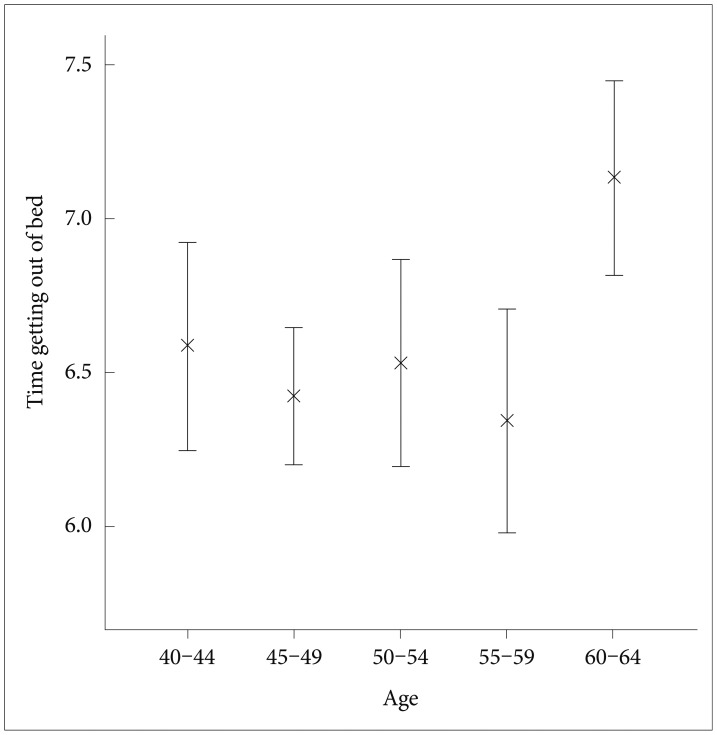
Mean (X) and standard error of the mean time getting out of bed by age group. The 60-64 years age group arose significantly later than each younger age group.
Bedroom illumination
The mean room illumination during EIBP was 12.7 lux (median 3.2 lux; SD 40.4; range 0-93.0) and during LIBP was 28.7 lux (median 18.9 lux; SD 33.6; range 0-196.5). The mean room illumination as well as log-transformed mean room illumination were significantly higher during LIBP (paired t-tests, p<0.0001). The log-transformed room illumination during EIBP and LIBP were positively correlated with each other (r=0.545, p<0.0001). The room illumination during in-bed periods was slightly higher in men (repeated measures ANOVA; factors: early-late repeated measures and gender, F=4.5, DF=1, p<0.05) The log-transformed room illumination during LIBP was also positively correlated with age (r=0.145, p<0.05) and with environmental day length (r=0.145, p<0.05) but not with ethnicity (ANOVA conditioned by age, gender and day length: F=0.65, DF=5, p=0.66). Since the log-transformed room illumination was affected by gender, age and day length, further analyses were controlled for these potential confounders using partial correlations.
Figure 2 illustrates the relationship between the room illumination during LIBP and the in-bed timing. The log-transformed room illumination during LIBP was positively correlated with the times going to bed (r=0.32) and getting out of bed (r=0.58) and with in-bed interval length (rp=0.33, partial correlation controlled for gender, age and day length, p<0.0001), but the illumination of EIBP was not correlated to in-bed timing. The log-transformed room illumination during LIBP was also positively correlated with subjectively reported wake up time (partial correlation controlled for gender, age and day length, r=0.42, p<0.0001). The log-transformed room illumination during LIBP was significantly related to age, but this effect lost significance when the time getting out of bed was added as a covariate.
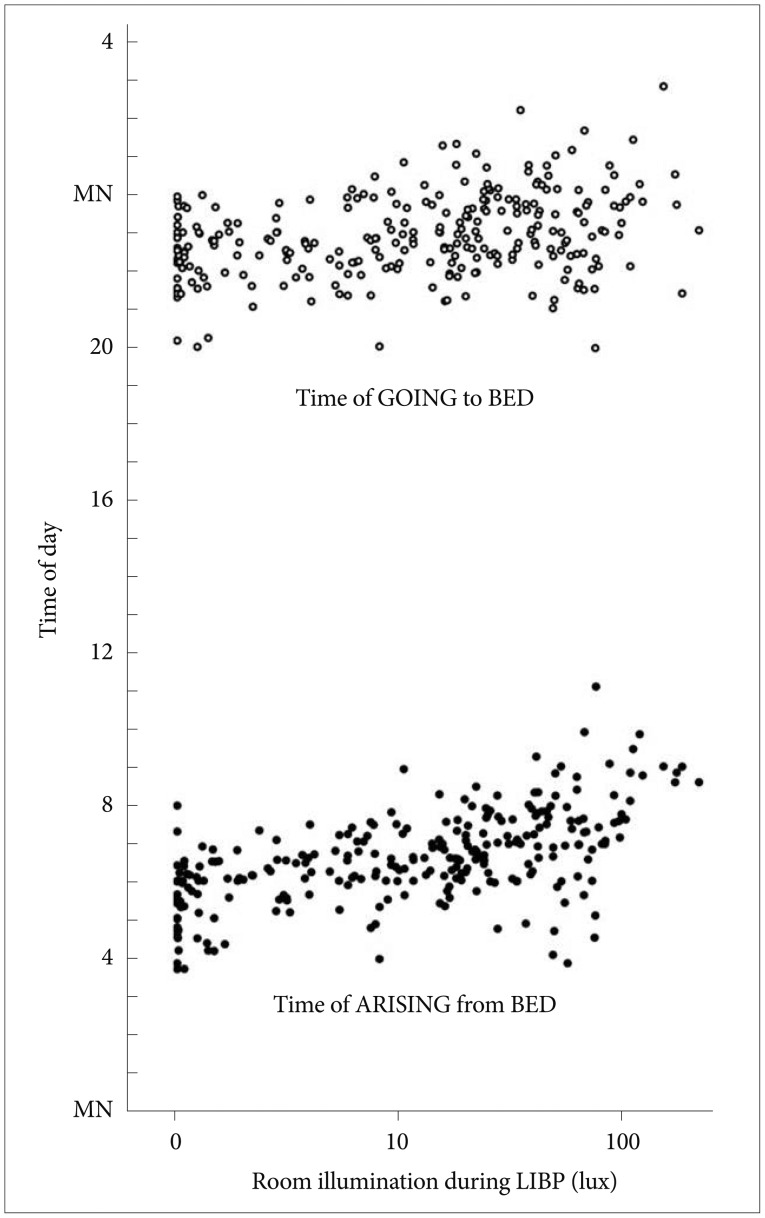
Time of going to bed (open circles) and time of getting out of bed (black circles) versus the illumination in the late in-bed interval. The illumination scale is semi-logarithmic. For convenience of display versus clock time, the times of going to bed are shown above times of awakening in the morning. The positive correlations of late-in-bed illumination with times of retiring and arising are shown. LIBP: late in-bed period.
Mood
The mean score on the CES-D was 7.5 (median 5.0, SD 8.0; range 0-43) and that on the SAD scale was 2.4 (median 1.0, SD 2.9; range 0-20). CES-D and SAD scores were positively correlated with each other (Spearman's correlation rS=0.45, p<0.0001). The CES-D score was affected by ethnicity (ANOVA: F=3.73, DF=4, p<0.01) but not by gender, age, or day length. The CES-D scores of Hispanics and African Americans were significantly higher than non-Hispanic Whites (p<0.05). The CES-D score was positively correlated with time getting out of bed (r=0.18, p<0.01), and with the in-bed interval duration (r=0.25, p<0.0001). The CESD score was also positively correlated with log-transformed illumination during EIBP (r=0.21, p=0.001) (Figure 3) and LIBP (r=0.16, p<0.05) (Figure 3), and with the log-transformed sum of illumination during in-bed period (mean illumination×in-bed period, r=0.18, p<0.01). The positive correlation to the LIBP and the sum of illumination lost significance when the time getting out of bed or the in-bed interval length was used as a covariate. The SAD score was also positively correlated with time getting out of bed (r=0.18, p<0.01), and with the in-bed interval (Pearson's correlation: r=0.14, p<0.05), but the SAD scores were not significantly correlated with early or late in-bed illumination.
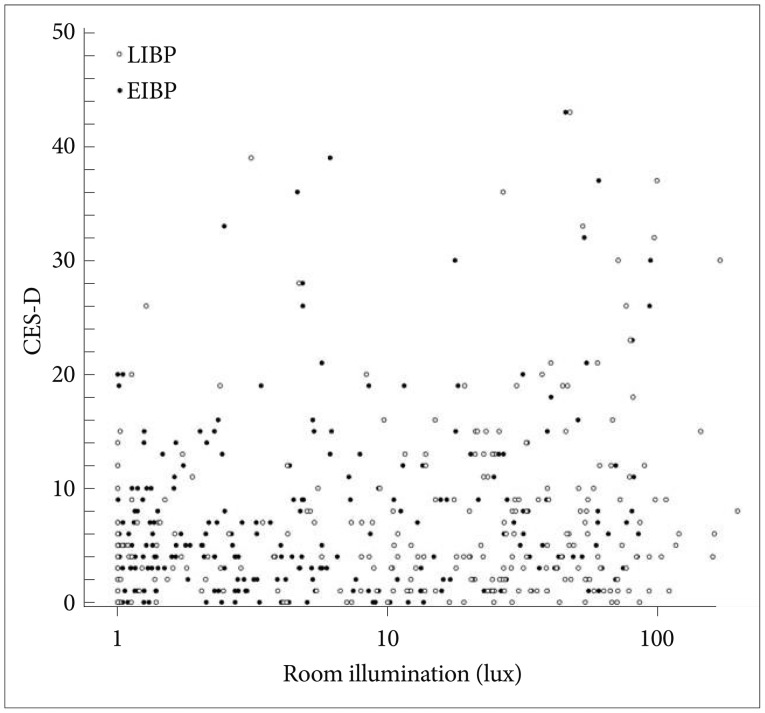
CES-D depression score (ordinate) is shown versus the in-bed illumination during the early and late intervals, showing the positive correlations. CES-D: Center for Epidemiologic Studies Depression Scale, LIBP: late in-bed period, EIBP: early in-bed period.
DISCUSSION
This analysis showed the distribution of bedtimes and wake-up times in a representative population sample: one of the few such studies using objective multi-night recordings. A surprising new finding is that the group aged 60-64 years had significantly later wake-up times than younger adults. Our preliminary analysis of these data found no significant linear trend towards later sleep with age, but only the women were examined, and ages were not classified by 5-year groups.23 Fewer women than men in this age group were employed at the time. This result is in apparent contradiction to studies from the same laboratory observing earlier bedtimes and wake-up times among older adults than younger adults,29 but those studies used convenience samples with unknown recruiting biases, and not exactly the same age groups were examined. Also, the 60-64 year-old age group may be intermediate between middle age and old age, as in the community sampled. Many begin to retire after age 60, but others are healthy enough to work past age 65. Perhaps sleeping late is for some a privilege of retirement.
The bedside recordings showed rather surprising levels of illumination in the bedrooms during the in-bed intervals. The median illumination levels in the early intervals (which would have been almost entirely before dawn) were approximately 4 times the illumination experienced under a clear sky with a full moon. The median illumination experienced in the last two hours in bed was several times greater. We do not know if these levels of in-bed illumination are biologically active, especially when attenuated by the eyelids, but as mentioned, previous human studies and the increased light sensitivity during sleep might make biological activity plausible. It is uncertain whether dim light at night would attenuate or possibly even enhance nocturnal melatonin secretion or duration of secretion.30 We also have not analyzed how much of the mean illumination during in-bed intervals was attributable to brief intervals turning on lights, e.g., to go to the bathroom. We do not know if total illumination experienced during these intervals would have more effect if it were rather steady or if brief intervals of brighter illumination were experienced.31 The illumination experienced in the beginning of time-in-bed was unrelated to bedtime, but for the last two hours in bed, illumination was greater among those who got out of bed later (and correspondingly had gone to bed later). Presumably, many of those who arose later arose in twilight or after dawn, explaining the higher bedroom light levels. However, Figure 2 does suggest that this trend begins even among those arising before 5 AM, which would be before morning twilight at this latitude at any time of year. Thus, light entering bedroom windows may not be the entire explanation.
The interesting correlation of in-bed interval length with increased LIBP illumination might simply reflect a tendency for those who spend longer times in bed to arise after dawn. Nevertheless, in hamsters, dim nocturnal illumination expands alpha, e.g., the "subjective night" which may correlate with the interval of nocturnal sleepiness in humans,32 and therefore, it is plausible that nocturnal illumination could cause a longer sleep duration in humans.
Nocturnal illumination was correlated with CES-D depression scores. In turn, both CES-D and SAD scores were correlated with sleep duration and with later times of getting out of bed. Since any significant risk factors for depression should be identified, further research is needed to clarify possible pathways of causality. Conceivably, light at night leads to expansion of alpha and expansion of the interval of melatonin secretion, which in turn, are possible etiologic factors in depression. 33,34,35 Expansion of alpha, melatonin secretion, and related sleepiness, might also result in longer sleep durations and later times of getting out of bed. Depressive symptoms may also include low energy, keeping patients from arising until relatively late. Conversely, late times of arising resulting from depression might cause more dawn illumination to be experienced during the LIBP. The latter hypothesis would not explain the correlation of illumination during EIBP with CES-D; however, perhaps light during EIBP (the phase delay region of the phase response curve) delays the wake times of those who experience it. Also, the sleep disturbance associated with depression might cause patients to get up and turn on the lights more often during the night. A large study demonstrated more light at night in a sample of elderly depressed individuals than controls, but melatonin excretion was not correlated. 36 Controlled studies may be needed to determine the causal pathways in this complex interlocking of behaviors.