Psychiatry Investig Search

CLOSE


Psychiatry Investig > Volume 20(7); 2023 > Article
Sim, Kim, Jung, Bloomfield, and Kim: Validation of the Korean Version of the Community Assessment of Psychic Experiences in General Population

Abstract

Objective

The Community Assessment of Psychic Experiences has been widely translated and commonly used as a measure for psychotic experiences and psychosis proneness in clinical and research environments worldwide. This study aimed to establish the psychometric properties (reliability and validity) and factor structure of a Korean version of the Community Assessment of Psychic Experiences (K-CAPE) in the general population.

Methods

A total of 1,467 healthy participants completed K-CAPE and other psychiatric symptom-related scales (Paranoia scale, Patient Health Questionnaire-9, Dissociative Experiences Scale-II, and Oxford-Liverpool Inventory of Feelings and Experiences) via online survey. K-CAPE’s internal reliability was analyzed using Cronbach’s alpha coefficient. Confirmatory factor analysis (CFA) was performed to investigate whether the original three-factor model (positive, negative, and depressive) and other hypothesized multidimensional models (including positive and negative subfactors) were suitable for our data. Exploratory factor analysis (EFA) was conducted to explore better alternative factor solutions with a follow-up CFA. To assess convergent and discriminant validity, we examined correlations between K-CAPE subscales with other established measures of psychiatric symptoms.

Results

K-CAPE showed good internal consistency in all original three subscales (all greater than α=0.827). The CFA demonstrated that the multidimensional models exhibited relatively better quality than the original three-dimensional model. Although the model fit indices did not reach their respective optimal thresholds, they were within an acceptable range. Results from the EFA indicated 3-5 factor solutions. In 3-factor solution, “negative-avolition” items were founded to be loaded more consistently with depressive items than with the negative dimension. In 4-factor solution, positive items were divided into two subfactors: “positive-bizarre experiences” and “positive-delusional thoughts,” while negative symptoms were separated into two distinct subfactors in 5-factor solution: “negative-avolition (expressive),” and “negative-social (experiential).” The correlation coefficients between K-CAPE subscales and corresponding measurements were significant (p<0.001), confirming the convergent and discriminant validity.

Conclusion

Our study provides evidence to support the reliability and validity of the K-CAPE and its use as a measure of psychotic symptoms in the Korean population. Although alternative factor structures did not improve the model fit, our EFA findings implicate the use of subfactors to investigate more specific domains of positive and negative symptoms. Given the heterogeneous nature of psychotic symptoms, this may be useful in capturing their different underlying mechanisms.

INTRODUCTION

Community-based studies over the past few decades have shown that a high proportion of the nonclinical populations report psychotic-like experiences (PLE) [1-6]. It has been suggested that individuals with PLE share demographic, functional, and pathophysiological characteristics with clinical populations and that they have an increased risk of transitioning to clinical conditions in the future [4,7-9]. With such increasing evidence, the continuum hypothesis of psychosis has been proposed, which states that the psychotic symptoms exist within a wide spectrum from subclinical psychotic experiences to a full diagnosis of psychosis [10-12], with varying severity and duration [5,8,13]. Accordingly, clinical attention to nonclinical groups with PLE has grown as investigations into these populations may provide a better understanding of the etiology of psychosis and other psychiatric disorders. Along with this trend, several terms indicating nonclinical populations with PLE have emerged. For instance, “Ultra-high risk (UHR)” for psychosis refers to people who are at high risk of developing psychosis although the severity of their current symptoms is not up to clinical diagnostic standards for psychotic disorders [14,15]. The Diagnostic and Statistical Manual of Mental Disorders, 5th edition also included “attenuated psychosis syndrome,” as a condition requiring further study as a means of minimizing duration untreated psychosis and promoting better outcomes in treating psychotic disorders [16]. Besides, recent studies have revealed that early intervention in the high-risk of psychosis may prevent and/or delay the onset of psychosis [17-19]. Such progression has emphasized the importance of early identification of high-risk groups in community samples, which can lead to early intervention before the transition to clinical psychosis, improving the prognosis of patients with psychotic disorders.
The process of identifying nonclinical populations with PLE requires thorough clinical interviews conducted by trained professionals. Comprehensive Assessment of At-Risk Mental States is one of representative assessment tools currently used in research settings [20]. However, it is time-consuming and impractical considering that most nonclinical populations with PLE do not visit hospitals, resulting in blind spots where high-risk groups cannot receive a proper intervention. It would be useful to develop improved screening tools that can easily identify the presence of psychotic symptoms and track the course of psychosis in community samples. Previous studies have revealed that self-reported questionnaires are valid in detecting UHR individuals and assessing psychotic symptoms [21]. By employing pre-diagnostic filtering via self-report, results can be used as references for further professional steps and can overcome limitations in clinical settings (i.e., lack of trained staff and time constraints), increasing the efficiency of identification.
Several screening tools for psychotic symptoms have been developed, among which Community Assessment of Psychic Experience-42 (CAPE-42) has been widely used in clinical and research environments [22,23]. CAPE-42 is a self-reported assessment tool developed to measure the frequency and distress of a lifetime of psychic experiences in the general population. Containing three dimensions (positive, negative, and depressive symptoms), it evaluates the overall psychotic experiences usually observed in schizophrenia. Along with its proven psychometric properties [24-27], it has played a key role as an essential assessment tool for research examining the continuum hypothesis of psychosis [8,28]. However, the validity and reliability of the Korean version of CAPE-42 (K-CAPE-42) have not yet been evaluated, though CAPE-15, comprising only positive symptoms, has been translated into Korean and validated [29]. Symptoms frequently observed in the prodromal stage include depression, increased anxiety, social isolation, and lack of motivation [30-32]. Given the heterogeneous symptoms in psychotic disorders, the simplified version may have limitations in assessing overall aspects of psychotic experiences for early detection of psychotic disorders.
Accordingly, the K-CAPE-42 seems to have the great potential to be effectively used in research and medical settings if validated as an assessment tool for individuals with PLE. Thus, we aim to evaluate the reliability and validity of the K-CAPE-42, examining whether it can be used as a measure of the degree of psychotic symptoms in the general population.

METHODS

This study was approved by the Institutional Review Board of Seoul National University Bundang Hospital (IRB no. B-2011-648-306), and we obtained informed consent from all participants. The present study was done as a part of an ongoing project, “Investigating the Mechanisms underlying Psychosis Associated with Childhood Trauma,” which aims to investigate the effect of childhood trauma on behavior, brain, and mental state.

Participants

The inclusion criteria of this study were: 1) participants who are aged 18 to 40 years, 2) those who are fluent in Korean to understand the instructions , and 3) those who have no current or lifetime history of psychotic-related diseases and psychiatric medications. Among 1,467 registered participants, 17 were excluded due to incomplete responses and/or being found to be younger or older than the age criterion.

Assessments

K-CAPE-42

In the same way as the original version, K-CAPE-42 involves 42 items, consisting of three dimensions: positive, negative, and depressive symptoms (20, 14, and 8 items, respectively). Each item contains two 4-point Likert scales. That is, participants’ lifetime prevalence of psychic experiences was first rated as “never,” “sometimes,” “often,” and “nearly always” (from 1 to 4). Next, they further indicated the degree of subjective distress as “not distressed,” “a bit distressed,” “quite distressed,” and “very distressed” (from 1 to 4).
Prior to the translation process of K-CAPE-42, we first obtained permission from the original author [1]. A clinical neuropsychologist, who is fluent in both English and Korean, translated the English version into Korean. After that, two professional psychiatrists (KET and KSY) participated in the back-translation process. Lastly, they evaluated whether translated words and phrases convey the same meaning and/or implications as the original tool despite cultural differences. As there were no significant differences between the original and the translated version, the final Korean version of CAPE with 42 items was developed (Supplementary Material in the online-only Data Supplement).

Scales used for the validation process

To evaluate the convergent and discriminant validity of the K-CAPE’s three symptom dimensions (positive, negative, and depressive), we employed several psychotic symptom-related scales. For convergent validity, each three CAPE dimensions and their corresponding tools are supposed to measure the same construct and be related to each other. Conversely, for discriminant validity, two measures should be measuring different constructs and unrelated. Thus, we assumed that two related scales would be more significantly correlated than other unrelated scales. For example, scales concerning positive symptoms would have higher correlation coefficients with CAPE-positive (CAPE-pos) dimension than with CAPE-negative (CAPE-neg) and CAPE-depressive (CAPE-dep) dimension scores. In the process of selecting scales, we considered whether it is widely used, validated, easily accessible, and measuring the same content.
The Dissociative Experiences Scale (DES-II) is a self-evaluated instrument for screening dissociative symptoms such as derealization/depersonalization, absorption, and amnesia [33]. A validation study of the Korean version of DES has been performed and proven to be valid to assess dissociative symptoms in clinical and nonclinical samples [34]. Of the three subscales, we used the depersonalization/derealization (DES-II-DD) subdomain for analysis, expecting a high correlation with the CAPE-pos dimension.
The Paranoia Scale (PS), consisting of 20 items, is a self-report screening instrument measuring the frequency of subclinical levels of paranoia, including ideas of persecution and reference [35]. The Paranoia Scale translated into Korean (K-PS) has been validated [36].
The Oxford-Liverpool Inventory of Feelings and Experiences (O-LIFE) is a 20-item self-report scale that measures psychosis-proneness covering four dimensions: “unusual experiences (e.g., magical thinking and perceptual disturbance),” “cognitive disorganization (e.g., poor attention and decision-making),” “introvertive anhedonia (e.g., reduced feelings of social and physical pleasure),” and “impulsive nonconformity (e.g., impulsive, anti-social mood and behaviors).” In this study, the dimension of introvertive anhedonia (O-LIFE-IA) and unusual experiences (O-LIFE-UE) were used for analysis to compare with positive and negative symptoms, respectively. The validity and reliability of the Korean version of these screening tools have not yet been investigated, and the validation process is in progress.
The Patient Health Questionnaire (PHQ-9) is a self-administered questionnaire which involves 9 items and screens the severity of depression [37]. Its Korean version of PHQ-9 has also been validated [38].

Statistical analysis

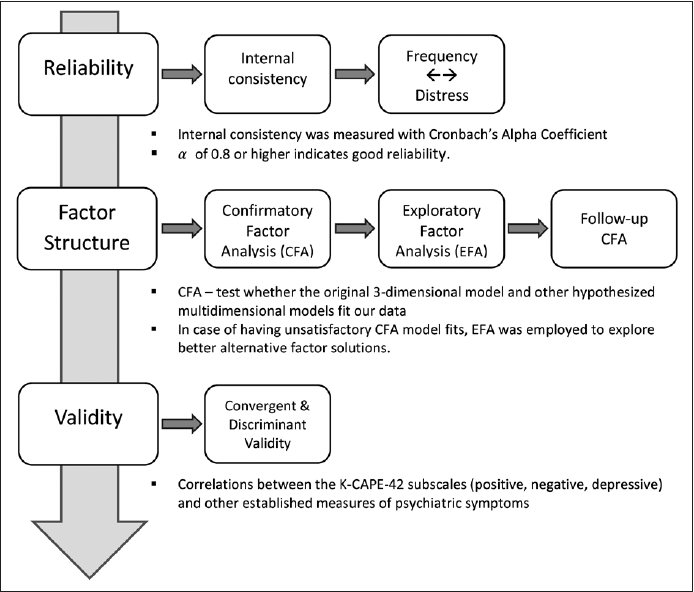
All statistical analyses were conducted using R (version 4.1.1; R Foundation for Statistical Computing, Vienna, Austria). For factor analysis, the R package lavaan was utilized (version 0.5-17) [39]. The validation process is illustrated in Figure 1.

Internal reliability

First, to verify the reliability of K-CAPE-42, assessing how well scale items are correlated with one another and measuring the same construct, we calculated Cronbach’s alpha coefficient for frequency and distress scores of the entire 42 items and those of three subfactor frequency scores (positive, negative, and depressive). Alpha values greater than 0.70 indicates an acceptable level of internal consistency for further analysis.

Confirmatory factor analysis

CAPE’s positive scale was initially developed in one dimension, but subsequent studies have proposed several multidimensional structures. Representatively, there are three-subfactors structure that distinguishes “strange experiences,” “hallucinations,” and “delusional ideations” and a five-subfactors structure that further decomposes delusional ideation into subdimensional “paranoia,” “grandiosity,” and “magical thinking” (Table 1).
We performed confirmatory factor analysis (CFA) using maximum likelihood estimation in the whole sample to investigate whether the original model and the multidimensional model fit our data. In order to assess the model fit, the goodness-of-fit indices including root mean square error of approximation (RMSEA), standardized root mean square residual (SRMR), comparative fit index (CFI), and Tucker-Lewis index (TLI) were calculated to determine whether to maintain or improve the the original model. CFI and TLI of higher than 0.90, and RMSEA of less than 0.08, and SRMR less than 0.06 are considered to indicate that they are suitable for our data [42-44].

Exploratory factor analysis

In case of having unsatisfactory CFA model fits, we would need to further investigate to see if we could find a better factor solution. Before any further analysis, the entire sample was randomly divided into two subsamples. Using the first half random sample, exploratory factor analysis (EFA) was conducted to investigate better alternative factor solutions. We employed principal component analysis with a promax rotation as our method of factor extraction. In the next step, the follow-up CFA was employed for the factor models that were generated from EFA using data from the second random sample.

Convergent and discriminant validity

Lastly, the degree of correlation between the K-CAPE subscales (CAPE-pos, CAPE-neg, and CAPE-dep) and other corresponding scales (DES-II, PS, O-LIFE-UE, O-LIFE-IA, and PHQ-9) was analyzed using Spearman’s correlation coefficient to examine convergent and discriminant validity. This analysis included a total of 1,373 participants who completed all scales.

RESULTS

Demographic characteristics

A total of 1,450 participants aged from 18 to 42 years were included in the final analysis. The mean age of the participants was 26.84 (standard deviation=5.56) years, and there were more women than men in the total sample (n=1,011, 69.72%). The entire sample was randomly divided into two subsamples for EFA, as described in the “method” section. Since sample 1 and 2 did not differ in mean age, gender ratio, and weighted total frequency scores, the randomization was considered successful. Participants’ demographic characteristics are provided in Table 2.

Reliability

Cronbach’s alpha value of total frequency and distress scores were 0.921 and 0.924, respectively, which indicates excellent internal consistency [45]. In addition to the total scores, internal reliability of frequency scores for three subfactors (Table 3) was found to be good for further analysis.
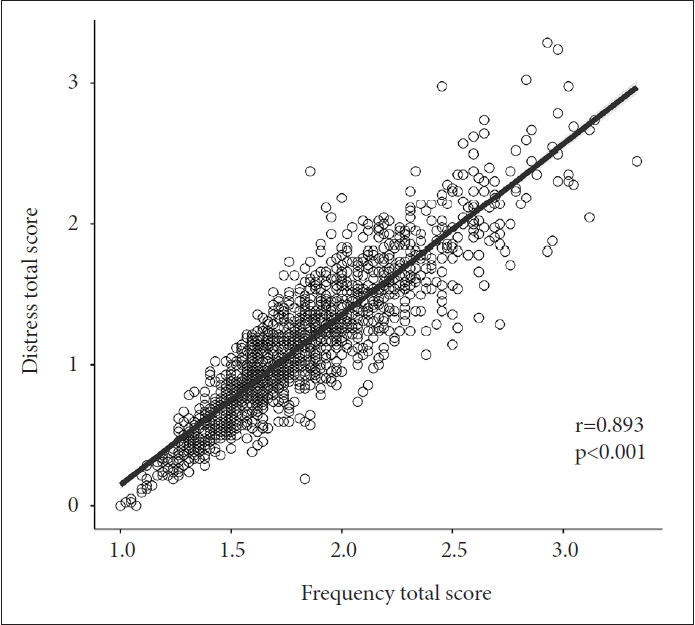
Correlation analysis between frequency and distress was performed for the total score and each dimension. Pearson correlation was significant between total scores of frequency and distress (r=0.893, p<0.001), and was also significant in three hypothesized dimensions (r>0.800 and p<0.001 for all dimensions) (Figure 2).

Confirmatory factor analysis

Table 4 indicates the goodness of fit indices of the original three-dimensional and other hypothesized multidimensional model analyzed from the CFA. According to the CFA results, even though the model fit indices did not reach their respective optimal thresholds, they were within an acceptable range (RMSEA, SRMR, and RMR, but not CFI and TLI). Furthermore, multidimensional models showed relatively better quality compared to the original three-dimensional model, but it did not significantly improve the model fit.

Exploratory factor analysis and follow-up CFA

Since goodness of fit indices of the CFA did not reach the expected value, EFA was conducted to investigate another factor solution that optimally describes the data. Values of the Kaiser-Meyer-Olkin measure of sampling adequacy (MSA=0.936) and Bartlett’s sphericity test (χ2=23,239; p<0.001) were calculated, which suggested our data were factorable. As a result, EFA proposed multiple factor solutions with 8 eigenvalues >1 while the result of the scree plot indicated 3-5 factor solutions (Figure 3).
In a 3-factor solution, “negative-avolition” items were found to be loaded more consistently with depressive items than with the negative dimension (Table 5). The 4-factor solution separated positive symptoms into two factors: “positive-bizarre experiences” and “positive-delusional thoughts,” while, in addition to this, the 5-factor solution separated negative symptoms into two distinct factors: “negative-avolition (expressive)” and “negative-social (experiential).”
The three-factor model accounted for 38.9% of the total variance (depressive symptoms, 19.8%; positive symptoms, 11.8%; negative symptoms, 7.3%). The model fit statistics of the three-factor model showed an appropriate fit except for the CFI and TLI (Table 4). Based on the results of the follow-up CFA, we rejected four- and five- factor models because they did not significantly enhance the model fit.

Convergent and discriminant validity

We analyzed the correlations between three dimensions of K-CAPE (pos, neg, and dep) and their corresponding symptom scales. As presented in Table 6, K-CAPE-pos total scores had stronger positive correlations with total scores of DES-II-DD (r=0.595, p<0.001, df=1,371), O-LIFE-UE (r=0.639, p<0.001, df=1,371), and PS (r=0.643, p<0.001, df=1,371), while it has lower correlations with total scores on O-LIFE-IA (r=0.241, p<0.001, df=1,371) and PHQ-9 (r=0.455, p<0.001, df=1,371). On the other hand, K-CAPE-neg total score was highly correlated with O-LIFE-IA (r=0.566, p<0.001, df=1,371) the most, while the correlation with other scales was relatively lower. Lastly, K-CAPE-dep dimension scores had a higher correlation coefficient with PHQ-9 (r=0.726, p<0.001, df=1,371) than others.

DISCUSSION

This study aimed to evaluate the reliability and validity of the K-CAPE-42 for application as assessment tool in community samples. Our findings established favorable internal consistency and robust convergent (and divergent) validity with their relevant subscales. Factor analysis showed that fit indices of the three-dimensional original model derived from CFA were not optimal and that EFA proposed alternative factor solutions with different item loadings but did not significantly improve the model fit. Thus, our study provided evidence to support that the Korean version applying the original three-dimensional model is suitable.
According to CFA, it is found that the original three-dimensional model of K-CAPE-42 exhibited inconsistent fit indices; CFI and TLI values were below the cutoff (>0.95) while RMSEA, RMR, and SRMR were satisfactory (<0.05). However, this is consistent with previous findings that not all fit indices of the translated versions exceed the acceptable criteria [13,46,47]. Also, it was suggested that CFI is not a valid indicator because it has a negative bias when the correlations between items are generally low [24,42]. RMSEA is an absolute measure of fit that determines how well the hypothesized model fits the perfect fitting model, whereas CFI and TLI are incremental fit indices evaluating the hypothesized model compared to the baseline model in which no items covary [43]. It has been calculated that when RMSEA is less than 0.158, obtained CFI values would be too small [42]. In our analysis, as the RMSEA of the baseline model was 0.135 (less than 0.158), the CFI and TLI (and other incremental fit indices) may not be very informative [44]. Thus, it is reasonable to conclude based on RMSEA and SRMR rather than on CFI and TLI, which suggests the acceptability/adequacy of the original model.
On the other hand, EFA suggested alternative factor solutions in which item loadings differ from the original CAPE42. In factor solutions, several negative items (“avolition”) were consistently loaded with depressive items than negative items. However, this result is consistent with other previous validation studies on the translated version of CAPE-42 in which the depression factor included few negative items [25,46]. It should also be noted that the negative (especially “avolition” symptoms) and depressive domains are conceptually overlapping and have common phenomenological characteristics with negative symptoms [48-51]. Since K-CAPE-42 was conducted through self-report, and detailed information and phenomenology are required to distinguish it, it is reasonable to obtain different item loading results. For example, positive item 7 (“Feeling persecuted”) and item 22 (“People look at you oddly”) were repeatedly included with depressive items rather than positive items. Even though both items were originally designed to cover the “paranoia” domain of positive symptoms, they can also be regarded relating to “low self-esteem.” People with low self-esteem has a lack of confidence and feel worthless about themselves, which is deeply associated with depression and also acts as a risk factor for depression [52,53]. Despite the different item loadings, this seems acceptable when considering overlapping characteristics of psychotic disorder. However, these alternative factor solutions were not selected since the follow-up CFA on these solutions did not significantly improve the model fit. Thus, we concluded that the three-factor model was suitable, as in the originally proposed.
Lastly, the correlation coefficients between the K-CAPE-42 subscales and their corresponding measurements (e.g., CAPE-pos & DES-II vs. CAPE-pos & O-LIFE-IA) were the highest while the subscales were less correlated with scales of other dimensions, confirming convergent and divergent validity. As mentioned above, with respect to the EFA results that “negative-avolition” and “positive-paranoia” items were included in the depressive domain, the correlation between CAPE-neg and PHQ-9 (r=0.623, p<0.001) and between CAPE-pos and PHQ-9 (r=0.455, p<0.001) were relatively higher than those with other irrelevant scales (but lower than those with corresponding scales), which again indicates overlapping features of psychotic symptoms (i.e., depression with “negative” and “positive” subdomains).
Our study is the first validation report of the K-CAPE-42 which includes reliability, factor structure, and convergent-divergent validity. There have been multiple CAPE variants depending on the language of the translation, the validation process, the target population, and what items they included (CAPE-42 or CAPE-P15) [24-26,41,54-56]. Specifically, although there is one study that validated the K-CAPE-15, consisting only of positive items and involving only young adults for analysis [29], the present study can be further generalized as it includes a wider range of participants and all three subdomains. K-CAPE-15 conducted face-to-face clinical interviews to evaluate the diagnostic validity and determined the cutoff values for UHR detection. Yet, we excluded individuals who have been diagnosed with psychotic disorders from the study and did not conduct follow-up investigations; further research is needed to evaluate the usefulness of detecting whether participants developed a psychotic disorder. When choosing a scale, it would be advantageous to consider the pros and cons of these different versions of CAPE, depending on the purpose of the measurement. In addition, due to the self-reporting system and recruitment via online social media, there might be potential biases such as response bias (e.g., socialdesirability bias, over or underreported symptoms) and selection bias, which possibly influence the quality of data. Nevertheless, even with such limitations, K-CAPE-42 can be effectively used as a pre-screening tool for “at-risk” populations.
In conclusion, this study showed that the K-CAPE-42 is a valid and effective screening tool with sufficient psychometric properties to measure PLE in community settings. Although the K-CAPE-42 is not a diagnostic tool for UHR, it aims to pre-screen individuals at potential risk for psychotic disorders, which consequently facilitates early identification and intervention as well as psychosis research.

Supplementary Materials

The online-only Data Supplement is available with this article at https://doi.org/10.30773/pi.2023.0011.
SUPPLEMENTARY MATERIALS
K-CAPE-42 Questionnaire
pi-2023-0011-Supplementary-1.pdf

Notes

Availability of Data and Material

The datasets generated or analyzed during the study are available from the corresponding author on reasonable request.

Conflicts of Interest

Euitae Kim, a contributing editor of the Psychiatry Investigation, was not involved in the editorial evaluation or decision to publish this article. All remaining authors have declared no conflicts of interest.

Author Contributions

Conceptualization: Seoyoung Kim, Michael Bloomfield, Euitae Kim. Data curation: Hyejin Sim, Paul Guyun Jung. Formal analysis: Hyejin Sim. Funding acquisition: Michael Bloomfield, Euitae Kim. Investigation: all authors. Methodology: Hyejin Sim. Project administration: Michael Bloomfield, Euitae Kim. Resources: Seoyoung Kim, Euitae Kim. Software: Hyejin Sim. Supervision: Michael Bloomfield, Euitae Kim. Validation: Hyejin Sim, Paul Guyun Jung. Visualization: Hyejin Sim. Writing—original draft: Hyejin Sim. Writing—review & editing: Hyejin Sim, Seoyoung Kim, Paul Guyun Jung, Euitae Kim.

Funding Statement

The study was supported by the National Research Foundation of Korea (NRF) grants funded by the Korean government (MSIT) (No. NRF2019M3C7A1032472, NRF-2022R1A2B5B02002400).

Figure 1.
Diagram illustrating the validation process. K-CAPE-42, Korean version of Community Assessment of Psychic Experience-42.
pi-2023-0011f1.jpg
Figure 2.
Linear pattern of the correlation between frequency and distress in the entire sample.
pi-2023-0011f2.jpg
Figure 3.
Scree plot of exploratory factor analysis. The scree plot indicated 3-5 factor solutions.
pi-2023-0011f3.jpg
Table 1.
Structures of CAPE-42 consisting of CAPE-pos, CAPE-neg, and CAPE-dep with their respective subdomains based on previous exploratory analyses
Original
Hypothesized multidimension
3-Factor* 5-Factor 7-Factor 9-Factor§
Positive Delusional Ideations Paranoia Paranoia
Grandiosity Grandiosity
Bizarre Experiences Bizarre Experiences Bizarre Experiences
Hallucination Hallucination Hallucination
Negative Negative Negative Social Withdrawal
Affective Flattening
Avolition
Depressive Depressive Depressive Depressive

* original three factor structure as reported by Stefanis et al. [1];

CAPE-pos three-factor structure as reported by Capra et al. [40];

CAPE-pos five factor structure as reported by Wigman et al.41;

§ CAPE-neg three factor structure as reported by Schlier et al. [24]

CAPE-42, Community Assessment of Psychic Experience-42; CAPE-pos, CAPE-positive; CAPE-neg, CAPE-negative; CAPE-dep, CAPE-depressive

Table 2.
Demographic characteristics of K-CAPE-42 scale scores for the total sample, and for the two randomized subsamples separately
Total (N=1,450) Sample 1 (N=725) Sample 2 (N=725)
Age (yr) 26.8±5.6 27.0±5.6 26.7±5.5
K-CAPE-42 sum scores
 Total score 76.7±15.8 76.4±15.4 77.0±16.1
 Positive 30.2±6.5 30.0±6.3 30.4±6.7
 Negative 28.4±7.4 28.3±7.4 28.6±7.4
 Depressive 18.0±4.7 18.0±4.7 18.1±4.8
Sex
 Male 439 (30.3) 217 (29.9) 222 (30.6)
 Female 1,011 (69.7) 508 (70.1) 503 (69.4)
Education
 High school 161 (11.1) 71 (9.8) 90 (12.4)
 University 1,080 (74.5) 545 (75.2) 535 (73.8)
 Graduate 188 (13.0) 94 (13.0) 94 (13.0)
 Etc 21 (1.4) 15 (2.1) 6 (0.8)

Values are presented as mean±standard deviation or number (%).

Before any further analysis, the entire sample was randomly divided into two subsamples. Sample 1 was used for EFA while Sample 2 was used for the follow-up CFA. Among 1,467 participants, 17 were excluded according to the inclusion criterion. K-CAPE-42, Korean version of the Community Assessment of Psychic Experiences; EFA, exploratory factor analysis; CFA, confirmatory factor analysis

Table 3.
Internal reliability of K-CAPE-42 scale scores for the total sample, and for the two randomized subsamples separately
Total (N=1,450) Sample 1 (N=725) Sample 2 (N=725)
Cronbach’s alpha coefficient (number of items)
 Frequency
  Total sore (42) 0.921 0.921 0.921
  Positive score (20) 0.828 0.831 0.825
  Negative score (14) 0.865 0.871 0.859
  Depressive score (8) 0.870 0.870 0.871
 Distress
  Total sore (42) 0.924 0.924 0.924
  Positive score (20) 0.840 0.843 0.837
  Negative score (14) 0.857 0.865 0.848
  Depressive score (8) 0.838 0.834 0.842

Before any further analysis, the entire sample was randomly divided into two subsamples. Sample 1 was used for EFA while Sample 2 was used for the follow-up CFA. Cronbach’s alpha values greater than 0.70 were considered to be acceptable for further anlaysis. KCAPE-42, Korean version of the Community Assessment of Psychic Experiences; EFA, exploratory factor analysis; CFA, confirmatory factor analysis

Table 4.
Fit indices from the confirmatory factor analysis (CFA)
Number of factors Goodness-of-fit index
χ2 df p RMSEA GFI TLI CFI SRMR RMR
3 6,925 816 <0.001 0.074* 0.775 0.695 0.711 0.074* 0.049*
5 6,702 809 <0.001 0.071* 0.792 0.723 0.740 0.071* 0.047*
7 5,175 798 <0.001 0.062* 0.828 0.791 0.807 0.060* 0.038*
9 3,752 783 <0.001 0.051* 0.883* 0.856 0.869 0.054* 0.033*
3-factor solution 3,618 816 <0.001 0.069* 0.789 0.747 0.760 0.077* 0.051*

“3-factor solution” (last row) presents fit indices from follow-up CFA.

* denote indices greater than corresponding acceptable fit criteria.

Meeting minimally acceptable fit criteria: RMSEA ≤0.08, GFI ≥0.85, CFI ≥0.90, TLI ≥0.90, SRMR ≤0.08, RMR ≤0.05. RMSEA, root mean square error of approximation; GFI, goodness of fit Index; TLI, Tucker-Lewis index; CFI, comparative fit index; SRMR, standardized root mean square residual; RMR, root mean square residual

Table 5.
Exploratory factor analysis of the K-CAPE-42 items
Items Subdomain Full sample
1 2 3
1 Feel sad Depressive 0.646
7 Feeling persecuted Pos (Paranoia) 0.415
9 Pessimistic about everything Depressive 0.729
12 No future for you Depressive 0.821
14 Do not want to live anymore Depressive 0.711
18 Lacking in motivation to do things Neg (Avolition) 0.747
19 Cry about nothing Depressive 0.538
21 Lacking in energy Neg (Avolition) 0.620
22 People look at you oddly Pos (Paranoia) 0.441
23 Empty mind Neg (Avolition) 0.543
25 Spending days doing nothing Neg (Avolition) 0.722
29 Lacking in spontaneity Neg (Soc. Withd) 0.667
35 Neglecting your appearance/personal hygiene Neg (Avolition) 0.434
36 Never getting things done Neg (Avolition) 0.690
37 Lack of hobbies/interests Neg (Avolition) 0.516
38 Feel guilty Depressive 0.542
39 Feel like a failure Depressive 0.864
40 Feel tense Depressive 0.429
2 People drop hints/say things with a double meaning Pos (Paranoia) 0.304 0.378
5 Message on TV/magazines especially for you Pos (Biz. Exp) 0.515
6 People are not what they seem to be Pos (Paranoia) 0.330
10 Conspiracy against you Pos (Paranoia) 0.545
11 Feeling destined to be someone important Pos (Grandiosity) -0.563 0.694
13 Being a very special or unusual person Pos (Grandiosity) -0.589 0.650
15 Communicate telepathically Pos (Mag. Think) 0.619
17 Electrical devices can influence the way you think Pos (Biz. Exp) 0.315
20 Believing in witchcraft/voodoo/the occult Pos (Mag. Think) 0.474
24 Thought withdrawal Pos (Biz. Exp) 0.442
26 Thoughts in your head are not your own Pos (Biz. Exp) 0.481
28 Thoughts so vivid that other people may hear them Pos (Biz. Exp) 0.505
30 Thoughts echoed Pos (Biz. Exp) 0.535
31 Feeling under the control of some force or power Pos (Biz. Exp) 0.549
33 Hearing voices Pos (Hallucination) 0.587
34 Hearing voices talk to each other Pos (Hallucination) 0.476
41 Capgras Pos (Hallucination) 0.323
42 Seeing things other people cannot see Pos (Hallucination) 0.411
3 Not very animated person Neg (Soc. Withd) 0.758
4 Not much of a talker Neg (Soc. Withd) 0.464
8 Experiencing no/few emotions Neg (Aff. Flat) 0.659
16 No interest to be with other people Neg (Soc. Withd) 0.478
27 Emotions lack intensity Neg (Aff. Flat) 0.813
32 Blunted emotions Neg (Aff. Flat) 0.862
Factor 1 Factor 2 Factor 3
SS loadings 8.296 4.968 3.068
Proportion Var 0.198 0.118 0.073
Cumulative Var 0.198 0.316 0.389

Only items with factor loadings ≥0.30 are shown. K-CAPE-42, Korean version of Community Assessment of Psychic Experience; Depressive, depressive symptoms; Pos, positive symptoms; Neg, negative symptoms; Soc. Withd, social withdrawal; Biz. Exp, bizarre experience; Mag. Think, magical thinking; Aff. Flat, affective flattening; SS loadings, the sum of squared loadings; Var, variance

Table 6.
Spearman’s coefficients of correlation among the K-CAPE-42, paranoia scale, DES, O-LIFE, and PHQ-9
Positive
Negative
Depressive
Paranoia Scale DES-II-DD O-LIFE-UE O-LIFE-IA PHQ-9
K-CAPE-Pos 0.643* 0.595* 0.639* 0.241 0.455
K-CAPE-Neg 0.582 0.404 0.407 0.566* 0.623
K-CAPE-Dep 0.633 0.409 0.438 0.434 0.726*

* denote the greatest value among correlation coefficient with other scales.

K-CAPE-42, 42-item Korean version of Community Assessment of Psychic Experiences; Pos, positive domain; Neg, negative domain; Dep, depression domain; DES, Dissociative Experiences Scale; DD, depersonalization/derealization; O-LIFE, Oxford-Liverpool Inventory of Feelings and Experiences; UE, unusual experience; IA, introvertive anhedonia; PHQ-9, 9-item Patient Health Questionnaire

REFERENCES

1. Stefanis NC, Hanssen M, Smirnis NK, Avramopoulos DA, Evdokimidis IK, Stefanis CN, et al. Evidence that three dimensions of psychosis have a distribution in the general population. Psychol Med 2002;32:347-358.
crossref pmid
2. Rössler W, Riecher-Rössler A, Angst J, Murray R, Gamma A, Eich D, et al. Psychotic experiences in the general population: a twenty-year prospective community study. Schizophr Res 2007;92:1-14.
crossref pmid
3. Yung AR, Buckby JA, Cotton SM, Cosgrave EM, Killackey EJ, Stanford C, et al. Psychotic-like experiences in nonpsychotic help-seekers: associations with distress, depression, and disability. Schizophr Bull 2006;32:352-359.
crossref pmid pmc
4. Linscott RJ, van Os J. An updated and conservative systematic review and meta-analysis of epidemiological evidence on psychotic experiences in children and adults: on the pathway from proneness to persistence to dimensional expression across mental disorders. Psychol Med 2013;43:1133-1149.
crossref pmid
5. Bourgin J, Tebeka S, Mallet J, Mazer N, Dubertret C, Le Strat Y. Prevalence and correlates of psychotic-like experiences in the general population. Schizophr Res 2020;215:371-377.
crossref pmid
6. Yung AR, Nelson B, Baker K, Buckby JA, Baksheev G, Cosgrave EM. Psychotic-like experiences in a community sample of adolescents: implications for the continuum model of psychosis and prediction of schizophrenia. Aust N Z J Psychiatry 2009;43:118-128.
crossref pmid pdf
7. McGrath JJ, Saha S, Al-Hamzawi A, Alonso J, Bromet EJ, Bruffaerts R, et al. Psychotic experiences in the general population: a cross-national analysis based on 31 261 respondents from 18 countries. JAMA Psychiatry 2015;72:697-705.
crossref pmid pmc
8. van Os J, Linscott RJ, Myin-Germeys I, Delespaul P, Krabbendam L. A systematic review and meta-analysis of the psychosis continuum: evidence for a psychosis proneness-persistence-impairment model of psychotic disorder. Psychol Med 2009;39:179-195.
crossref pmid
9. Yung AR, Phillips LJ, Yuen HP, McGorry PD. Risk factors for psychosis in an ultra high-risk group: psychopathology and clinical features. Schizophr Res 2004;67:131-142.
crossref pmid
10. DeRosse P, Karlsgodt KH. Examining the psychosis continuum. Curr Behav Neurosci Rep 2015;2:80-89.
crossref pmid pmc pdf
11. Kaymaz N, Drukker M, Lieb R, Wittchen HU, Werbeloff N, Weiser M, et al. Do subthreshold psychotic experiences predict clinical outcomes in unselected non-help-seeking population-based samples? A systematic review and meta-analysis, enriched with new results. Psychol Med 2012;42:2239-2253.
crossref pmid
12. van Os J, Linscott RJ. Introduction: the extended psychosis phenotype--relationship with schizophrenia and with ultrahigh risk status for psychosis. Schizophr Bull 2012;38:227-230.
crossref pmid pmc
13. Mark W, Toulopoulou T. Psychometric properties of “Community Assessment of Psychic Experiences”: review and meta-analyses. Schizophr Bull 2016;42:34-44.
crossref pmid pmc
14. Yung AR, McGorry PD. The prodromal phase of first-episode psychosis: past and current conceptualizations. Schizophr Bull 1996;22:353-370.
crossref pmid
15. Yung AR, McGorry PD, McFarlane CA, Jackson HJ, Patton GC, Rakkar A. Monitoring and care of young people at incipient risk of psychosis. Schizophr Bull 1996;22:283-303.
crossref pmid
16. American Psychiatric Association. Diagnostic and statistical manual of mental disorders (5th ed). Arlington, VA: American Psychiatric Association; 2013.

17. Joa I, Gisselgård J, Brønnick K, McGlashan T, Johannessen JO. Primary prevention of psychosis through interventions in the symptomatic prodromal phase, a pragmatic Norwegian Ultra High Risk study. BMC Psychiatry 2015;15:89
crossref pmid pmc pdf
18. Power P, Elkins K, Adlard S, Curry C, McGorry P, Harrigan S. Analysis of the initial treatment phase in first-episode psychosis. Br J Psychiatry Suppl 1998;172:71-76.
crossref pmid
19. Bashir Z, Griffiths SL, Upthegrove R. Recognition and management of depression in early psychosis. BJPsych Bull 2022;46:83-89.
crossref pmid pmc
20. Yung AR, Yuen HP, McGorry PD, Phillips LJ, Kelly D, Dell’Olio M, et al. Mapping the onset of psychosis: the comprehensive assessment of at-risk mental states. Aust N Z J Psychiatry 2005;39:964-971.
crossref pmid pdf
21. Palmier-Claus JE, Ainsworth J, Machin M, Barrowclough C, Dunn G, Barkus E, et al. The feasibility and validity of ambulatory self-report of psychotic symptoms using a smartphone software application. BMC Psychiatry 2012;12:172
crossref pmid pmc pdf
22. Pignon B, Peyre H, Szöke A, Geoffroy PA, Rolland B, Jardri R, et al. A latent class analysis of psychotic symptoms in the general population. Aust N Z J Psychiatry 2018;52:573-584.
crossref pmid pdf
23. Varghese D, Scott J, McGrath J. Correlates of delusion-like experiences in a non-psychotic community sample. Aust N Z J Psychiatry 2008;42:505-508.
crossref pmid pdf
24. Schlier B, Jaya ES, Moritz S, Lincoln TM. The Community Assessment of Psychic Experiences measures nine clusters of psychosis-like experiences: a validation of the German version of the CAPE. Schizophr Res 2015;169:274-279.
crossref pmid
25. Mark W, Toulopoulou T. Validation of the Chinese version of Community Assessment of Psychic Experiences (CAPE) in an adolescent general population. Asian J Psychiatr 2017;26:58-65.
crossref pmid
26. Fonseca-Pedrero E, Paino M, Lemos-Giráldez S, Muñiz J. Validation of the community assessment psychic experiences -42 (CAPE-42) in Spanish college students and patients with psychosis. Actas Esp Psiquiatr 2012;40:169-176.
pmid
27. Konings M, Bak M, Hanssen M, van Os J, Krabbendam L. Validity and reliability of the CAPE: a self-report instrument for the measurement of psychotic experiences in the general population. Acta Psychiatr Scand 2006;114:55-61.
crossref pmid
28. Stip E, Letourneau G. Psychotic symptoms as a continuum between normality and pathology. Can J Psychiatry 2009;54:140-151.
crossref pmid pdf
29. Kim SW, Kim JK, Han JH, Jhon M, Kim JW, Lee JY, et al. Validation of the Korean version of the 15-item Community Assessment of Psychic Experiences in a college population. Psychiatry Investig 2020;17:306-311.
crossref pmid pmc pdf
30. Yung AR, McGorry PD. The initial prodrome in psychosis: descriptive and qualitative aspects. Aust N Z J Psychiatry 1996;30:587-599.
crossref pmid pdf
31. Gourzis P, Katrivanou A, Beratis S. Symptomatology of the initial prodromal phase in schizophrenia. Schizophr Bull 2002;28:415-429.
crossref pmid
32. Shioiri T, Shinada K, Kuwabara H, Someya T. Early prodromal symptoms and diagnoses before first psychotic episode in 219 inpatients with schizophrenia. Psychiatry Clin Neurosci 2007;61:348-354.
crossref pmid
33. Carlson EB, Putnam FW. An update on the dissociative experiences scale. Dissociation: Prog Dissociative Disord 1993;6:16-27.

34. Oh HY, Kim D, Kim Y. Reliability and validity of the Dissociative Experiences Scale among South Korean patients with schizophrenia. J Trauma Dissociation 2015;16:577-591.
crossref pmid
35. Fenigstein A, Vanable PA. Paranoia and self-consciousness. J Pers Soc Psychol 1992;62:129-138.
crossref pmid
36. Lee HJ, Won HT. A study of the reliability and the validity of the paranoia scale. Korean J Clin Psychol 1995;14:83-94.

37. Kroenke K, Spitzer RL, Williams JB. The PHQ-9: validity of a brief depression severity measure. J Gen Intern Med 2001;16:606-613.
crossref pmid pmc
38. Park SJ, Choi HR, Choi JH, Kim KW, Hong JP. Reliability and validity of the Korean version of the Patient Health Questionnaire-9 (PHQ-9). Anxiety Mood 2010;6:119-124.

39. Rosseel Y. lavaan: an R package for structural equation modeling. J Stat Softw 2012;48:1-36.

40. Capra C, Kavanagh DJ, Hides L, Scott J. Brief screening for psychosislike experiences. Schizophr Res 2013;149:104-107.
crossref pmid
41. Wigman JT, Vollebergh WA, Jacobs N, Wichers M, Derom C, Thiery E, et al. Replication of the five-dimensional structure of positive psychotic experiences in young adulthood. Psychiatry Res 2012;197:353-355.
crossref pmid
42. Kenny DA. Measuring model fit [Internet]. Available at: http://davidakenny.net/cm/fit.htm. Accessed December 19, 2022.

43. Xia Y, Yang Y. RMSEA, CFI, and TLI in structural equation modeling with ordered categorical data: the story they tell depends on the estimation methods. Behav Res Methods 2019;51:409-428.
crossref pmid pdf
44. Kenny DA, Kaniskan B, McCoach DB. The performance of RMSEA in models with small degrees of freedom. Sociol Methods Res 2015;44:486-507.
crossref pdf
45. George D, Mallery P. IBM SPSS statistics 26 step by step: a simple guide and reference (16th ed). New York: Routledge; 2019.

46. Brenner K, Schmitz N, Pawliuk N, Fathalli F, Joober R, Ciampi A, et al. Validation of the English and French versions of the Community Assessment of Psychic Experiences (CAPE) with a Montreal community sample. Schizophr Res 2007;95:86-95.
crossref pmid
47. Vleeschouwer M, Schubart CD, Henquet C, Myin-Germeys I, van Gastel WA, Hillegers MH, et al. Does assessment type matter? A measurement invariance analysis of online and paper and pencil assessment of the Community Assessment of Psychic Experiences (CAPE). PLoS One 2014;9:e84011
crossref pmid pmc
48. Krynicki CR, Upthegrove R, Deakin JFW, Barnes TRE. The relationship between negative symptoms and depression in schizophrenia: a systematic review. Acta Psychiatr Scand 2018;137:380-390.
crossref pmid pdf
49. Murali T, Ravi Kumar S. Symptoms of depression in schizophrenia. Indian J Med Res 2008;127:516-518.
pmid
50. Sax KW, Strakowski SM, Keck PE Jr, Upadhyaya VH, West SA, McElroy SL. Relationships among negative, positive, and depressive symptoms in schizophrenia and psychotic depression. Br J Psychiatry 1996;168:68-71.
crossref pmid
51. Richter J, Hölz L, Hesse K, Wildgruber D, Klingberg S. Measurement of negative and depressive symptoms: discriminatory relevance of affect and expression. Eur Psychiatry 2019;55:23-28.
crossref pmid
52. Orth U, Robins RW, Trzesniewski KH, Maes J, Schmitt M. Low self-esteem is a risk factor for depressive symptoms from young adulthood to old age. J Abnorm Psychol 2009;118:472-478.
crossref pmid
53. Orth U, Robins RW. Understanding the link between low self-esteem and depression. Curr Dir Psychol Sci 2013;22:455-460.
crossref pdf
54. Jaya ES. Confirmatory factor analysis of the Indonesian version of Community Assessment of Psychic Experiences. Makara Hum Behav Stud Asia 2017;21:1-12.
crossref
55. Vermeiden M, Janssens M, Thewissen V, Akinsola E, Peeters S, Reijnders J, et al. Cultural differences in positive psychotic experiences assessed with the Community Assessment of Psychic Experiences-42 (CAPE42): a comparison of student populations in the Netherlands, Nigeria and Norway. BMC Psychiatry 2019;19:244
crossref pmid pmc pdf
56. Ragazzi TCC, Shuhama R, Sinval J, Marôco J, Corsi-Zuelli F, Roza DLD, et al. Validation of the Portuguese version of the Community Assessment of Psychic Experiences and characterization of psychotic experiences in a Brazilian sample. Braz J Psychiatry 2020;42:389-397.
crossref pmid pmc


ABOUT
AUTHOR INFORMATION
ARTICLE CATEGORY

Browse all articles >

BROWSE ARTICLES
Editorial Office
#522, 27, Seochojungang-ro 24-gil, Seocho-gu, Seoul 06601, Korea
Tel: +82-2-717-0892    E-mail: psychiatryinvest@gmail.com                

Copyright © 2024 by Korean Neuropsychiatric Association.

Developed in M2PI

Close layer
prev next