INTRODUCTION
Alzheimer’s disease (AD) is known to have a pathophysiological process that begins decades prior to symptom onset [1]. Synaptic dysfunction evidenced by resting state functional magnetic resonance imaging (fMRI) is known to reflect one of the earliest pathological changes due to AD pathology [2]. Amyloid cascade model suggests that synaptic dysfunction evidenced by aberration of functional connectivity (FC) is one of the earliest downstream pathologies after cerebral beta-amyloid (Aβ) deposition. Thereafter, tau-mediated neuronal injury, neurodegeneration, and cognitive decline are known to follow and the synaptic dysfunction [3].
Apolipoprotein E (APOE) gene is a major genetic risk modifier for AD, and it is known to influence FC pattern in AD continuum [4]. Cognitive normal older adults (CN) who have ε4 alleles of the APOE gene are known to show aberration of the FC even before cerebral Aβ deposition is detectable in cerebrospinal fluid (CSF) studies or in amyloid positron emission tomography (PET) scans [5]. Conversely, CN with ε2 alleles are known to maintain synaptic function integrity even after the cascade of AD pathologies has begun [6].
Resting state fMRI studies have shown that the brain regions particularly vulnerable to FC change from the AD pathologies are the default mode network (DMN) [7]. A study showed that Pittsburgh Compound B (PiB)-PET negative CN carrying an ε4 had decreased FC in anterior cingulate, middle temporal lobe, and parahippocampal area than those not carrying an ε4 [5]. Others showed that the ε2 and ε4 carriers showed decreased FC of anterior cingulate cortex compared with ε3 homozygotes [8].
Despite these findings, no previous study has investigated FC difference among ε2 carriers, ε3 homozygotes, and ε4 carriers in CN without cerebral Aβ. The first study included PiB negative CN only, but it only compared those with and without ε4 [5]. Moreover, the number of subjects with ε2 were combined as part of ε4 group if the genotype was 2/4 and as non-ε4 group if the genotype was 2/3 or 2/2. Thus, the study was neither able to correctly investigate the FC change due to ε4 nor study FC difference among ε2, ε3, and ε4. The average age of ε4 group (58.8 years) was statistically younger than the non-ε4 group (63.3 years), so age became another confounding factor. Although the second study included subjects with ε2, ε3, and ε4, the study did not investigate subjects’ cerebral Aβ status [8]. Consequently, the study might have included subjects with or without cerebral Aβ plaque, failing to elucidate whether the FC changes were due to APOE per se or to varying levels of cerebral Aβ deposition. Lastly, none of the studies investigated whether the FC differed according to APOE genotypes in the absence of neurodegeneration, structural connectivity aberrance, and cerebral Aβ deposition.
To fill in this gap, we aimed to investigate the resting state FC differences among amyloid-PET negative CN with ε2/ε2 or ε2/3, ε3/ε3, and ε3/ε4 or ε4/4. We also explored whether structural connectivity, evidenced by the white matter (WM) integrity, and neurodegenerative, change evidenced by cortical thickness, differed according to APOE allotypes.
METHODS
Subjects
A total of 188 CN individuals with negative amyloid-PET results were recruited from volunteers in the Catholic Aging Brain Imaging database. This database contains brain scans of patients who visited the outpatient clinic at the Catholic Brain Health Center, Yeouido St. Mary’s Hospital, The Catholic University of Korea, between 2017 and 2022. Among them, 37 individuals had either ε2/ε2 or ε2/ε3 (ε2 group), 113 had ε3/ε3 (ε3 group), and 38 had ε3/ε4 or ε4/ε4 allotypes (ε4 group). All participants were aged ≥60 years and had normal cognitive function, as confirmed by the Korean version of the Consortium to Establish a Registry for Alzheimer’s Disease (CERAD-K), which includes the Verbal Fluency, 15-item Boston Naming Test, Korean version of the Mini-Mental Status Examination, Word List Memory, Word List Recall, Word List Recognition, Constructional Praxis, and Constructional Recall [9]. Additionally, normal cognitive status was independently diagnosed by two psychiatric specialists (S.M.W and H.K.L). Subjects with ε2/ε4 were excluded since ε2 and ε4 are known to have opposite effects against AD pathology. Furthermore, subjects with any current or past diagnosis of mild cognitive impairment or dementia established by the National Institute on Aging and Alzheimer’s Association criteria were excluded. The study was conducted in accordance with ethical and safety guidelines set forth by the Institutional Review Board of Yeouido St. Mary’s Hospital, College of Medicine, The Catholic University of Korea (IRB number: SC22RIDI0153). The informed consent was waived by the IRB because we only used retrospective data.
MRI acquisition
All patients underwent brain MRI, including structural MRI, resting-state fMRI, and diffusion-weighted imaging (DWI), using a 3T Siemens MAGETOM Skyra machine and 32-channel Siemens head coils (Siemens Medical Solutions, Erlangen, Germany). The following parameters were used for structural MRI: T1-weighted three-dimensional magnetization-prepared rapid gradient-echo sequence with time to echo (TE)=2.6 ms, repetition time (TR)=1,940 ms, inversion time=979 ms, field-of-view (FOV)=230 mm, matrix=256×256, and voxel size=1.0×1.0×1.0 mm3. The resting-state fMRI was collected using a T2-weighted gradient-echo sequence with TR=2,000 ms, TE=30 ms, matrix=128×128×29, and voxel size=1×1×2 mm3; a total of 150 volumes were acquired over 5 minutes while patients were instructed to keep their eyes closed and think of nothing in particular. Lastly, the following parameters were used for DWI acquisition: matrix=112×112, TR/TE=3,100/86 ms, b-value=0 and 1,000, FOV=224×224 mm, slice thickness=2 mm, and acquisition time. Whole-brain diffusion tensor imaging (DTI) acquisition was performed with a multislice single-shot spin echo planar pulse sequence using 96 diffusion-encoding directions.
Amyloid-PET acquisition
All subjects underwent amyloid-PET using 18F-flutemetamol (18F-FMM). Details regarding the production, data collection, and analytical results of 18F-FMM have been previously described [10]. In brief, T1 MRI images of each participant were used for co-registration, defining regions of interest (ROIs), and correcting for partial volume effects associated with the expansion of the cerebrospinal spaces due to cerebral atrophy. We used the standardized uptake value ratio (SUVR) 90 minutes post-injection to analyze 18F-FMM PET data [11]. SUVRs of the six cortical ROIs (frontal, superior parietal, lateral temporal, striatum, anterior cingulate cortex, and posterior cingulate cortex/precuneus) were averaged to define global cerebral Aβ burden. Consistent with cutoff values used in previous 18F-FMM PET studies, we initially used neocortical SUVR of 0.62 as the cutoff for amyloid-PET negativity [10]. However, two nuclear medicine radiologists separately confirmed amyloid negativity based on visual readings.
Data analysis
fMRI data preprocessing and seed-to-voxel analysis
The CONN toolbox in Statistical Parametric Mapping 12 was used to preprocess fMRI data [12]. The default CONN preprocessing pipeline was used, which included realignment, unwarping, slice-timing correction, co-registering echo planar imaging to T1 structural images, normalization, functional outlier detection and scrubbing, functional spatial smoothing with an 8-mm Gaussian kernel, and anatomical component-based noise correction or denoising [13]. The waveform of each brain voxel was filtered using a bandpass filter (0.009<f<0.08 Hz) to reduce the effects of low-frequency drift when removing WM, CSF noise components, unwanted subject motion, and physiological noises.
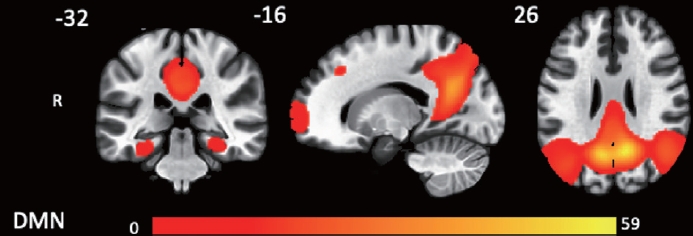
After preprocessing, we carried out seed-to-voxel analysis. The CONN toolbox contains a total of 164 ROIs that can be used as seeds. We selected the posterior cingulate cortex (coordinates 1, -61, 38), one of the major hubs of the DMN, as our seed [14]. We first conducted first-level analyses involving the computation of seed-to-voxel connectivity maps for each subject. Thereafter, we used between-group difference controlling for sex and age to assess whether there were statistically significant differences in DMN among the ε2, ε3, and ε4 groups. All the comparisons throughout the whole brain adopted voxel-wise statistics thresholded at p<0.05, false discovery rate (FDR) corrected, to resolve the problem of multiple comparisons.
DTI analysis using tract-based spatial statistics
We used the standard procedure of voxelwise cross-subject analysis with tract-based spatial statistics (TBSS) to perform DTI analysis. The FMRIB Software Library (FSL; Analysis Group, FMRIB, Oxford, UK) was used to conduct TBSS analysis with the following preprocessing steps: registration and reorientation, EDDY current correction with motion correction, and brain extractions using FSL brain extraction tool (bet) [15]. Thereafter, we conducted DTIFit to calculate diffusion parameters using the bvecs files.
Regarding DTI measures, we investigated fractional anisotropy (FA) and mean diffusivity (MD), which reflect the degree of water molecule diffusion and the average rate of diffusion in all directions, respectively [16]. As described by Yang et al. [17], nonlinear registration algorithm FNIRT was utilized to normalize FA images to an FA template from the Montreal Neurological Institute (MNI) space. Thenceforth, we used spatially normalized images of all subjects to obtain mean FA images, and they were ‘‘skeletonized’’ to allow comparison across spatially matched tract structures across all subjects. FA data for each subject was projected onto the mean sample-based FA skeleton. Same procedures were repeated to calculate MD values. In order to resolve the problem of multiple comparisons, FDR correction at p<0.05 was utilized for the multivoxel statistics.
Morphometric analysis
FreeSurfer software (version 6.0.0) was used to perform cortical reconstruction and volumetric segmentation of the entire brain [18]. The software is available online at https://surfer.nmr.mgh.harvard.edu. The details of the procedures are described in the previous research [19], which include removal of non-brain tissue using a hybrid watershed algorithm, bias field correction, automated Talairach transformation, and segmentation of subcortical WM and deep gray matter (GM) structures. Intensity normalization and inflation of the cortical surface were then conducted to locate both the pial surface and the GM/WM boundary. This process enabled us to calculate cortical thickness by measuring the shortest distance between the two surfaces at each point across the cortical mantle [20]. For analyses of the entire cortex, we smoothed the cortical map of each subject using a Gaussian kernel with a full width at half-maximum of 10 mm. We also parcellated the cerebral cortex based on gyral and sulcal information implemented in FreeSurfer. Finally, we used the FDR correction at p<0.05 to correct for multiple comparisons.
Statistical analysis
We used the free and open-source data analysis tool jamovi (version 2.3.18.0) for statistical analysis [21]. Analysis of variance was used to assess potential differences among the ε2, ε3, and ε4 groups for continuous variables, and the chi-square test was used for categorical variables. When a significant group difference was found, Bonferroni tests were utilized for post-hoc analysis. We chose a two-tailed alpha level of 0.05 to indicate statistical significance for all tests.
RESULTS
Baseline demographic and clinical data
Table 1 presents the baseline demographic data for the total sample and for the ε2, ε3, and ε4 groups. All variables were normally distributed, and there were no significant differences in age, sex, education, cerebral Aβ deposition severity measured using SUVR, or neuropsychological profiles based on the CERAD-K (Table 1).
Group difference in intrinsic FC, WM integrity, and cortical thickness
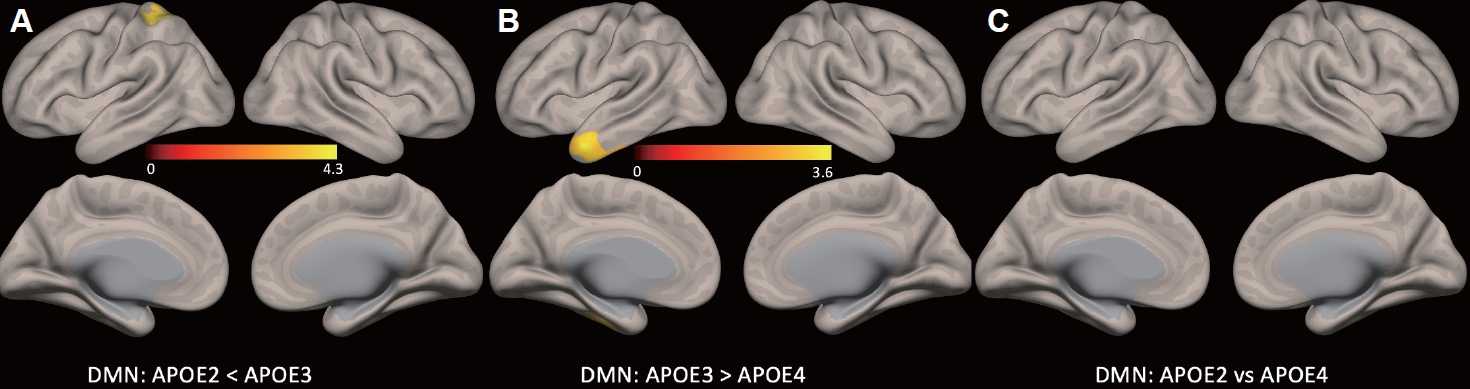
There were no group differences in cortical thickness analyzed using FreeSurfer or in structural connectivity analyzed using TBSS. Figure 1 shows a statistical map representing the DMN based on seed-to-voxel analysis, with posterior cingulate cortex as the seed, determined across all subjects. The group seed-to-voxel analysis showed significantly higher FC of the left superior parietal lobe in the ε3 group than in the ε2 group (p<0.05, FDR corrected). The ε3 group also showed higher FC in the left temporal pole than the ε4 group (p<0.05, FDR corrected). Lastly, there was no difference in FC between the ε2 and ε4 groups (Figure 2 and Table 2).
DISCUSSION
To the best of our knowledge, this is the first study investigating differences in neurodegeneration, structural connectivity, and resting state FC, among amyloid-PET negative CN with ε2, ε3, and ε4.
Earlier research suggested that CN with ε4 have lower cortical thickness, while CN with ε2 carriers have higher cortical thickness than CN with ε3 homozygotes [22]. However, more recent studies have shown that APOE-associated neurodegeneration in the trajectory of AD starts after Aβ pathology initiates [1]. We demonstrated that cortical thickness and structural connectivity did not differ among ε2, ε3, and ε4 groups in the absence of cerebral Aβ deposition. Thus, our results confirmed the amyloid cascade hypothesis, which suggests that Aβ is an upstream pathology of the detrimental downstream cascade of neurodegeneration and cognitive dysfunction [23].
Consistent with previous studies [7], we showed that the ε4 group had lower FC in the left temporal pole than the ε3 group. As stated earlier, cortical thickness and structural connectivity did not differ among groups. Thus, we advanced previous research and confirmed the amyloid cascade hypothesis by showing that the aberration of DMN FC associated with ε4 occurred not only before the onset of clinical symptoms and cerebral Aβ deposition but also preceded neurodegeneration and structural connectivity alterations [23]. The lateral temporal pole is an important part of the dorsal DMN system, which is mainly involved in memory [24]. Thus, the FC decrement of the left temporal pole might be associated with the subtle cognitive decline that CN with ε4 allotypes experience [25].
A previous study showed that FC of DMN were lower in CN with ε2 than in CN with ε3, but the study did not analyze participants’ cerebral Aβ status [26]. Similar to the ε4-associated FC aberrations, we showed novel findings of lower DMN FC in ε2 carriers than in ε3 homozygotes in the absence of cerebral Aβ deposition, neurodegeneration, structural connectivity change, and cognitive decline. ε2 is associated with slower spreading of Aβ and a more efficient compensatory mechanism against AD pathology than ε3 or ε4 [27]. Studies suggested that this protective effect of the ε2 alleles might be related to decreased neural activity [28,29]. Others showed that ε2 carriers have lower long-term potentiation activity, which results in lower Aβ secretion and excitotoxicity and thus promotes neuroprotection [30]. However, despite the known opposite effects of ε2 and ε4 against AD pathology, our study found that both ε2 and ε4 carriers had lowered DMN FC when compared to the ε3 homozygotes. Likewise, it is not clear why the FC of DMN did not differ between ε2 and ε4 carriers. The decrement of FC observed in ε2 carriers could be associated with higher brain reserve needing less synaptic compensation, whereas the decrement in ε4 carriers could be linked with less synaptic efficiency linked with early Aβ pathology [2,31,32]. Nevertheless, whether decreased FC is associated with aberration or neuroprotection is still under debate. Thus, longitudinal studies are needed to confirm our speculations.
Our study has additional strengths. By excluding subjects having ε2/ε4, we were able to investigate AD pathological changes associated with ε2, ε3, and ε4 more clearly. In addition, we included subjects only with age ≥60 years, having normal cognitive function confirmed using the CERAD-K, and confirmed to have no Aβ pathology using amyloid-PET. The careful selection criteria enabled us to include older adults (average age higher than 70 years) having normal cognition with balanced baseline demographic data and to prevent diverse confounding factors.
Despite the above findings, there are still some additional issues that need to be addressed before the resting-state FC, or the aberrance of DMN FC, can be implemented as a biomarker for AD [1]. One of the most important obstacles is the fact that, although DMN FC changes have been repeatedly shown in group level, the ability to meaningfully use fMRI data on a single-subject level has been very limited [33]. Developing novel fMRI data acquisition methods, such as using functional brain atlas rather than structural brain atlas, are needed to improve the signal-to-noise ratio of the data, which may increase the power of statistical analyses. In addition, like SUVR scores of amyloid-PET, objective cutoff scores of FC measures should be developed to enhance its utility in the single-subject level. The inconsistency of FC measures across multiple scanner types, or so-called inter-scanner variability, is another important factor limiting its generalizability in clinical settings [34]. Lastly, pre-processing and analysis of fMRI data requires several hours, so a faster automated analysis pipeline is needed for fMRI results be transformed from bench to bedside.
Our study has several limitations that must be acknowledged. Firstly, it was a cross-sectional study, which limits our ability to interpret causal relationships. Additionally, all subjects were from a single center, which limits the generalizability of our results. Moreover, we were unable to investigate tau pathologies using either tau-PET or CSF studies, which means that the FC difference we observed could have been influenced by tau pathologies as well as APOE allotypes. Thus, longitudinal studies are needed to confirm whether the FC change associated with APOE truly preceded Aβ deposition, tau pathology, and neurodegeneration.
In conclusion, our results support the contemporary amyloid cascade model, showing that CN older adults with ε2 carriers, ε3 homozygotes, and ε4 carriers do not exhibit differences in structural connectivity and cortical thickness in the absence of cerebral Aβ deposition. Our study also revealed novel findings of DMN FC decrement for ε4 and ε2 carriers, compared with ε3 homozygotes. Therefore, we advanced previous research by demonstrating that both ε4 and ε2 exhibit APOE-associated DMN FC changes before Aβ deposition, structural changes, and neurodegeneration.