INTRODUCTION
Adolescents’ excessive use of digital media content such as video games has been consistently noted as a serious risk factor for disrupting their learning, development, and mental health [1,2]. According to Paulus et al.’s systematic review [1], the prevalence rate of Internet gaming disorder (IGD) among adolescents ranges from 0.6% to 50.0%.
IGD shows a positive correlation between Internet and game usage time, highly comorbid with major mental disorders such as depression, attention-deficit/hyperactivity disorder (ADHD), and social anxiety in adolescents [1,3]. And researchers have reported that comorbidity with other mental disorders can worsen symptoms [4,5]. Based on these studies, in 2019, IGD was listed as an official mental disorder in the WHO’s International Classification of Diseases (11th edition) [6].
Mental health literacy
Mental health literacy (MHL) refers to “knowledge and beliefs about mental disorders that assist in their recognition, management, or prevention.” [7] Recently, the concept of MHL has evolved to include knowledge on how to prevent or treat mental disorders, seek help, and respond to emergencies [8]. According to Tay et al. [9], high MHL among the public can lead to early recognition of mental illness in oneself and others as well as appropriate help-seeking, which can greatly aid treatment and prevention efforts. Low MHL results in low awareness of the need for treatment, which is consistently identified as the biggest obstacle to treatment and recovery. Therefore, improving MHL has been highlighted as a crucial factor in preventing and treating mental disorders [10,11]. Furthermore, seeking informal help, including through family or friends, can result in delayed treatment and recovery [9]. This means that the level of understanding and trust in professional resources influences the selection of resources and health behaviors. Therefore, individual perceptions of help-seeking resources are also a crucial component of MHL [8,10].
Jorm [8] suggests that MHL can be measured as a broad perception of mental disorders or specific perception of a particular disorder, depending on the study’s purpose. In the latter case, MHL can be measured by evaluating the accuracy of participants’ recognition of specific mental disorders, as well as by examining their attitudes and beliefs regarding these disorders and their preference for resources when seeking help for such conditions. This approach offers a valuable means of identifying potential barriers to treatment and prevention for individual disorders [8.10].
Adolescent MHL and IGD
Since adolescents can experience various mental health crises during development and growth [12], MHL is emphasized as a crucial mental health protection factor [11]. MHL in adolescents has been measured and studied in various countries, but studies have mainly examined depression [13], social anxiety [14,15], ADHD, or addiction,16 focusing on disease recognition, attitudes, or help seeking behaviors [17].
Previous findings on gender differences in adolescents’ MHL are inconsistent [15,16], and adolescents’ self-perceptions of their emotional and mental difficulties [16] as well as their current mental health problems [13] may affect MHL differently. Furthermore, even if they recognize the need for help, they may prefer inappropriate help resources (i.e., family or friends instead of mental health experts) [14,15]. These characteristics suggest that adolescents are vulnerable to MHL, and heterogeneous across MHL factors. However, prior research has primarily used variable-centered analyses and paid little attention to heterogeneity in adolescents’ MHL.
Research on MHL for IGD—an emerging mental disorder among adolescents—has been very limited. To date, only two relevant studies have been identified: Jeon et al. [18] and Lam [19]. Jeon et al. [18] measured MHL on IGD and problematic smartphone use (PSU) and categorized low and high-risk groups for IGD and PSU. Lam [19] compared MHL on Internet addiction (IA) with MHL on depression in adolescents. Both studies aimed to develop MHL measurement tools based on IGD, PSU, or a more comprehensive concept: IA. Distinguishing each addiction is difficult due to the mixing of media, devices, and content, and whether PSU and IA should be considered disorders remains controversial [3]. Therefore, using vignettes that are easy for adolescents to understand based on examples of disorders with an official IGD diagnosis may be more effective in measuring MHL in actual research applications.
In summary, studies of IGD MHL and its heterogeneity have been insufficient to date. Therefore, this study aims to identify these subtypes, their characteristics, and predictors of MHL for IGD to provide evidence for preventing IGD and improving adolescent MHL. The research questions are as follows:
1) What are the latent profiles of MHL for IGD in adolescents?
2) What are the characteristics of each latent type?
3) What factors can predict each latent profile type?
METHODS
Participants
This study analyzed data from the 2019 Youth Smart Digital Media Survey [20], conducted in a district of Seoul, South Korea, as secondary data. The survey’s aim was to examine the current patterns of game and smartphone usage among elementary, middle, and high school students in a specific region. Additionally, it aimed to explore the perceptions of middle and high school students regarding IGD. As MHL questions were exclusively administered to middle and high school students, elementary school students are excluded from the present study’s scope.
The research employed a multi-level cluster sampling method. Five middle schools and four high schools were randomly selected from the list of all middle and high schools in a designated area of Seoul for the first-stage cluster. Subsequently, second-year middle school and second-year high school students were chosen as the second-stage cluster. The survey covered students in all classes. Despite initially collecting data from 1,994 middle and high school students, this analysis included 1,936 students after excluding participants with missing data.
Measures
MHL for IGD
The MHL questionnaire was based on Jeon and colleagues’ scale [18] to assess IGD and PSU MHL among Korean teenagers and was simplified and revised as a vignette based on the IGD criteria of the Diagnostic and Statistical Manual of Mental Disorders, Fifth Edition (DSM-5) and 13 multiple-choice questions. The questionnaire presents the IGD vignette and asks for answers to its core problem; an open-ended question. Next, it presents four questions regarding the adolescents in the vignette: 1) “How distressed overall do you think they are?” 2) “How difficult do you think it will be to treat the problems?” 3) “How successful do you think they will be in school?” 4) “If you were their friend, how much would you recommend that they seek help?” and 9 items to assess attitude toward help-seeking resources, 5) self-help, 6) school teacher/school counselor, 7) friends, 8) parents and family, 9) out-of-school psychological counselor, 10) psychiatrist, 11) community addiction management center, 12) mobile and chat counseling for youth, and 13) book/Internet search. The 13 questions were scored on a 7-point Likert scale (1=not at all, 7=extremely) for each item.
Family Affluence Scale
The Family Affluence Scale (FAS) was developed from the World Health Organization’s Health Behavior in School-aged Children study [21] and has been validated for use with adolescents [22]. The FAS consists of 4 items: vehicle ownership, having their own room, the family has traveled for at least one night in the past year, and the number of computers owned. Total scores range from 0 to 9, with 0 to 2 indicating low affluence, 3 to 5 indicating medium affluence, and 6 to 9 indicating high affluence [21].
Internet usage time
Internet usage time was divided into weekends and weekdays. Participants were asked to provide their daily average usage time by content (i.e., SNS or messengers, webtoons or videos, games, etc.). Answers were converted to minutes. The mean daily usage time for e-learning (weekdays and weekends) was used as a separate variable. The total remaining time was considered Internet usage time for leisure and play.
Internet-related addiction prevention education
This study used the question “How many times have you received prevention education for addiction related to the Internet or smart devices?” for the variable. Participants selected 1 from none (0) to more than 5 times (5). The responses were transformed into binary variables for analysis; having no experience (0) or having experience (1).
Youth Pediatric Symptom Checklist 17
The Youth Pediatric Symptom Checklist 17 (YPSC-17) is a questionnaire comprising 17 self-reported items designed to evaluate risk signals for mental health in children and adolescents [23]. The original scale consists of 35 items, and the Korean version has been standardized [24]. The YPSC-17 scale, a shortened version of the original, has been used with Korean teenagers [25,26], and its reliability was confirmed with a Cronbach’s alpha of 0.87 [25]. The questionnaire response options range from never (0) to often (2). Total scores range from 0 to 34, with higher scores indicating more significant psychosocial difficulties. A total score of 15 or higher indicates a mental health problem [23]. It also includes three subcategories of mental health problems [23]: attention problems (7 points or higher in problems 1, 3, 7, 13, and 17), internalizing problems (5 points or higher in problems 2, 6, 9, 11, and 15), and externalizing problems (7 points or higher in problems 4, 5, 8, 10, 12, 14, and 16). The Cronbach’s α value in this study was 0.88, indicating good reliability.
Smartphone addiction scale
The smartphone addiction scale (S-scale) is a screening tool for PSU, developed as a 10-item questionnaire by the Korea Ministry of Science and ICT [27]. The scale was answered on a 4-point Likert scale from not at all (1) to very much (4). A total score from 23 to 30 indicates low risk, and 31 or higher indicates high risk [27]. The Cronbach’s α value was 0.89 in this study, indicating good reliability.
Internet Gaming Use Elicited Symptom Screen
Internet Gaming Use Elicited Symptom Screen (IGUESS) is a scale developed to assess the IGD risk for Korean adolescents based on the DSM-5 IGD diagnostic criteria [28]. Responses are recorded on a 4-point Likert scale (never=0, always=3). Participants with a total score of 10 or more are considered at high risk [28]. In this study, Cronbach’s α value was 0.84, indicating good internal consistency.
Statistical analysis
Latent profile analysis is a person-oriented approach that considers the individual characteristics of research subjects [29]. It is a statistical method to determine the number of latent profiles by analyzing a dataset of participants’ responses [30]. This study used 13 MHL multiple-choice questions, excluding one open-ended question. To determine the optimal number of profiles, information criteria; Akaike information criterion (AIC), Bayesian information criterion (BIC), and sample-size adjusted BIC (SABIC) were compared between models with increasing numbers of profiles. Indices with lower values indicate a better fit [31]. Model fit was evaluated using the Lo-Mendell-Rubin adjusted likelihood ratio test (LMR-LRT) and the parametric bootstrapped likelihood ratio test (BLRT). When evaluating a model with k latent classes, if the p values of LMR-LRT and BLRT are significant, k latent models are selected; otherwise, k-1 latent models are selected [31]. The classification quality was assessed by an entropy value of 0.8 or higher [32]. Lastly, the final profiles were comprehensively reviewed to ensure they have sufficient explanatory power [33]. Analysis was performed using Mplus 8.8 (Muthén & Muthén, Los Angeles, CA, USA).
To confirm the characteristics and predictors according to the classified profile types, sociodemographic variables (sex, age, FAS); Internet usage time; exposure to Internet-related addiction prevention education; mental health problems (YPSC-17); IGD (IGUESS); and PSU (S-scale) levels were used as measurement tools. The analysis used IBM SPSS 27 (IBM Corp., Armonk, NY, USA) with one-way ANOVA, post hoc analysis, and multinomial logistic regression. Missing values were excluded in multinomial logistic regression analysis, leaving 1,831 valid cases representing 94.6% of all participants.
RESULTS
Characteristics of sociodemographics and MHL for IGD
Of the participants, 1,007 were male (52.0%), 929 female (48.0%), with a mean age of 16.64±1.49 years. There were 863 middle school (44.6%) and 1,073 high school students (55.4%). The mean FAS score (n=1,903) was 5.78 (±1.79), with 1,134 participants (59.6%) classified as having a high level of family affluence, 689 (36.2%) having a moderate level, and 80 (4.2%) having a low level. This indicates that over 95% of the participants had a moderate or higher FAS level.
On weekdays, the average daily Internet usage time for educational purposes was 39.23 (±69.66) minutes; on weekends, 41.31 (±69.66) minutes. Excluding educational usage, Internet usage time was 250.84 (±191.27) minutes on weekdays and 333.66 (±222.04) minutes on weekends. Prevention education (n=1,907) for addiction related to smartphones or the Internet was received by 1,539 participants (80.7%), while 368 (19.3%) had no such experience.
Regarding mental health, the mean YPSC-17 score (n=1,932) was 5.69 (±5.29), and 163 (8.4%) of respondents were at risk for overall mental health problems. Internalized problems such as depression and anxiety were reported by 346 (17.9%) participants; attention problems by 117 (6.1%), and externalizing problems such as aggressive behavior or violence by 27 (1.4%). Out of the participants, 330 (17.1%) were in the PSU risk group (16.2% low risk, 0.9% high risk), and 1,604 (82.9%) were in the normal group, with a mean S-scale score (n=1,934) of 17.09 (±5.48). For IGD (n=1,925), 100 participants (5.2%) were in the high-risk group, and 1,825 (94.8%) were in the normal group, with a mean IGUESS score of 2.68 (±3.38).
Regarding MHL of IGD recognition, only 703 (36.3%) of the respondents recognized IGD correctly, while 1,233 (63.7%) answered incorrectly. Participants identified emotional difficulty and difficulty in school in the IGD vignette at 4.97 points (standard deviation [SD] 1.71) and 5.44 points (SD 1.43) on the 7-point Likert scale, while the difficulty of IGD treatment was recognized as the biggest challenge, with 5.71 points (SD 1.45). Participants rated the individual in the IGD vignette as needing help at 5.55 points (SD 1.53). In terms of help-seeking resources, family had the highest mean of 5.49 (SD 1.53), followed by psychologist outside of school (5.09, SD 1.68), community addiction management center (4.96, SD 1.79), teacher or school counselor (4.88, SD 1.75), friends (4.87, SD 1.66), and psychiatrist (4.77, SD 1.78). The groups with lower mean scores for help-seeking resources were telephone or chat counseling (4.52, SD 1.83), self-help (1.93, SD 4.38), and book or Internet searching (3.77, SD 1.86).
Latent profiles by MHL for IGD
As shown in Table 1, the model fit indices were compared while increasing the latent profiles individually. AIC, BIC, and SABIC continuously decreased for up to 6 profiles, and BLRT and LMR-LRT were also significant for up to 6 profiles, so the criteria for model selection based only on these indices was unclear. However, from the 6th profile, groups with less than 5.0% allocation began to appear. Based on previous research [31,33], we selected 5 profiles that represented at least 5.0% of the total number in each class. To confirm the suitability of the latent profiles, we identified the points where the slope of the change graph of the information indices became smoother, referring to previous studies [34]. The information indices (AIC, BIC, SABIC) were moderately adjusted at the three profile points. The entropy was highest for three latent profiles at 0.907, meaning the three latent profiles were the best statistical fit.
Finally, the three latent profiles were compared to the other profiles for interpretative relevance, and the three latent profiles provided a clearer explanation for each type than the other profiles. Therefore, the optimal subtype model of MHL for IGD was determined to be the three profiles.
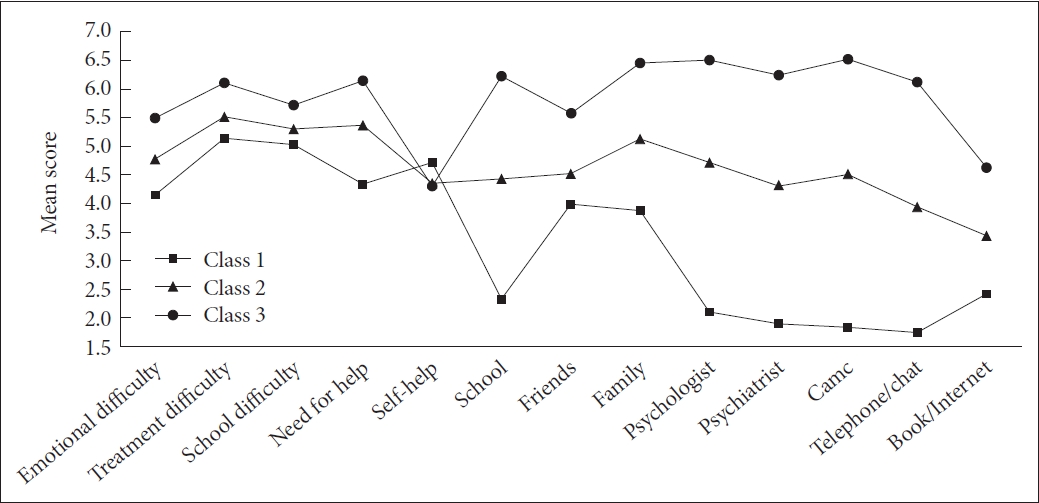
As shown in Table 2, among the three groups, Class 1 had the lowest mean for perception of difficulties and need for help. Additionally, they exhibited the least recognition of the need for professional resources but showed a relatively high preference for informal resources, such as family or friends. Considering these characteristics, Class 1 was labeled as the “low perception-prefer informal resource” type, comprising 12.4% (n=241) of the total participants.
Class 2 showed lower levels of understanding and empathy towards IGD compared to Class 3 but higher levels than Class 1. They also had a weaker preference for professional resources than Class 3 but had higher preferences compared to Class 1. Notably, according to Figure 1, Class 2 exhibited unclear preferences for help-seeking resources, with similar mean points across resources except for family. Therefore, this group was labeled as the “moderate perception-preferred resources unclear” type. It had the largest number of participants, with 49.3% (n=954) belonging to this group.
Class 3 demonstrated the highest understanding and empathy towards IGD and a stronger perception of the need for help. Additionally, they strongly preferred professional resources over informal resources. Consequently, they were labeled as the “high perception-prefer professional resources” type, comprising 38.3% (n=741) of the total sample.
Characteristic differences by latent profile type of MHL for IGD
One-way ANOVA and chi-square tests were used to determine if any characteristics differed between the three latent subtypes. The results of the analysis are shown in Table 3.
The demographic factor analysis showed that sex, age, and socioeconomic status differed across latent types. Notably, the “low perception-prefer informal resources” type had the highest proportion of male (66.0%) and the oldest mean age of 16.83 (SD 1.46), compared to the other two types. These differences between the types were all statistically significant (p<0.001, p<0.001). The “high perception-prefer professional resources” type exhibited a higher rate of high FAS level (61.6%) compared to the other latent types. The “moderate perception-preferred resources unclear” type had a higher proportion of low FAS level (5.8%) compared to the other groups. The difference between these groups was also statistically significant (p=0.002).
The difference in entertainment time spent on the Internet between weekdays and weekends was not statistically significant among the latent subtypes. However, there was a significant difference in e-learning time during the week among the latent subtypes (p=0.016). Particularly, the “low perception-prefer informal resources” type spent the least amount of time on e-learning compared to the other two groups, with 31.07 minutes (±62.39) during the week and 38.38 minutes (±80.21) on weekends. There was no significant difference in weekend e-learning time among the three groups.
Concerning the experience of addiction prevention education, 23.6% of the “low perception-prefer informal resources” type had no experience of prevention education, which was higher than the other two groups. Conversely, 83.2% of the “moderate perception-preferred resources unclear” type had experienced prevention education, which was higher than the other two groups. The difference between latent subtypes was statistically significant (p=0.015).
The “low perception-prefer informal resources” type had the highest mean score of 6.70 points (± 6.02) on the YPSC-17, indicating higher mental health risks compared to the “high perception-prefer professional resources” type, which had a score of 5.36 points (±5.31). The difference between the three types was statistically significant (p=0.009). Furthermore, when examining the mental health risk group for overall mental health problems and specific types (attention, internalization, externalization), the “low perception-prefer informal resources” type had the highest prevalence in the group (13.3%) and higher proportions in the sub-problem groups (9.1% attention, 25.3% internalization, 2.1% externalization) compared to the other types. The differences in mental health risk (p=0.015) and internalization of sub-problems by latent subtypes (p=0.006) were statistically significant.
We examined the variation in recognition of IGD across latent types and observed that the “high perception-prefer professional resources” type had the highest percentage of correct responses at 39.4%. However, the difference between groups was not statistically significant.
In terms of PSU and IGD, the “low perception-prefer informal resources” type had the highest mean total S-scale score (17.49, ±6.04) and IGUESS score (3.44, ±4.09) among the three groups. The differences between groups for each factor were statistically significant (p=0.001, p=0.001). Additionally, the “high perception-prefer professional resources” type had the lowest proportion of the low-risk group (14.9%) and the high-risk group (0.3%) for PSU, and the difference between the types was statistically significant (p=0.016). while the difference in the IGD risk group by latent subtypes was not statistically significant.
Predictors of profile on MHL for IGD
The result of multiple logistic regression analysis is presented in Table 4. For the “low perception-prefer informal resources” type compared to the “high perception-prefer professional resources” type, the odds increased by 1.20 times (OR=1.198, 95% confidence interval [CI] 1.08-1.33, p=0.001) with age, 1.91 times (OR=1.913, 95% CI 1.39-2.63, p<0.001) for males compared to females, and 1.05 times (OR=1.047, 95% CI 1.02-1.08, p=0.003) for each point increase in the total YPSC-17 score. Additionally, compared to high-risk PSU, the odds decreased by 87.5% (OR=0.125, 95% CI 0.02-0.66, p=0.014) for the normal group and by 88.1% (OR=0.119, 95% CI 0.02-0.63, p=0.012) for low-risk PSU.
Compared to the “high perception-prefer professional resources” type, the odds of belonging to the “moderate perception-preferred resources unclear” type increased by 1.15 times (OR=1.154, 95% CI 1.08-1.24, p<0.001) with age and by 1.90 times (OR=1.895, 95% CI 1.14-3.15, p=0.014) for those with lower FAS than those with higher FAS. Furthermore, the odds decreased by 29.9% (OR=0.711, 95% CI 0.55-0.92, p=0.008) for those with no exposure to IA prevention education.
For the “moderate perception-preferred resources unclear” type compared to the “low perception-prefer informal resources” type, the odds decreased by 47.0% for male (OR=0.530, 95% CI 0.39-0.72, p<0.001) and increased by 7.03 times (OR=7.026, 95% CI 1.69-29.28, p=0.007) for individuals with lower FAS compared to those with higher FAS. Moreover, as the average daily e-learning time increased on weekdays, the odds of belonging to the “moderate perception-preferred resources unclear” type increased by 1.35 times (OR=1.345, 95% CI 1.02-1.78, p=0.009), while each YPSC-17 score point increase decreased the odds by 3.8% (OR=0.962, 95% CI 0.93-0.99, p=0.009), and no experience of IA prevention education decreased the odds by 31.8% (OR=0.682, 95% CI 0.48-0.98, p=0.038).
DISCUSSION
This identified latent profiles of MHL for IGD among adolescents and explored the differences in characteristics and predictors for each type. The results revealed three latent types, with differences in characteristics including age, sex, socioeconomic, weekday e-learning time, experience in Internet-related addiction prevention education, mental health problems, and IGD and PSU risk levels. Moreover, all variables except IGD level were found to predict one or more of the latent types. The implications of these findings are discussed below.
First, individuals categorized as the “high perception-prefer professional resources” type were overall of younger age, higher FAS, lower levels of mental health problems, and lower tendencies towards PSU and IGD. Additionally, this group perceived IGD as more severe and expressed greater preferences for help-seeking from professional resources. Those with positive attitudes towards seeking help from mental health professionals are more likely to actively pursue treatment, aligning with findings from previous studies [9,35-37]. According to the Health Belief Model (HBM), individuals are more inclined to engage in preventive and health-promoting behaviors when they perceive the risk of a disease as serious and its potential harm as significant [38]. Therefore, the “high perception-prefer professional resources” type may be considered the most desirable level of MHL for IGD.
Second, the “moderate perception-preferred resources unclear” type can be considered a new type of MHL group not mentioned in previous studies [9,13-16]. This type’s preferred help resources outside the family remain ambivalent or unclear, which implies a lack of information on appropriate and effective IGD resources for this group. According to HBM, people are more likely to adopt healthy behaviors when they perceive greater benefits and fewer barriers [39]. Therefore, the “moderate perception-preferred resource unclear” type need interventions that emphasize exploring the usefulness of expert resources and addressing potential obstacles or difficulties in help-seeking (i.e., fear of stigma, expense, etc.). Unlike the “moderate perception-preferred resources unclear” type’s IGD score, their PSU score was homogeneous with the “low perception-informal resources” group. This finding implies that this type has a cautious attitude towards gaming use while concurrently indicating a comparatively more accepting stance towards smartphone use. Huang et al. [40] found that peers’ lenient attitudes toward smartphone use have both direct and indirect effects on PSU because adolescents are more likely to imitate and be influenced by the characteristics of their peers than parents. This underscores the importance of prevention efforts to curb the transmission of problematic behaviors [40]. Therefore, conventional preventive education should be reviewed to raise awareness of PSU as well as IGD.
Third, the “low perception-prefer informal resources” type were more likely to be male and show more vulnerability in overall mental health as well as higher scores for PSU and IGD. Given that IGD has a high prevalence in males, and the characteristics of games such as achievement and competition tend to be more appealing to male [41], they may be considered a vulnerable group for IGD MHL. Therefore, programs for improving IGD MHL should explore how to encourage male students’ participation. Creative IT-based approaches (e.g., gamified education programs, metaverses, etc.) may be considered for this purpose. The results regarding mental health vulnerability support Lam’s study [13], which argued that due to inadequate or insufficient mental health education, adolescents have difficulty recognizing their current mental health status, resulting in low MHL. As IGD is often comorbid with depression, anxiety, and ADHD [41], integrated MHL education that covers the comorbidity of IGD and PSU should be provided to adolescents. Moreover, IGD screening should be provided simultaneously so that early interventions can be conducted.
Fourth, the three MHL types did not exhibit noteworthy distinctions in Internet entertainment time; however, variations were evident in e-learning durations. This suggests a correlation between elevated MHL levels and the constructive utilization of Internet content. However, this study only distinguished between e-learning and other content, so future research could explore the inclusion of content that positively influences adolescents at various developmental stages or age groups alongside e-learning.
The insights gleaned from these findings can contribute to tailored preventive curricula, policies, and programs designed to improve IGD MHL among adolescents. Furthermore, considering the scarcity of research applying the concept of MHL to IGD, our findings offer a valuable academic contribution.
Still, this study has several limitations. First, the study was based on secondary data analysis of adolescents in Seoul, so the generalizability of findings to all Korean adolescents may be limited. Future research should sample adolescents from multiple locations, including urban and rural areas, to investigate differences in IGD MHL according to regional and environmental characteristics. Second, because the data were cross-sectional, this study could not establish causality or determine whether IGD MHL changes over time. Therefore, future longitudinal research is needed. Third, the present study was conducted using self-reported survey data, which could potentially be susceptible to bias. Specifically, the assessments of Internet entertainment time and e-learning time depend on subjective evaluations, introducing the possibility of underreporting. Fourth, as the measurement of MHL was limited to IGD, the study cannot encompass MHL for other Internet-related addictions (i.e., PSU, excessive SNS use etc.).
In conclusion, this study identified three distinct profiles of IGD MHL among adolescents with varying characteristics and predictive factors. The “low perception-prefer informal resources” type, predominantly male, emerged as a focal point for targeted interventions due to its association with heightened mental health problems and PSU. The “moderate perception-preferred resources unclear” type underscored the necessity for precise information dissemination on expert resources, especially beyond familial channels. The “high perception-prefer professional resources” type presented the most favorable IGD MHL level. Drawing from these insights, a more proactive approach to IGD MHL improvement education for male students is recommended, alongside the development of tailored educational programs catering to various levels of MHL.