Dysfunctional Patterns of Gamma-Band Activity in Response to Human Faces Compared to Non-Facial Stimuli in Patients with Schizophrenia
Article information
Abstract
Objective
Healthy individuals show stronger gamma-band activities (GBAs) for socially relevant stimuli (human faces) than for non-relevant ones. This study aimed to examine whether this gamma-band preference occurs in patients with schizophrenia.
Methods
EEG was recorded for 24 patients with schizophrenia and 23 healthy controls while they viewed pictures of human faces, chairs, and nature scenes. The spectral powers of high-beta (20–30 Hz) and gamma (30–80 Hz) frequencies were analyzed along 3 midline cortical regions, and phase synchronization was calculated.
Results
Compared to the response to non-facial stimuli, higher event related deactivation to facial stimuli was observed for the high-beta frequency across groups. For the gamma frequency, early-stage GBA was increased and late-stage GBA was decreased for all 3 stimuli in patients with schizophrenia compared to healthy controls. Preferential GBA patterns (100–200 and 200–300 ms) were found in healthy controls, but not in patients with schizophrenia. Significant correlation existed between negative symptoms and GBA in the frontal region for chair and scene stimuli. There was no significant intergroup difference in phase synchronization pattern.
Conclusion
Our results suggest that patients with schizophrenia have deficits in the preferential pattern of GBA for human faces and the deficits in the preferential pattern were mainly influenced by over-response to socially non-relevant stimuli.
INTRODUCTION
Gamma frequencies usually refer to high-frequency waves >20 Hz1 or >30 Hz2 that are implicated in sensory and perceptual processing,34 selective attention,5 working memory,6 long-term memory,7 and motor control.8 Generally, it is accepted that 20–30-Hz bands are in the high-beta range and that >30-Hz bands are in the gamma range.910
The ability to recognize human faces is essential for the development of social cognition that guides successful social behavior.111213 Several studies have indicated that gamma-band activity (GBA) detected using electroencephalogram (EEG) is associated with face and emotional face processing in healthy individuals.9141516 Higher induced GBA (iGBA) is observed at midline areas around 150–250 ms9 and around 300 ms1 during face processing.
Patients with schizophrenia exhibit deficits in face processing, which may contribute to their poor interpersonal and social skills.1718192021 The deficit in processing socially relevant stimuli (e.g., human faces) could be a basic pathology of mental illness such schizophrenia and autism spectrum disorder. Reduced phase synchronization in the beta band (20–30 Hz) has been reported during poor performance of Gestalt perception in these patients.22 Moreover, compared to HCs, patients with schizophrenia show decreased GBA and gamma synchronization in response to human faces.2324
Socially relevant stimuli have been suggested to be associated with unique gamma activity.1 Compared to socially irrelevant stimuli, human faces elicited greater iGBA and larger, earlier, and more time-locked neural synchronization in HCs. Such unique gamma responses to human faces suggest that stronger GBA for socially relevant stimuli may be critical for adaptive daily living. Even though compared to HCs, patients with schizophrenia show decreased GBA and gamma synchronization to human face stimuli, no studies have examined the preferential pattern of GBA in these patients using multiple stimuli with differing levels of social relevance. In this study, we examined the spectral power and synchronization patterns of high-beta and gamma frequencies in patients with schizophrenia presented with socially relevant (faces) and socially non-relevant stimuli (chairs and nature scenes).
We hypothesized that 1) preferential patterns for high-beta (20–30 Hz) and gamma band (30–80 Hz) spectral power and phase synchronization for socially relevant stimuli observed in HCs would not be present in patients with schizophrenia and that 2) these deficits in preferential pattern of high-beta and gamma frequencies would be caused by reduced response to socially relevant stimuli but not to socially non-relevant stimuli, which is preserved in patients with schizophrenia.
METHODS
Participants
Twenty-four patients with schizophrenia were recruited and were assessed for Axis I25 and II26 disorders based on the Structured Clinical Interview for the Diagnostic and Statistical Manual of Mental Disorders, 4th edition (SCID). Their psychiatric symptoms were evaluated using the Positive and Negative Syndrome Scale (PANSS).27 No patient had a lifetime history of central nervous system disease, alcohol or drug abuse, electroconvulsive therapy, mental retardation, or head injury with loss of consciousness. All patients were receiving atypical antipsychotic medication at the time of testing (risperidone, n=15; olanzapine, n=7; and quetiapine, n=2).
Twenty-three HCs were recruited from the local community through newspapers and flyers. An initial screening interview excluded subjects with any identifiable neurological disorder or head injury or any personal or family history of psychiatric illness. After the initial screening, potential HCs were interviewed using the SCID for Axis II Psychiatric Disorders26 and were excluded if they had any of these disorders.
All subjects had normal or corrected-to-normal vision and were right-handed, as determined by asking about the hand used for writing and other precise motor skills. All subjects signed a written informed consent form approved by the Institutional Review Board of Inje University Ilsan Paik Hospital.
Test procedures
Subjects were shown 4 types of pictures: human faces, chairs, nature scenes, and butterflies. Fifty neutral face pictures comprised the entire face were selected from the Korea University Facial Expression Collection.28 Fifty Chairs, fifty nature scene pictures and a butterfly picture were carefully selected from the Internet and were copyright and royalty free.
Subjects were instructed to sit quietly in a chair in a lightly lit room with their head placed 1 m from a screen at a maximum visual angle of 4×4°. In a random order, but at the same frequency, 350 pictures including 100 faces, 100 chairs, 100 nature scenes, and 50 butterflies were presented. Participants were asked to press a button with their right thumb only when the butterfly picture was presented.
Trials began with the presentation of a fixation cross for 100 ms, followed by a black screen for 500 ms. Stimuli were then presented for 500 ms, followed by a black screen, which was displayed for 950–1,050 ms. The entire recording session for each subject lasted approximately 13 min.
EEG recording and analysis procedures
EEG recording
EEG recording was synchronized to stimulus presentation onset. EEG activity was recorded and amplified using a NeuroScan SynAmps amplifier (Compumedics USA, El Paso, TX, USA) and 64 Ag-AgCl electrodes mounted on a Quick Cap using an extended 10–20 placement scheme. The vertical electrooculogram (EOG) was recorded using two electrodes, placed above and below the right eye, respectively. The horizontal EOG was recorded at the outer canthus of each eye. EEG data were recorded at a sampling rate of 1,000 Hz with a 0.1–100 Hz band-pass filter and a 60-Hz notch filter. The ground electrode was placed on the forehead, and the reference was located at electrode Cz.
EEG data were processed using Scan 4.3 (Compumedics USA). Gross movement artifacts were removed by visual inspection, and eye blinks were removed using preinstalled software of Scan 4.3 which subtracted the averaged EOG response from the EEG channels.2930313233 The preprocessed EEG data were referenced to an average reference. Data were then epoched to the 300-ms prestimulus and 1000-ms poststimulus, and baseline correction was performed using the prestimulus period. Epochs were rejected if there were significant physiological artifacts (amplitude exceeding ±70 µV) at any site over all electrode sites except M1 and M2.
All participants exhibited a sufficient number of accepted event-related potential (ERP) epochs for faces, chairs, and scenes, and the averaged acceptance rates did not differ significantly between groups (face: SPR=84.32±14.00, NC= 84.61±14.20, p=0.948; chair: SPR=85.63±12.06, NC=84.04±15.93, p=0.708; scene: SPR=85.04±13.72, NC=85.57±13.84, p= 0.899, t-test). In addition, there was no significant difference between conditions in each groups (SPR: p=0.941, NC: p= 0.947, ANOVA).
Removal of miniature saccades
Recent studies have shown that the induced gamma-band activity (iGBA) recorded from scalp EEG over 200–350 ms after visual stimulus onset might be partly affected by EOG due to miniature saccades.3435 In this study, miniature saccadic artifacts were removed using an independent component analysis (ICA), which has been used previously for the same purpose.3637 We used the infomax ICA algorithm implemented in the MATLAB toolbox EEGLAB.38 A well-trained researcher who was familiar with ICA but blind to our data examined all EEG epochs of each participant and removed independent components (ICs) containing miniature saccadic artifacts by visually searching ICs with a typical sharp spike waveform3637 and a topographic map with focal prefrontal dominancy. The application of ICA did not further reduce the number of EEG epochs. The miniature saccadic artifacts were found in most subjects except five subjects.
Windows of interest determination
Midline electrodes were chosen for GBA analysis based on previous findings that the GBA in face-related processing is higher at the midline cortex.19141639 In this study, three midline regions were investigated: frontal (FPz, Fz), central (Cz, CPz), and posterior (Pz, POz, Oz) (Figure 1), and the time range into 9-windows of interest (WOIs) at 100-ms intervals from 0-to-900 ms based on stimulus onset at high-beta (20–30 Hz) and gamma (30–80 Hz) frequency ranges. In total, 18 WOIs were created (Figure 2). Frequency range was divided into high-beta and gamma frequency ranges according to previous studies.910
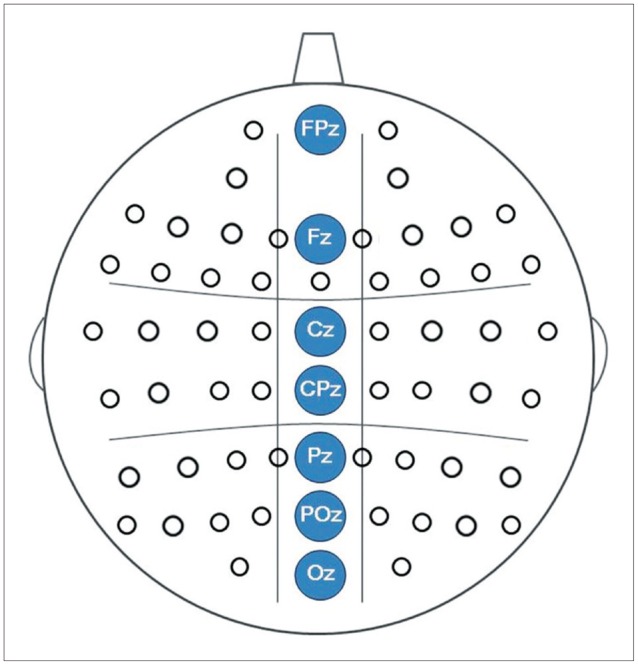
Three midline cortical regions, which were analyzed in this study.
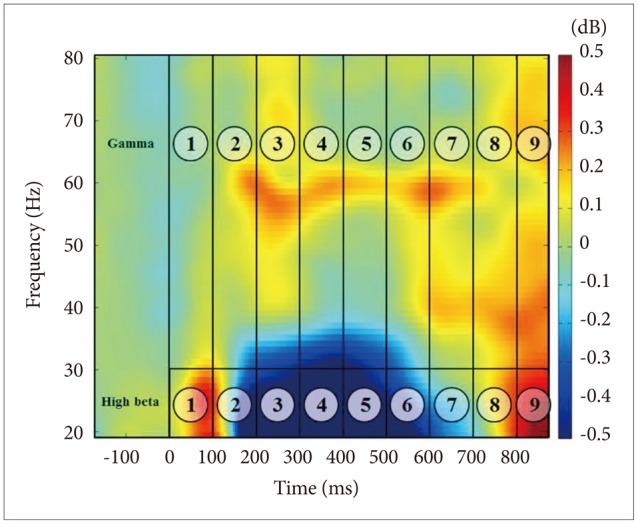
Eighteen WOI sites in the ERSP figure for all subjects and stimuli.
Spectral power analysis
To measure spectral power, an event-related spectral perturbation (ERSP) analysis was applied to the recorded EEG signals. ERSP was calculated using functions implemented in EEGLAB.38404142 Spectral power was calculated using the short-time Fourier transform every 5 ms with a Hanning window size of 250 ms for each trial. No smoothing or filtering process was applied in generating the resultant ERSP maps. The power spectrum of each trial was then normalized with respect to the average power of the partial baseline period (-200 to -100 ms) to probe for changes in the spectral power values before and after the stimulus onset. The normalized power spectra were then averaged over trials, which resulted in baseline-normalized ERSP maps for each individual. These procedures were repeated for every midline channel (FCz, Fz, Cz, CPz, Pz, POz, and Oz), and each individual ERSP map was then averaged across all subjects. Spectral powers were aver-aged and grouped as frontal (FPz, Fz), central (Cz, CPz), and posterior (Pz, POz, Oz).
For the high beta frequency, terms such as event-related synchrony (ERS) and event-related desynchrony (ERD) were used for activation and deactivation of each spectral power, respectively.43 The terms ERS and ERD have been applied to alpha and beta activity,44 but not to gamma activity. By convention, an ERD corresponds to a negative value, i.e., a decrease in power, while an ERS refers to an increased signal power compared to a fixed and constant baseline level.
Inter-trial coherence (ITC) measurements were applied to determine if the ERSP activity seen in beta and gamma was of an induced or evoked nature.1 The ERSP activities for face stimuli were 0.0894 in WOI1, 0.127 in WOI4, and 0.1268 in WOI6. These could be considered as induced activities.
Phase-synchronization analysis
To investigate the differences in functional connectivity between different locations, phase-locking values (PLVs) were evaluated between EEG signals recorded at different locations. PLVs can be used to measure how closely two different signals interact with each other.45 PLV can be calculated as:
 ,
,where Δϕ(t) represents the instantaneous phase difference between two signals which can be evaluated using the Hilbert Transform. The PLV value ranges from 0, when the phase difference varies randomly with respect to time, to 1, when the phase difference of two signals does not change over time. EEG signals from 19 electrodes (Fp1, Fp2, Fz, F3, F7, F4, F8, Cz, C3, T7, C4, T8, Pz, P3, P7, P4, P8, O1, and O2) were used to calculate PLVs.
Statistical analyses
Between group analyses
The repeated-measures analysis of variance (ANOVA) was conducted in order to determine statistical reliability for high beta and gamma frequency ranges, respectively. To assess the spectral power of each WOI, repeated-measures ANOVA was also used for each WOIs using regions (frontal, central, and posterior) and stimuli type (face, chair, and scene) as within-subject factors, and group as a between-subject factor. Mauchly's test was used to evaluate the sphericity assumption. Degrees of freedom were corrected using the Greenhouse-Geisser procedure. Post hoc comparisons were performed using Bonferroni corrected t-tests.
Regional effects and region-related interactions were not reported if there did not exist significant stimuli-by-region-by-group interactions. Figures 3 and 4 illustrate the time course of spectral power activity of high-beta and gamma frequencies for the 3 stimuli. To address the issue of multiple comparisons, we used the Bonferroni correction and alpha was set at p<0.0055.
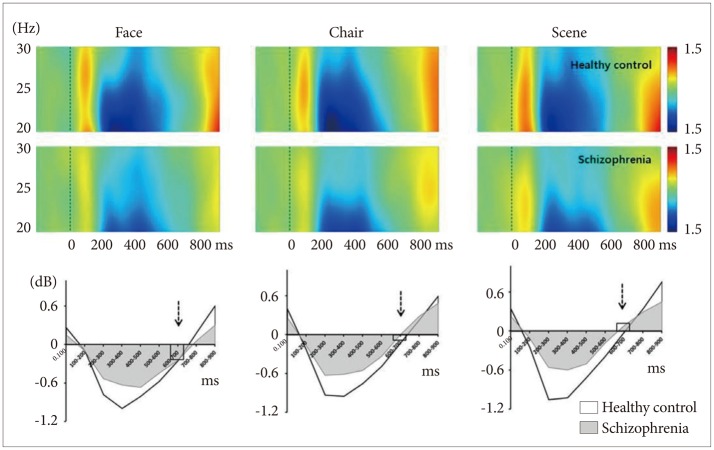
Time course of spectral power (ERSP) of high-beta frequency range normalized to baseline over whole electrodes (FPz, Fz, Cz, CPz, Pz, POz, and Oz). The patterns were very similar for all 3 stimuli in both healthy controls and schizophrenia patients. In contrast, face stimuli produced event-related desynchrony while scene produced event-related synchrony at 600-700 ms (broken arrows).
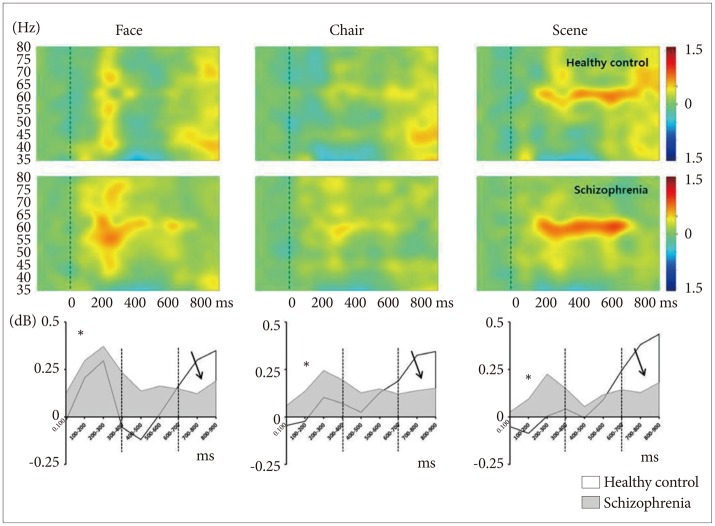
Time course of spectral power (ERSP) of gamma frequency range normalized to baseline over whole electrodes (FPz, Fz, Cz, CPz, Pz, POz, and Oz). Patients with schizophrenia showed initial overactivation at 0–400 ms (asterisks), sustained hyperactivation at 400-600 ms, and no reactivation at 600-900 ms (solid arrows).
Within group analysis
To determine whether the gamma band preferential pattern for human faces, one-way ANOVA was performed for spectral power at the central region (Cz, CPz) according to the 3 stimulus conditions in each group separately. The significance was tested with p<0.0055 concerning Bonferroni correction.
Phase synchronization analysis
Significant increase or decrease in PLVs calculated between each pair of electrodes was tested in contrast to the baseline PLV using a two-tailed t-test (p<0.0003, Bonferroni corrected). Significant connectivity was visualized using a red or blue line, which indicates a significant increase or decrease, respectively.2223
Correlation analysis
Pearson's correlation was performed between spectral power and symptom severity, duration of illness, and medication dosage. A bootstrap analysis (n=5,000) was performed to avoid false positivity due to multiple correlations.
RESULTS
Demographic information and behavioral data
The demographic data are presented in Table 1. Regarding the behavioral task, patients with schizophrenia showed significantly decreased hit rate and delayed response time compared to HCs. For your reference, N170 waves are presented in Figure 5.
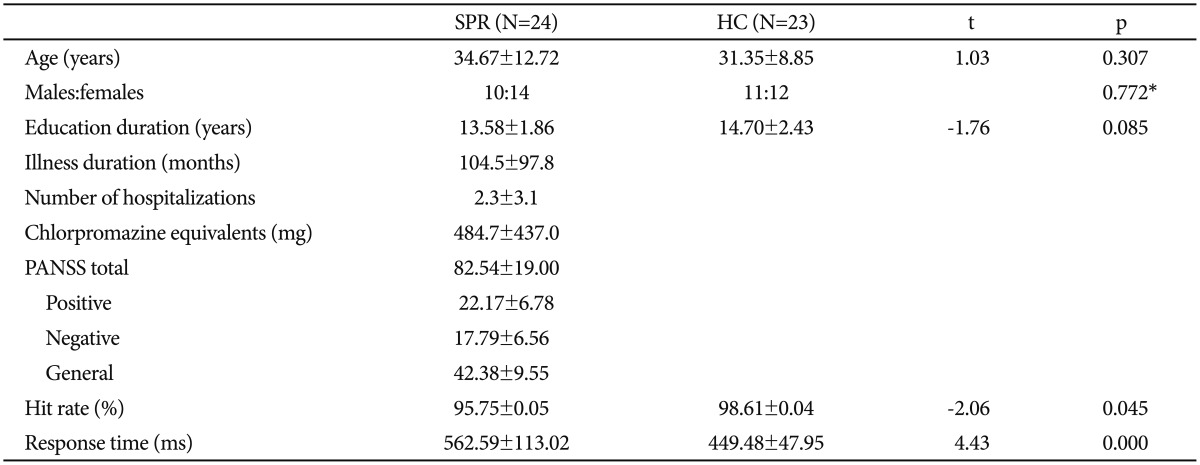
Clinical characteristics of patients with schizophrenia and healthy controls (mean values±standard deviations)
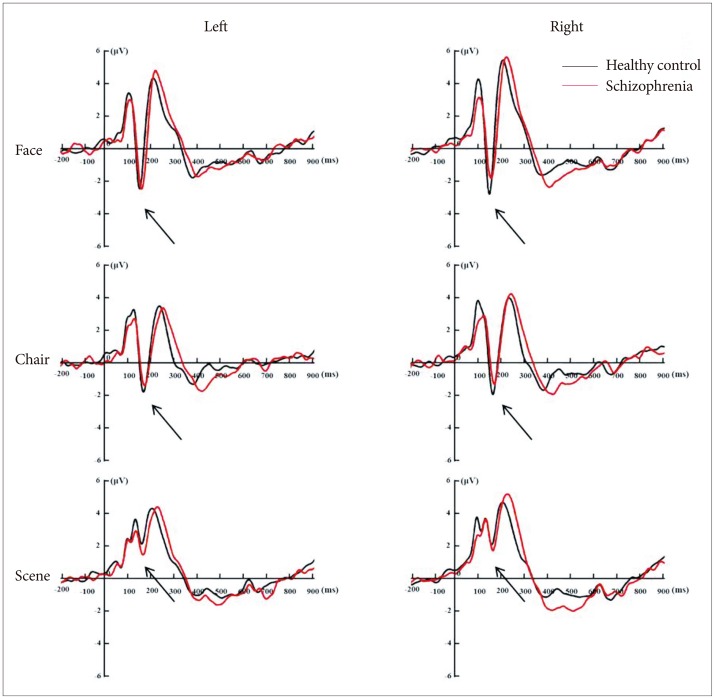
Event-related potential N170 waves (solid arrows) at left (P7, PO7) and right (P8, PO8) hemispheres for face, chair, and scene stimuli. Band pass filter was applied of 0.1 to 30 Hz.
Spectral-power analysis
Between group analysis
High-beta frequency (20–30 Hz)
Full WOIs (0–900 ms)
There was a significant region-by-group interaction (F=3.22, df=2, p=0.045). Further analysis was conducted in each WOIs.
WOI3 (200–300 ms), WOI4 (300–400 ms), WOI5 (400–500 ms), and WOI6 (500–600 ms)
Compared to HCs, patients with schizophrenia showed reduced ERD (200–400 ms) for all 3 stimuli (Figure 3). However, these group differences did not survive correction for multiple comparisons.
WOI7 (600–700 ms)
There were significant main effects for stimulus (F=6.43, df=2, p=0.002). ERD/ERS were partially overlapped for face, chair, and scene stimuli (-0.25±0.72 vs. -0.06±0.79 vs. 0.04± 0.69, respectively) (Figure 3, broken arrows). There were significant differences in spectral power between face and scene stimuli (corrected p=0.002).
WOI1 (0–100 ms), WOI2 (100–200 ms), WOI8 (700–800 ms), WOI9 (800–900 ms)
There were no significant statistical effects.
Gamma frequency (30–80 Hz)
Full WOIs (0–900 ms)
There was a significant stimulus-by-region-by-group interaction (F=2.71, df=4, p=0.032). Further analysis was conducted in each WOIs.
WOI1 (0–100 ms)
There was a significant stimulus-by-region-by-group interaction (F=4.317, df=4, p=0.002). Further analysis revealed that patients with schizophrenia, compared with HCs, exhibited significantly stronger GBA of the frontal region for face stimuli (Figure 6A, corrected p=0.006) and of the central region for scene stimuli (Figure 6B, corrected p=0.003).
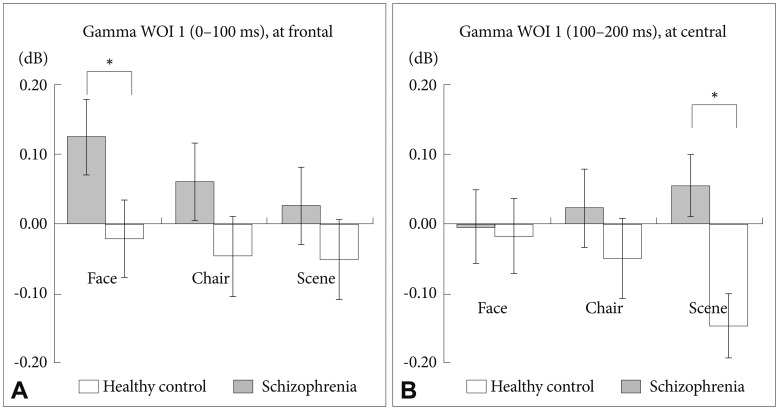
Between group analysis of spectral power for gamma WOI 1. (A) At the frontal midline region, patients with schizophrenia showed stronger gammaband activities for the 3 stimuli compared with HCs. A significant difference was found for face stimuli (corrected p=0.006). (B) At the central midline region, patients with schizophrenia showed stronger gamma-band activities for scene stimuli compared with HCs (corrected p=0.003).
WOI2 (100–200 ms)
There were significant main effects for stimulus (F=13.21, df=2, p<0.001). The GBA of face stimuli was stronger than that of chair (corrected p=0.001) and scene (corrected p<0.001) stimuli (Figure 4, asterisks; Figure 7A).
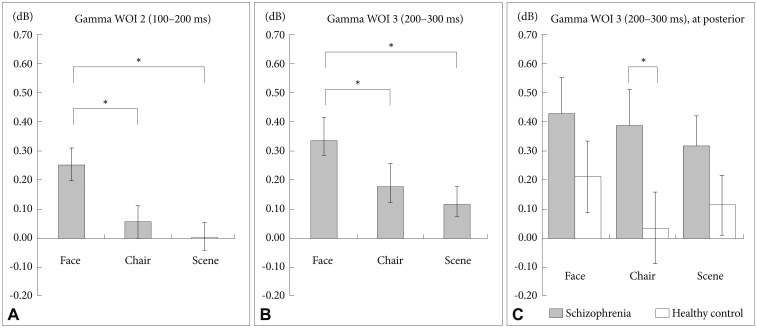
Between group analysis of spectral power for gamma WOI 2 and WOI 3. Face stimuli showed stronger gamma-band activities compared with chair and scene at WOI 2 (A) and WOI 3 (B). C: At the posterior midline region for gamma WOI 3, patients with schizophrenia exhibited significantly stronger gamma band activities for the 3 stimuli compared with HCs. A significant difference was found for chair stimuli. *p<0.05.
WOI3 (200–300 ms)
There were significant main effects for stimulus (F=7.31, df= 2, p=0.001). The GBA of face stimuli was stronger than those of chair (corrected p=0.23) and scene (corrected p=0.001) stimuli (Figure 4, asterisks; Figure 7B). Moreover, there was a significant stimulus-by-region-by-group interaction (F=2.48, df=4, p=0.046). Further analysis revealed that patients with schizophrenia, compared with HCs, exhibited a significantly stronger GBA of the posterior region for chair stimuli (Figure 7C, corrected p=0.048).
WOI4 (300–400 ms), WOI5 (400–500 ms), WOI6 (500–600 ms), and WOI7 (600–700 ms)
There were no significant statistical effects.
WOI 8 (700–800 ms)
There was a significant main effect for group (F=4.29, df=1, p=0.044). The GBA of patients with schizophrenia was significantly weaker than that of HCs (p=0.044; Figure 4, solid arrows). Moreover, there was a significant stimulus-by-region-by-group interaction (F=3.40, df=4, p=0.010). Further analysis revealed that patients with schizophrenia exhibited a significantly weaker GBA compared with HCs in the central region for face (corrected p=0.007), chair (corrected p=0.048), and scene (corrected p=0.047) stimuli.
WOI 9 (800–900 ms)
There were no significant main effects or interactions.
Within group analysis
One-way ANOVA revealed the presence of significant effects for gamma WOI2 (F=11.36, df=2, p<0.001) and WOI3 (F=5.65, df=2, p=0.005) in HCs. Further analysis revealed that, in HCs, the GBA of WOI2 for face stimuli was increased compared with those observed for chair (corrected p=0.023) and scene (corrected p<0.001) stimuli (Figure 8A). Moreover, in HCs, the GBA of WOI3 for face stimuli was increased compared with that of scene stimuli (corrected p=0.005) (Figure 8B). However, patients with schizophrenia did not exhibit any significant effects across WOIs.
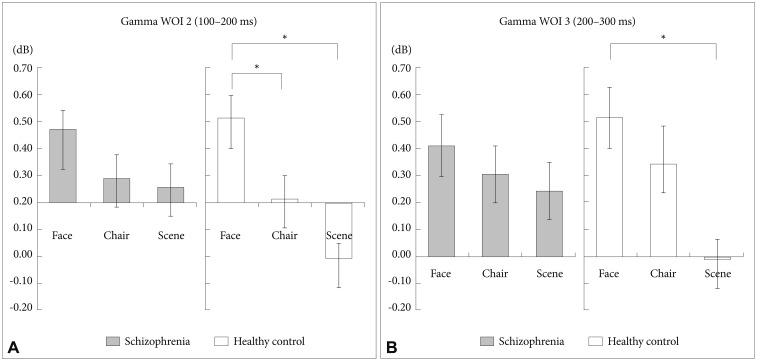
Within group analysis (preferential analysis) of spectral power at central region (Cz, CPz). The left panel (A) shows gamma-band activities for gamma WOI 2. The right panel (B) shows gamma-band activities for gamma WOI 3. Patients with schizophrenia did not show any significant differences, whereas HCs showed significant differences in gamma-band activity among the 3 stimuli. *p<0.05.
Phase synchronization analysis
Compared with HCs, patients with schizophrenia exhibited fewer significant synchrony lines among electrodes sites for all 3 stimuli (Figure 9). Synchrony lines decreased gradually in face, chair, and scene stimuli. Group comparisons regarding phase synchronization were performed using a chi-squared test for each time bin,2346 which demonstrated that the phase synchronization distribution did not differ significantly between the groups across time bins at high-beta frequency [face: χ2(3)=7, p=0.079; chair: χ2(2)=4 p=0.135; scene: χ2(7)=8, p=0.333], and at gamma frequency [face: χ2(4)=5.143, p= 0.273; chair: χ2(2)=4, p=0.135; scene: χ2(1)=3, p=0.083].
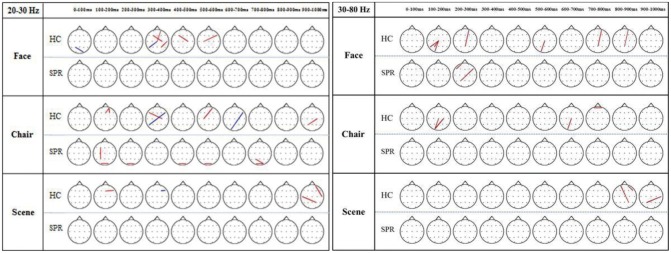
Topography of phase synchronization for face, chair, and scene processing in patients with schizophrenia (SPR) and healthy control (HC) populations. The phase locking value (PLV) between each pair of electrodes was tested regarding a significant increase (red) or decrease (black) compared with the baseline PLV using a 2-tailed t-test (p<0.0003, Bonferroni corrected). More synchrony lines were seen in healthy controls compared with patients having schizophrenia for all 3 stimuli. However, the phase-synchrony distribution was not significantly different between the groups across all time bins in the high-beta frequency [face: χ2(3)=7, p=0.079; chair: χ2(2)=4, p=0.135; scene: χ2(7)=8, p=0.333] and in the gamma frequency [face: χ2(4)=5.143, p=0.273; chair: χ2(2)=4, p=0.135; scene: χ2(1)=3, p=0.083].
Correlation analysis
PANSS negative symptoms exhibited a significant positive correlation with GBA in WOI2 of the frontal region for chair (r=0.523, p=0.009), and scene (r=0.549, p=0.005) stimuli. The medication dosage and illness duration were not significantly correlated with spectral power.
DISCUSSION
This study examined whether patients with schizophrenia and HCs showed differential patterns in spectral power and phase synchronization at high-beta and gamma frequencies when processing socially relevant (human faces) and non-relevant stimuli. We found the higher ERD activity in face stimuli compared with socially non-relevant stimuli for the high-beta frequency, whereas stimuli-driven group differences were found only in the gamma band frequency, with most of the specific group differences related to face processing.
In the high-beta frequency range, similar spectral patterns were found across the 3 stimuli in both groups: initial ERS, middle ERD, and late ERS. The initial prominent ERS was converted to ERD at around 200 ms, which then reverted to ERS at around 700 ms (Figure 3). Significant stimuli effect was observed in WOI7 (600–700 ms). In this time range, face stimuli produced the ERD pattern while scene stimuli showed ERS pattern. It has been suggested that the ERD is an electro-physiological correlate of the cortical areas involved in the processing of sensory or cognitive information or in the production of motor behavior.43 An increased and more widespread ERD may be the result of the involvement of a larger neural network. Although little is known about the role of ERD patterns in this high-beta frequency range in visual processing, the ERD observed in faces compared with scene stimuli may indicate a larger neural network involvement in socially relevant stimuli compared with non-irrelevant ones. Further research is needed to study this deactivation pattern in the high-beta frequency range.
At the early stage (0–400 ms) of processing, patients with schizophrenia showed an aberrantly high GBA for chair and scene stimuli, whereas HCs showed a relatively low GBA during this early stage (Figure 4 and 6). Preferential pattern analysis (within-group analysis) indicated that HCs exhibited a distinctive pattern of GBA in this early stage: it was highest for faces, moderate for chairs, and lowest for scenes (Figure 8). However, the patients showed significantly higher GBA for chair and scene stimuli and exhibited an almost flat response to all 3 stimuli. Furthermore, patients with schizophrenia showed a significant correlation between negative symptoms and GBA in frontal region for chair and scene stimuli. It suggests that patients with predominant negative symptoms do not have preferential neural processing to socially relevant stimulus. Collectively, these findings suggest that flexible and discriminative GBA for various degrees of social stimuli may be a critical mechanism of proper mental processing. Functionally, this decreased preferential pattern of GBA for socially relevant stimuli might represent a basic neural mechanism of decreased social function in patients with schizophrenia.
In HCs, there was an abrupt deactivation of GBA to face stimuli during the middle stage of visual processing (400–600 ms); in contrast, patients did not show this deactivation pattern (Figure 4). It is of note that these patients showed a narrow width of GBA range compared with HCs.47 Reported that patients with schizophrenia have significant deficits in the cortical inhibition of gamma oscillations in the dorsolateral prefrontal cortex compared with HCs and patients with bipolar disorder. They suggested that this lack of gamma oscillation inhibition in dorsolateral prefrontal cortex might represent an important frontal neurophysiological deficit in schizophrenia. Studies of the default mode network in patients with schizophrenia have shown an aberrantly high activation pattern during the resting state.4849 These types of aberrant, reversed neural activation patterns suggest that patients with schizophrenia have a weak neural generator of GBA for facial stimuli and also fail to deactivate GBA when stimuli are repeated, which may be necessary to focus resources on the processing of previous important stimuli.
During the late stage of visual processing (600–900 ms), the GBA of patients with schizophrenia was weaker than that of HCs across all 3 stimuli (Figure 4). However, these group differences disappeared after correction for multiple comparisons. This decreased late-stage activity of patients may be responsible for the top-down processing deficit, which may be involved in the elaboration of perceptual processing.
There were no significant intergroup differences in phase synchrony for either face or non-face stimuli. Because the smeared nature of the scalp may blur the phase synchrony effect, we analyzed data again using surface Laplacian transformation to estimate current source density, however, the results did not significantly change. Possibly, the different study paradigm and the relatively small numbers of applied stimuli were the main reason for this difference from our previous results.23
This study has the limitation that all patients were taking antipsychotic medications, and we were unable to exclude drug effects. However, our behavioral data suggest that both groups were able to perform this task well. Moreover, antipsychotic medication dosage was not significantly correlated with high-beta activity and GBA.
In summary, we found that compared with HCs, patients with schizophrenia showed 1) aberrantly increased early-stage GBA for all 3 stimuli; 2) absence of the early-stage GBA preferential pattern for facial stimuli vs. non-facial stimuli; 3) significant correlation between negative symptoms and frontal GBA for chair and scene stimuli; 4) a lack of deactivation (i.e., deactivation failure) of GBA in the middle stage of visual processing (400–700 ms), which may be a critical pathophysiological finding.
We could conclude that 1) gamma-band spectral power has a preferential pattern for socially relevant stimuli in HCs, which was not observed in patients with schizophrenia and that 2) the deficits in the preferential GBA pattern in patients with schizophrenia was mainly influenced by over-response to less socially relevant stimuli.
Acknowledgments
The authors thank JI Kim and SH Jeon for their assistance. This work was supported by a grants from the Korea Science and Engineering Foundation (KOSEF), which is funded by the Korean government (M10644000005-06N4400-00510 & NRF-2015R1A2A2A01003564). All authors had full access to the data of the study as well as final responsibility for the decision to submit for publication.