Serum N-Desmethylcitalopram Concentrations are Associated with the Clinical Response to Citalopram of Patients with Major Depression
Article information
Abstract
Objective
Citalopram (CITA) is a widely used and well-tolerated selective serotonin reuptake inhibitor. The aim of the study was to evaluate the possible influences of serum concentrations of CITA and its major metabolite n-desmethylcitalopram (NDCITA) on the efficacy and tolerability of CITA in patients with major depressive disorder.
Methods
The study included 46 outpatients with major depressive disorder who received CITA. The efficacy and tolerability were assessed for 6 weeks. Serum CITA and NDCITA levels were measured at the 4th week.
Results
The HDRS17 total scores of the patients with high NDCITA and CITA & NDCITA concentrations showed a more significant reduction compared to the patients with expected and low serum NDCITA and CITA & NDCITA concentrations. However, we did not observe a correlation between the serum concentrations and the side effects of CITA, NDCITA, and CITA & NDCITA.
Conclusion
Our results suggested the potential contribution of NDCITA to the antidepressant effect of CITA. Further studies involving larger clinical samples are required to confirm the impact of serum NDCITA concentrations on the efficacy of CITA.
INTRODUCTION
Major depressive disorder (MDD) is the most prevalent psychiatric disease with a highly variable treatment response to antidepressants [1,2], with up to one-third of patients not achieving an adequate response to the first-line antidepressant treatment [3]. Selective serotonin reuptake inhibitors (SSRIs) are the first choice in the pharmacological treatment of most cases of depression and their therapeutic window has not been established. Large inter-individual variations in the pharmacokinetics and pharmacodynamics of antidepressants, requires the development of adequate tools for optimizing treatment a major aim for psychopharmacology research [4].
Citalopram (CITA) as a racemic drug (R, S-citalopram) is a widely used and well-tolerated antidepressant that belongs to the SSRI class [5]. CITA is metabolized to n-desmethylcitalopram (NDCITA) and n-didesmethylcitalopram (NDDCITA) through n-demethylation [6,7]. The concentrations of these metabolites at steady state in the plasma in relation to the CITA levels are 30–50% for NDCITA and 5–10% for NDDCITA [8]. With a wide inter-individual variation, the plasma half-life (t1/2) at steady state is approximately 35 hours for CITA, 50 hours for NDCITA, and 100 hours for NDDCITA [8]. Although in vitro studies suggested that CITA is mainly responsible for the antidepressant effect, NDCITA also has affinity for the human serotonin transporter that cannot be ignored, especially at higher serum concentrations [9].
As for most SSRIs, the therapeutic window of CITA hasn’t been established yet. Although an earlier study recommended a 30 ng/mL steady-state serum concentration as a lower limit [10], two recent studies suggested that 50 ng/mL of serum CITA concentrations are required at steady state for efficient therapy [11,12]. However, studies that examine the effects of serum NDCITA concentrations on the clinical response to CITA are lacking in the literature. The aim of the current study was to evaluate the possible influences of serum concentrations of CITA and NDCITA on the efficacy and tolerability of CITA in MDD patients.
Methods
Subjects and treatment
The subjects of this study (n=46) were part of a previously reported study to investigate the effects of ABCB1 C3435T polymorphism on susceptibility to depression and the clinical response to CITA [13]. The study was conducted in a prospective and open-label style between 2006 and 2008 at the Gazi University Medical Faculty Hospital, Ankara, Turkey. Patients who applied to the psychiatric outpatient clinic and met the Diagnostic and Statistical Manual of Mental Disorders Fourth Edition (DSM-IV) criteria for MDD were included in the study. The exclusion criteria included clinically significant laboratory abnormalities; major physical and neurological illnesses; psychiatric disorders except for major depression; substance abuse and dependence, except for nicotine dependence; pregnancy; breastfeeding; using any antidepressant drug within the previous 12 months; being younger than 18 and older than 65; and treatment with concomitant psychotropic drugs, except for hydroxyzine for insomnia. All participants were biologically unrelated Turkish subjects and were recruited from the same geographical area (Ankara region of Turkey). The study was approved by the Human Ethics Committee of the Gazi University Medical Faculty, according to the 2004 Helsinki Declaration (approval number, 271; date, 25.09.2006). Patients were informed about the study and they gave their written informed consent.
CITA was administered at an initial dose of 20 mg/day, with the possibility of adjustment up to 30 mg/day according to the therapeutic response. All patients affirmed an intake of CITA once a day between 8:00 and 9:00 p.m. every day during the study. Blood samples were taken from 8:00–9:00 a.m. (12 hours after the drug administration) at the 4th week for the measurement of steady-state drug concentrations. Protocol visits were completed at baseline and at the 1st, 2nd, 4th, and 6th weeks. The therapeutic response to CITA was evaluated by psychiatrists using the 17-item Hamilton Rating Scale for Depression (HDRS17) at baseline and at the 1st, 2nd, 4th, and 6th weeks. The responders were defined as patients who demonstrated a 50% reduction from the baseline HDRS17 total score at the 6th week. Tolerability assessments were conducted based on a query of side effects (dry mouth, nausea, constipation, palpitation, dizziness, increased perspiration, itching, headache, tremor, blurred vision, difficulty sleeping, sleeping too much, loss of sexual desire, poor concentration) at the 1st, 2nd, and 6th weeks by psychiatrists.
Analytical methods
Venous blood samples were drawn (10 mL) into the tubes that did not contain any additives, were centrifuged for 10 minutes at 3000 g immediately, and serum samples were stored at -20°C.
The serum concentrations of CITA and NDCITA were analyzed by an isocratic reversed-phase high-performance liquid chromatography (HPLC) method with ultraviolet detection (Agilent LC Systems, Series 1100, Agilent Technologies Inc., Santa Clara, CA, USA) as previously described [14]. The lowest limit of quantification was 5.0 ng/mL for both analytes. Coefficients of accuracy and precision for citalopram and NDCITA were 6.6, 92.1, 6.5, and 89.5%, respectively.
Statistical analysis
Statistical analysis focused on the comparison of three groups, which were defined according to the median CITA, NDCITA, and the sum of the CITA & NDCITA concentrations of patients. Patients with 25% above the median concentrations were defined as the “high CITA group” (>136.0 ng/mL), the “high NDCITA group” (>73.25 ng/mL), and the “high CITA & NDCITA group” (>197.5 ng/mL); those with 25% below the median concentrations were defined as the “low CITA group” (<86.0 ng/mL), the “low NDCITA group” (<42.75 ng/mL), and the “low CITA & NDCITA group” (<136.3 ng/mL); and those within the reference medians ±25% were defined as the “expected CITA group” (86.0–136.0 ng/mL), the “expected NDCITA group” (73.25–42.75 ng/mL), and the “expected CITA & NDCITA group” (136.3–197.5 ng/mL). The comparison of age, baseline HDRS17 total score, CITA dose, serum CITA, NDCITA, and CITA & NDCITA concentrations among the groups were performed by one-way ANOVA. Male/female ratios among the groups were compared by the chi-squared test. Changes in the groups’ reduction in HDRS17 total scores during the 6th week of the study were analyzed with repeated measures ANOVA. A comparison of the side effects among the groups was performed with Fisher’s exact test. The statistical significance was considered to be p<0.05. Statistical analyses were performed using the SPSS version 18.0 and Graph-Pad Prism version 5.
Results
Of the 54 patients included in the study, 8 patients dropped out due to the adverse effects or refusal of regular visits. Thus, 46 subjects of the 54 enrolled had sufficient data to analyze. The demographic characteristics; mean HDRS17 total scores at baseline; CITA doses (mg/day); serum CITA, NDCITA, and CITA & NDCITA concentrations (ng/mL); and CITA, NDCITA, and CITA & NDCITA concentration/dose ratios (ng/mL/mg/day) as described above are shown in Table 1. No significant differences were found among the groups according to serum concentrations of CITA, NDCITA, and CITA & NDCITA for age (F=0.4866, p=0.6180; F=1.663, p=0.2015; F=1.125, p=0.3341; respectively), sex (χ2=2.008, df=2, p=0.3664; χ2=0.5567, df=2, p=0.7570; χ2=1.231, df=2, p=0.5405; respectively), and the baseline HDRS17 total scores (F=0.3315, p=0.7197; F=1.097, p=0.3430; F=0.8598, p=0.4304; respectively). However, among the three groups of patients, significant differences were found in the serum concentrations and concentration/dose ratios of CITA (F=49.48, p<0.0001; F=39.52, p<0.0001; respectively), NDCITA (F=47.63, p<0.0001; F=35.92, p<0.0001; respectively), and CITA & NDCITA (F=39.84, p<0.0001; F=19.33, p<0.0001; respectively). Although the CITA dose was differed significantly among the groups for serum CITA (F=4.285, p=0.0201) and NDCITA (F=9.620, p=0.0004) concentrations, no significant differences were found among the groups for serum CITA & NDCITA concentrations (F=1.122, p=0.3351).
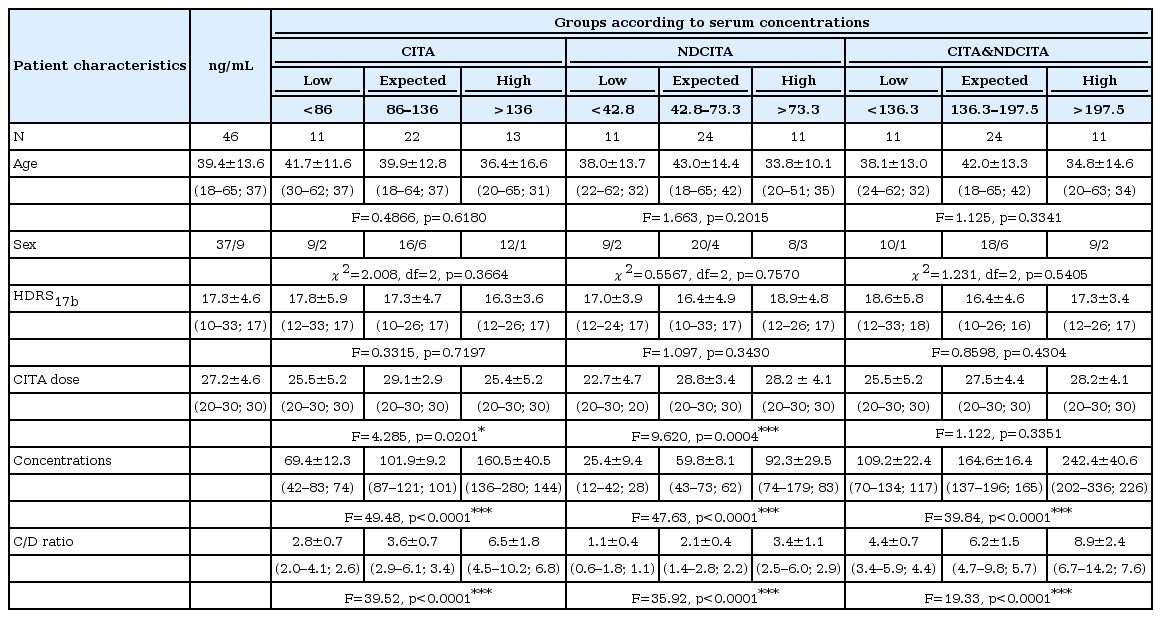
Patient characteristics according to serum CITA, NDCITA, and CITA & NDCITA concentrations
Serum concentrations and efficacy
The efficacy of CITA was evaluated by HDRS17 total scores for patients with low, expected, and high serum CITA and NDCITA concentrations for 6 weeks. Although the HDRS17 total scores of patients did not differ significantly among the groups for serum CITA concentrations (F=1.576, p=0.152) (Table 2), patients with high NDCITA and CITA & NDCITA concentrations showed a more significant reduction in HDRS17 total scores during the 6 week than did patients with expected and low serum NDCITA and CITA & NDCITA concentrations (F=3.717, p=0.002; F=3.523, p=0.003, respectively) (Table 2).

HDRS17 scores of patients during the study according to serum CITA, NDCITA, and CITA & NDCITA concentrations
Serum concentrations and tolerability
The tolerability of CITA was examined for patients with low, expected and high serum CITA, NDCITA, and CITA & NDCITA concentrations in reporters and non-reporters of side effects. The low, expected, and high serum concentration groups did not differ with respect to the reported side effects for CITA, NDCITA, and CITA & NDCITA concentrations (Table 3).
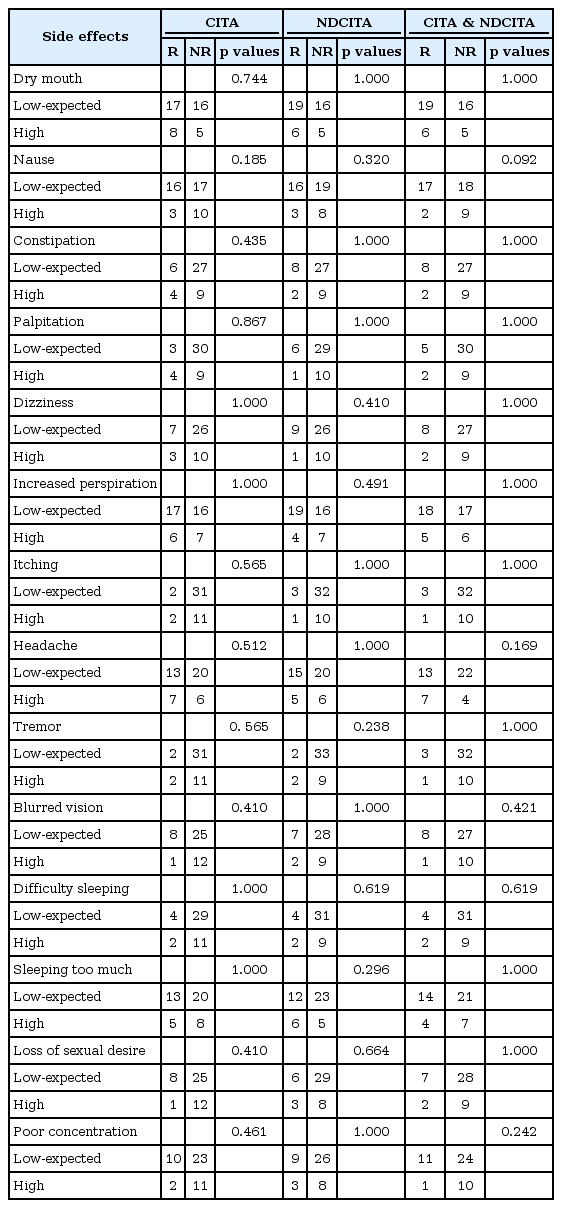
Side effects of patients during the study according to serum CITA, NDCITA, and CITA & NDCITA concentrations
Discussion
The present results provide the first evidence that the HDRS17 total scores of the patients with high NDCITA concentrations show a more significant reduction compared to the patients with expected and high serum NDCITA concentrations in MDD patients. However, HDRS17 total scores were not associated with serum CITA concentrations. In addition, no correlation was observed between the serum CITA and serum NDCITA concentrations and adverse reactions.
Previous studies have revealed that the steady-state concentrations of CITA predict the antidepressant response of CITA in MDD patients. Although Ostad Haji et al. suggested that achieving approximately 50 ng/mL serum concentrations for CITA on day 7 is necessary for clinical improvement [11,12], an earlier study concluded that the lower limit of effective serum CITA concentrations was 30 ng/mL after day 7 [10]. In contrast to previous results, in this study, only 1 patient had a serum CITA concentration below 50 ng/mL (42 ng/mL), and we did not observe any relationship between the efficacy and serum CITA concentrations according to the patient groups with low (<86.0 ng/mL), expected (86.0–136.0 ng/mL), and high (>136.0 ng/mL) CITA concentrations at the 4th week. We measured relatively higher median serum CITA concentrations (101 ng/mL) compared to earlier reports than in the reports of previous results [11,12,15-17]. The difference in the serum CITA concentrations of this study might be explained in part by the sampling time for citalopram, taking comedications and CYP2C19 polymorphisms. Because citalopram is extensively metabolized by CYP2C19 [18], CYP2C19 polymorphisms, and the use of CYP2C19 inhibitors, especially proton pump inhibitors could increase the citalopram concentrations [19,20].
This is one of the first studies to exhibit a potential relationship between the efficacy of CITA and serum NDCITA concentrations. We found a more significant reduction in the HDRS17 total scores in patients with high NDCITA concentrations (>73.25 ng/mL) than in patients with expected (73.25–42.75 ng/mL) and low serum NDCITA concentrations (<42.75 ng/mL). Although the previous clinical studies ignored the contribution of NDCITA to the antidepressant effect of CITA, the human serotonin transporter affinity of NDCITA [21] with a long plasma half-life (50 hours) emphasizes the possible contribution to the effect especially at high serum concentrations as seen in this study. Further studies are needed to examine the potential relationship between the serum NDCITA concentrations and the antidepressant effect of CITA in larger clinical samples.
As the therapeutic drug monitoring (TDM) studies have focused only on evaluating the relevance of serum concentrations on therapeutic response, the tolerability-serum concentration relationship has been ignored [22]. In the present study, we also evaluated whether the serum CITA and NDCITA concentrations were associated with the side effects of CITA. No associations were observed between the serum CITA and NDCITA concentrations and any side effects. Although our findings show that there is the lack of a relationship between the serum CITA and NDCITA concentrations and the tolerability for CITA, the sample size of the study is not large enough to examine whether the tolerability-serum concentration interaction exists decisively.
This study had some limitations regarding the sample size and the time of the blood sampling. The lack of CYP2C19 genotyping is a major limitation of the study. The number of patients was relatively small for examining the relationship between serum concentrations and efficacy and tolerability. In addition, the blood samples for the measurements of serum concentrations were drawn at steady-state but did not represent trough concentrations.
Despite these limitations, the present study showed that serum concentrations of NDCITA have an impact on the efficacy but not on the tolerability of CITA. In addition, serum concentrations of CITA were not associated with either efficacy or with the tolerability of the drug. The results of this study provide the first evidence for the potential contribution of NDCITA to the antidepressant effect of CITA at higher serum concentrations of the drug. The studies in larger clinical samples, at multiple dose levels, and also including trough serum concentrations of CITA and NDCITA are required to confirm whether the impact of serum CITA and NDCITA concentrations on the efficacy and tolerability of CITA.
Acknowledgements
This study was supported by grants from the Scientific Research Projects of Gazi University (Project No: 01/2004-44).