Pre-Mild Cognitive Impairment: Can Visual Memory Predict Who Rapidly Convert to Mild Cognitive Impairment?
Article information
Abstract
Objective
Little is known about the natural course of pre-mild cognitive impairment (pre-MCI) and predictors to MCI. We followed-up individuals with pre-MCI and cognitively normal (CN) elders to identify neuropsychological predictors for rapid conversion to MCI.
Methods
Seventy-seven individuals with pre-MCI and 180 CN elders were recruited from the pool of individuals registered at the National Research Center for Dementia in Gwangju, Korea. We followed-up with them after a mean of 14±2.29 months. All participants underwent comprehensive clinical and neuropsychological assessment. Logistic regression analysis examined the ability of neuropsychological tests to predict conversions to MCI.
Results
Of 257 participants, 142 (55.3%) were eligible for the follow-up study (102 CN, 40 pre-MCI). Logistic regression revealed that spatial delayed recall significantly predicted the conversion from pre-MCI to MCI. In CN, copy for a complex figure significantly predicted the conversion to pre-MCI or MCI.
Conclusion
Our findings indicated that spatial delayed recall was associated with rapid conversion from pre-MCI to MCI. Spatial organization and planning, measured by complex figure reproduction, were associated with rapid conversion from CN to pre-MCI or MCI. Our study suggests that inclusion of visuospatial reproduction and memory using a complex figure further facilitates early detection of MCI.
INTRODUCTION
Over the last decade, the focus of the diagnostic framework for Alzheimer’s disease (AD) has been gradually shifted toward very early stages, such as the preclinical asymptomatic state [1]. A new disease model of AD stresses risk factor assessment, early detection, and intervention [2]. In this context, mild cognitive impairment (MCI), which is known as a precursor of dementia including AD [3], has been a research focus. In particular, considerable number of recent studies provided progression rates from MCI to AD dementia and aimed to improve the accuracy of predictors of such conversion [4-14]. However, individuals with MCI already experience disturbed cognitive function, and although it is generally very mild, it can be also challenging for these individuals as well as their family. Therefore, reliable prediction markers for MCI would help to accelerate intervention.
Surprisingly fewer studies, however, have focused on predictors of MCI than on predictors of AD. Studies on MCI prediction have shown inconsistent results. For example, some of the studies reported that poor episodic memory performance was a risk factor for developing MCI [15,16], but one recent study reported that poor executive function, not episodic memory, at baseline was associated with a future MCI diagnosis [17]. Additionally, there were other studies that demonstrated that poor everyday functioning at baseline was associated with a future MCI diagnosis, even after adjusting for cognitive abilities [18,19]. Therefore, effective neuropsychological markers for predicting MCI remain unclear.
Pre-mild cognitive impairment (pre-MCI) is an intermediate state between cognitively normal (CN) and MCI [3,20]. Individuals with pre-MCI exhibit mild functional changes measured by Clinical Dementia Rating (CDR) scale, but their objective cognitive change is so subtle that it fall within normal range and does not meet MCI criteria. The label of “pre-MCI” is one of various terms indicating the status between normal aging and MCI, for example, subjective cognitive impairment (SCI) [21], or subjective cognitive concerns [22]. Among such terms pre-MCI could be the most later stage in the continuum between CN and MCI. However, whether pre-MCI can be considered as a precursor to MCI or not remained unclear. For early detection and effective treatment of AD and MCI, a clinical course for pre-MCI would be of a large interest. In spite of the importance of pre-MCI in clinical and research settings, little is known about the natural course of pre-MCI and predictors of the progression to subsequent decline, such as MCI or dementia.
Only two studies performed followed-up approach for pre-MCI [3,23]. One longitudinal study reported higher rates of progression to MCI or AD than to CN, suggesting that pre-MCI is a true precursor to MCI [23]. However, these studies examined dementia predictors, not MCI predictors. It is necessary to investigate baseline neuropsychological characteristics of individuals with pre-MCI who will progress to MCI and those of individuals who will remain stable.
In the current study, therefore, we prospectively followed individuals with pre-MCI and CN elders for about one year. We investigated the conversion rate from pre-MCI to MCI and compared with that of CN. We also aimed to identify clinical and neuropsychological prediction markers for rapid conversion to MCI.
METHODS
Participants
At baseline, 77 individuals with pre-MCI and 180 CN elderly individuals were recruited from a pool of individuals registered at the National Research Center for Dementia in Gwangju, Korea, from January 2014 to July 2015. We followed-up with them after a mean of 14±2.29 months. Detailed information regarding participants at baseline has been reported previously [20]. Briefly, individuals with pre-MCI were diagnosed as such if their CDR score was 0.5 (memory subdomain is 0.5), and their neuropsychological performance was within a normal range, that is, all test z-scores were above -1.5 according to age-, education-, and gender-specific norms. According to Morris et al, the global CDR score of 0.5 includes three different groups: 1) those who show impairment in memory and at least 3 of the 5 remaining CDR domains [CDR 0.5/Dementia of Alzheimer Type (DAT)], 2) those who show impairment in memory and 2 or fewer remaining CDR domains (CDR 0.5/incipient DAT), and 3) those who show impairment in memory only or the impairment is doubtful (CDR 0.5/uncertain dementia) [24]. Our participants with pre-MCI were all in the category of the third one. All CN participants had a CDR score of 0 and neuropsychological performance within a normal range. Exclusion criteria for all participants were as follows: 1) evidence of focal brain lesions on MRI, including lacunes and white matter hyperintensity lesions of grade 2 or more, according to the Fazeka scale [25]; 2) illiteracy; 3) severe visual or hearing loss; 4) any type of dementia or MCI; 5) any significant neurologic, medical, or psychiatric disorders that could affect mental function; and 6) current use of psychoactive medications.
Baseline clinical and neuropsychological assessment
All participants were examined with a clinical interview, which included an assessment of CDR. The CDR is a widely used measure of dementia severity that provides 5 levels of impairment (staging 0, 0.5, 1, 2, or 3) and has 6 subdomains (memory, orientation, judgment and problem solving, function in community affairs, home and hobbies, and personal care) [26,27]. The CDR sum of boxes (SOB) score is calculated with possible scores ranging from 0 to 18. Medical history, including stroke or family history of dementia, and instrumental activities of daily living (IADL) [28] were assessed. The Korean version of the Dementia Screening Questionnaire (DSQ) [29], a self-report format of cognitive screening tool, was also administered. It consists of 15 items with a 3-point scale regarding general cognitive changes in everyday life over the past 1 year. The cutoff score was suggested to be 6 [29]. In addition, the Subjective Memory Complaints (SMC) [30] and the Geriatric Depression Scale (GDS) [31] were also administered in a self-report format.
A comprehensive neuropsychological assessment was performed using the Seoul Neuropsychological Screening Battery (SNSB), which covers five cognitive domains [32]. The attention domain was assessed using a forward and backward digit span test. The language domain was assessed using a shortened version of the Boston Naming Test (BNT; 15 item version, Form A). The visuospatial domain was assessed using the copying test from the Rey Complex Figure Test (RCFT copy). The memory domain was assessed by six measures, including the Seoul Verbal Learning Test (SVLT) immediate recall (SVLT_imm), 20-minute delayed recall (SVLT_delayed), and yes-no recognition (SVLT_rec), RCFT immediate recall (RCFT_imm), 20-minute delayed recall (RCFT_delayed), and yes-no recognition (RCFT_rec). The frontal/executive domain was assessed using category fluency tests (animal and supermarket lists), a phonemic fluency test (total score for ‘ㄱ’ /g/, ‘ㅅ’ /s/, and ‘O’ /y/), the Stroop test (color naming in colorword incongruent condition), and Trail Making Tests (TMT) A and B. The global cognition was assessed using the Mini Mental State Examination (MMSE).
Follow-up assessment
Each participant underwent the same clinical interview as they did in the baseline evaluation, including the CDR designation and neuropsychological assessment procedure. MCI was diagnosed according to consensus criteria [33]: 1) the person is neither normal nor demented; 2) there is evidence of cognitive deterioration shown by either decline measured objectively over time and/or a subjective report of decline by the self and/or an informant, in conjunction with objective cognitive deficits; and 3) activities of daily living are preserved, and complex instrumental functions are either intact or minimally impaired. In terms of the criteria for 2), objective cognitive change was identified by the neuropsychological performance z-scores (1.5 and below) mentioned above. The final clinical diagnosis was made after reviewing all the available information in the consensus case conferences.
Statistical analysis
The pre-MCI group was divided into 2 subgroups according to diagnosis at the time of the second evaluation: those who converted to MCI (pre-MCIcon), and those who did not convert to MCI (pre-MCInoncon). All individuals who were stable or reverted to CN were included in the pre-MCInoncon group. The CN group was also divided into 2 subgroups according to diagnosis at the time of the second evaluation: those who converted to MCI or pre-MCI (CNcon), and those who were stable CN (CNnoncon). Demographic and clinical data were compared between groups using separate oneway analyses of variance (ANOVA) and χ2 tests for continuous and categorical variables, respectively. For neuropsychological performance, z-scores according to age-, education-, and gender-specific norms were compared between groups using oneway ANOVAs. Multivariable logistic regression analysis with stepwise selection was performed in order to examine the ability of neuropsychological tests to predict conversions. These analyses were performed using SPSS version 21.0 for Windows (IBM Corp., Armonk, NY, USA); p-values less than 0.05 were considered significant.
Ethical approval
The Institutional Review Board of Chosun University Hospital approved the present study (CHOSUN 2013-12-018-053). Written informed consent was obtained from each participant.
RESULTS
Participant characteristics
Of 257 participants, 142 (55.3%) were eligible for the follow-up study (102 CN, 40 pre-MCI). The reasons for dropout were: loss of contact (n=19), refusal to participate (n=63), poor medical condition (n=19), and other (n=14). The follow-up rate was 56.7% for CN and 51.9% for pre-MCI, and there were no group differences in the follow-up rates (Figure 1). When we compared baseline characteristics of subjects who completed follow-up (FU) and those who did not FU (no FU), men (65.8%) followed up more than women (50.6%). Digit span forward (p=0.039) and MMSE score (p=0.003) in FU were higher than in no FU. There were no differences between these two groups by age, education, GDS, SMC, ADL, DSQ, and other NP scores.
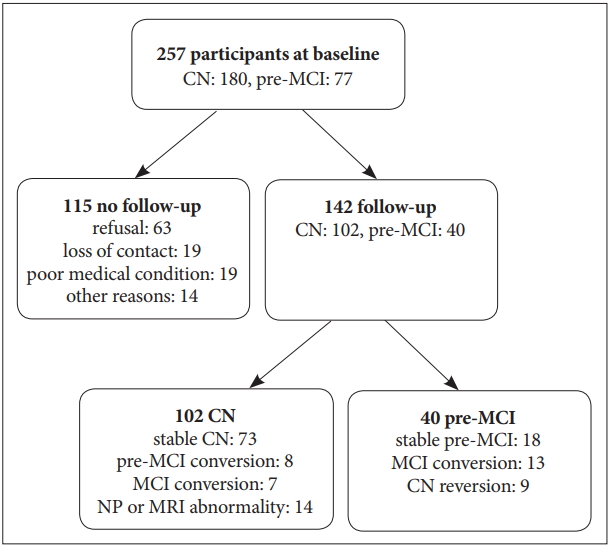
Flow chart of follow-up study. CN: cognitively normal, pre-MCI: pre-mild cognitive impairment, MCI: mild cognitive impairment.
In the pre-MCI group, 13 (33%) converted to MCI and were labeled pre-MCIcon. In contrast, 18 (45%) were stable pre-MCI and 9 (23%) were reverted to CN, and they were labeled pre-MCInoncon. In the CN group, among those who completed follow-up assessment, 7 (7%) and 8 (8%) converted to MCI and pre-MCI, respectively. These were labeled as CNcon. In contrast, 73 (73%) were stable CN and were labeled CNnoncon. Significantly more individuals in the pre-MCI group converted to MCI than in CN group (χ2df=1=15.61, p<0.001). Individuals (n=14, 14%) who were stable with a CDR score of 0 but showed an MRI abnormality (evidence of focal brain lesions on MRI, including lacunes and white matter hyperintensity lesions of grade 2 or more) or a cognitive abnormality (test z-scores were below -1.5 according to age-, education-, and gender-specific norms) at the 2nd evaluation were excluded from the further analysis.
Baseline characteristics of converters and non-converters
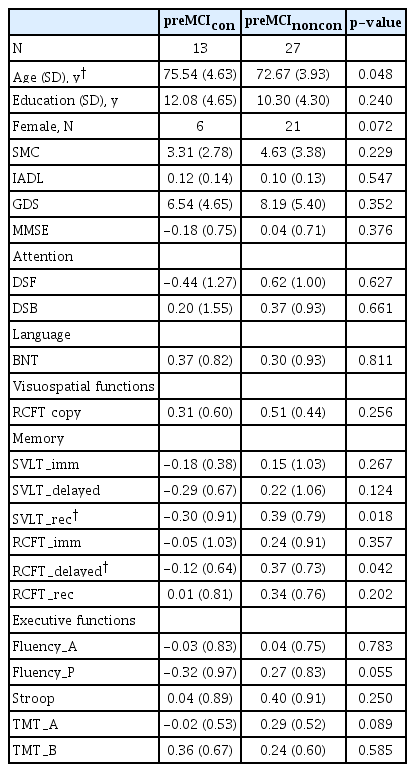
In the pre-MCI group, the converters were older (p=0.048), and showed lower SVLT_rec score (p=0.018), and lower RCFT _delayed score (p=0.042) (Table 1) than those in pre-MCInoncon. In the CN group, the converters’ education levels were lower (p=0.018) and DSQ scores were higher (p=0.013) than those in CNnoncon. The converters also showed lower BNT scores (p=0.035), RCFT copy scores (p=0.001), and marginally lower RCFT_rec scores (p=0.059) (Table 2). In both groups, there were no significant differences between converters and non-converters in SMC, GDS, IADL, and rest of the neuropsychological tests, including MMSE.

Prediction models for the conversion to MCI
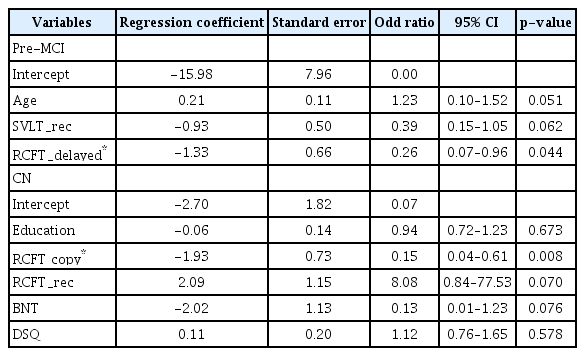
Given the significantly different scores that resulted from the ANOVA tests, multivariable logistic regression analysis with stepwise selection was performed to examine the ability of such scores to predict conversions. In the pre-MCI group, only the RCFT_delayed score significantly predicted the conversion to MCI (OR=0.26; 95% CI, 0.07–0.96; p=0.044) (Table 3). In the CN group, only the RCFT copy score (OR=0.15; 95% CI, 0.04–0.61; p=0.008) significantly predicted the conversion to pre-MCI or MCI.
Logistic regression model for conversion prediction
DISCUSSION
The identification of individuals in very early stages of the AD spectrum is a high priority in both research and clinical settings. We prospectively followed pre-MCI and CN older adults who were all recruited from the community. We compared baseline characteristics of neuropsychological measures between converters and non-converters at a one-year follow-up. Our study revealed that although objective neuropsychological performance is within normal, individuals with pre-MCI were more likely to convert to MCI than CN elderly individuals. It also suggested that RCFT copy and delayed recall performance acted as prognostic markers for rapid conversion to MCI or pre-MCI.
Among individuals with pre-MCI, 33% were converted to MCI at a one-year follow-up. Among CN individuals, 7% were converted to MCI at a one-year follow-up, which is largely consistent with the findings of previous studies that used community-based recruitment [15-17,22]. Eight percent of CN were converted to pre-MCI, which is also similar to the findings in previous reports [23]. Compared to the CN conversion rate, individuals with pre-MCI were significantly more liked to convert. Very few studies have focused on the clinical course of pre-MCI. Only two studies have explored the clinical course of pre-MCI longitudinally [3,23]. Our results largely correspond with these previous studies, for example, similar conversion rates (e.g., Duara et al. [23] reported 28.6% progressed to MCI) and significantly more converted to MCI than CN. In terms of objective neuropsychological tests, individuals with CN and pre-MCI were all within a normal range of performance, but their CDR scores were 0 and 0.5, respectively. As previous studies pointed out, CDR can detect intraindividual cognitive changes [3,23], and therefore, it may improve sensitivity for detecting very early cognitive changes, even when objective cognitive function is within a normal limit [3,20]. Along with previous evidence, the present results also support that identification of pre-MCI using the CDR system is helpful for the early detection of cognitive changes in a longitudinal perspective.
Our findings that pre-MCI converters were older and showed lower levels of verbal and spatial memory performance than non-converters at baseline suggest age and memory measure are sensitive to early changes in the AD spectrum. This is not surprising, because old age and poor memory function are well-known risk factors for dementia in both CN and MCI individuals. Further logistic regression analysis indicated that pre-MCI elderly individuals with higher performances of spatial memory (i.e., RCFT_delayed score) had decreased probability of conversion to MCI from pre-MCI. Specifically, pre-MCI elderly individuals with higher RCFT_delayed scores had a 3.8 times higher probability to be stable pre-MCI than pre-MCI elderly individuals with lower RCFT_delayed scores. RCFT is a very complex figure and consists of 18 units. We speculate that RCFT delayed recall with an interval of 20 minutes would be much more difficult than word list delayed recall. Because the pre-MCI stage falls within a relatively earlier phase in the AD spectrum, memory measure with higher difficulty level might provide a more efficient assessment of whether pre-MCI individuals would progress to MCI or remain stable. However, there are few studies reporting spatial memory performance as a risk factor. One possible reason might be that a spatial memory measure was not included in many of previous studies. For example, several recent conversion studies [8,12,13] had adopted only verbal memory measures.
On the other hand, CN converters showed lower levels of education, lower abilities of naming and RCFT copy, and more functional changes in everyday life than the non-converters. Among these variables, our logistic regression analysis indicated that CN elderly individuals with higher RCFT copy scores had decreased probability of conversion to pre-MCI or MCI from CN. Specifically, CN elderly individuals with higher RCFT copy scores had a 6.7 times higher probability to be stable CN than CN elderly individuals with lower RCFT copy scores. RCFT copy simply consists of reproducing a complex figure. It is a widely used neuropsychological tool for the assessment of visuospatial constructional ability. However, because of the high complexity of the task figure, it also involves cognitive processes regarding strategic planning and organization of a fractional figure into a meaningful perceptual one at the time of drawing the complex figure [34]. Thus, RCFT has the potential to be a useful method for the assessment of frontal lobe or executive function, as well as visuospatial ability. In fact, some previous studies have reported that RCFT score was correlated with conventional executive function measures and that the score could differentiate subjects with either no, mild, or severe executive dysfunction [35,36]. Therefore, the association between RCFT copy score and clinical progression in our study may reflect that alteration in executive function (i.e., organization and planning) can be a very early marker of MCI. This interpretation of the present study corresponds with the results of previous studies, which reported that poor executive function was associated with developing MCI or functional decline [17,37]. In addition, a very early cognitive sign in the course of AD spectrum might be a poor executive function [20].
Some limitations and future directions should be discussed. First, the dropout rate was considerable during the follow-up process, and, consequently, the final sample size was small. Participants in the current study were all recruited from community. This study included individuals with CN and pre-MCI who had essentially normal performances on objective neuropsychological tests. Therefore, there were some individuals who had no need for further visits for clinical and cognitive evaluation. Future studies based on larger sample size, especially for pre-MCI group, are needed. Second, the present study has a relatively short follow-up period. Therefore, our results should be interpreted with caution. Predictors discussed in our study were limited to prediction of “rapid” conversion. A longer follow-up period would provide broader perspective. Third, our results were based on clinical and neuropsychological factors only. Inclusion of biological markers such as the apolipoprotein E (APOE) genotype or conduction of a neuroimaging study may increase predictive power in addition to allowing analysis of neuropsychological markers. Although biomarkers have the potential to show good prediction information, biomarker studies are not always feasible in clinical situations. Our study’s focus on neuropsychological tests allows it to be more easily applicable to general clinical settings. Lastly, future conversion studies are advised to include sensitive measures of visuospatial reproduction and memory for complex figures in order to detect very early change in the AD spectrum.
In conclusion, our findings indicated that individuals with pre-MCI are more likely to convert to MCI compared to CN individuals. Performance of spatial delayed recall at baseline was especially associated with rapid conversion from pre-MCI to MCI. Moreover, spatial organization and planning, measured by reproduction of a complex figure, were associated with rapid conversion from CN to pre-MCI or MCI. Our study suggests that inclusion of measures of visuospatial reproduction and memory using a complex figure further facilitates early detection of MCI.
Acknowledgements
This research was supported by a Basic Science Research Program through the National Research Foundation of Korea (NRF), funded by the Ministry of Education (NRF-2017R1D1A1B03028377), and it was supported by the Brain Research Program through the NRF funded by the Ministry of Science, ICT & Future Planning (NRF-2014M3C7A1046041).