Regional Quantitative Magnetic Resonance Imaging Data Improve Screening Accuracy of Subjective Memory Complaints and Informant Reports of Cognitive Decline
Article information

Abstract
Objective
We investigated whether the addition of Alzheimer’s disease-signature region cortical thickness (AD-Ct) and hippocampal volume (Hv) obtained from brain MRI to subjective memory complaints and informant-reports of cognitive decline enhances the screening accuracy for cognitive disorders in a memory clinic setting.
Methods
120 participants (40 cognitively normal, 40 MCI, 40 dementia) underwent clinical evaluation, neuropsychological assessment, and brain MRI. The Subjective Memory Complaints Questionnaire (SMCQ) and Seoul Informant-Report Questionnaire for Dementia (SIRQD) were applied to assess subjective memory complaints and informant-reports of cognitive decline respectively. Logistic regression and ROC curve analyses were conducted to compare the screening abilities of SMCQ+SIRQD, SMCQ+SIRQD+Hv, and SMCQ+SIRQD+AD-Ct models for cognitive disorders.
Results
SMCQ+SIRQD+Hv model indicated better screening accuracy for MCI and overall cognitive disorder (CDall) than SMCQ+ SIRQD model. SMCQ+SIRQD+AD-Ct model had superior screening accuracy for dementia in comparison to SMCQ+SIRQD model. ROC curve analyses revealed that SMCQ+SIRQD+Hv model had the greatest area under the curve (AUC) for screening MCI and CDall (AUC: 0.941 and 0.957), while SMCQ+SIRQD+AD-Ct model had the greatest AUC for screening dementia (AUC: 0.966).
Conclusion
Our results suggest that the addition of regional quantitative MRI data enhances the screening ability of subjective memory complaints and informant-reports of cognitive decline for MCI and dementia.
INTRODUCTION
Subjective memory complaints and informant reports of cognitive decline are routinely checked in the memory clinic setting, and both are repeatedly reported as important predictors of cognitive disorders including mild cognitive impairment (MCI) and dementia [1-8]. Despite the evidence, limitations still exist in predicting cognitive disorder only from subjective memory complaints and informant reports of cognitive decline.
Brain magnetic resonance imagining (MRI) is commonly performed in the memory clinic for the differential diagnosis of cognitive disorders. Certain findings on brain MRI are also known to be useful in the screening of cognitive disorders or predicting switch to dementia from mild cognitive impairment [9-11]. Hippocampal atrophy is frequently observed not only in MCI [11,12] and Alzheimer’s disease (AD) dementia [12-15], but also in vascular and fronto-temporal dementia (FTD) [9,10,16]. Cortical atrophy in different brain regions is common in various cognitive disorders including MCI, AD dementia, Parkinson’s disease dementia, and FTD [11,12,17-20]. Moreover, the severity of hippocampal or cortical atrophy are reported to have a clear relationship with the severity of cognitive decline [12-15]. However, very few studies investigated the usefulness of quantitative information from brain MRI in improving the screening ability of subjective memory complaints and informant reports of cognitive decline for cognitive disorders.
The aim of this study was to investigate whether the supplementation of hippocampal volume (Hv) and AD-signature region cortical thickness (AD-Ct) data obtained from the brain MRI to subjective memory complaints and informant reports of cognitive decline can enhance the screening ability for cognitive disorders in a memory clinic setting.
METHODS
Participants
One hundred and twenty individuals participated in this study at the dementia clinic of Seoul National University Hospital. All participants were aged between 65 to 80 years, divided into age-, sex-, and education-matched groups of 40 cognitively normal (CN) individuals, 40 with mild cognitive impairment (MCI), and 40 with dementia (AD).
The criteria of the 4th edition of the Diagnostic and Statistical Manual of Mental Disorders (DSM-IV) [21] was the basis for diagnosis of dementia, and the probable or possible AD criteria of the National Institute of Neurological and Communication Disorders and Stroke/Alzheimer’s Disease and Related Disorders Association (NINCDS-ADRDA) [22] for that of AD. A diagnosis of MCI was made according to the Peterson criteria [23].
The following participants were excluded: 1) individuals with major medical, psychiatric, or neurological conditions affecting cognitive function, 2) individuals with communication or behavioral problems making clinical assessment difficult, 3) individuals without a reliable informant, and 4) individuals with limited reading ability of Korean making neuropsychological assessment difficult. Individuals with minor physical conditions, such as mild hearing loss, essential hypertension, and diabetes with no serious complication, were included in this study.
This study was ethically approved by Seoul National University/Seoul National University Hospital Institional Review Board (IRB No. H-2006-101-1132).
Clinical and neuropsychological assessment
All participants were assessed by psychiatrists with advanced training in dementia research with the Korean version of the Consortium to Establish a Registry for Alzheimer’s Disease Assessment Packet (CERAD-K) clinical assessment battery [24].
The cognitive function of participants was tested by trained clinical psychologists using the CERAD-K neuropsychological battery [25]. The CERAD-K neuropsychological battery consists of the 15-item Boston Naming Test, Word List Memory, Word List Recall, Word List Recognition, Constructional Praxis, Constructional Recall, and Mini-Mental State Examination (MMSE).
A panel of four or more psychiatrists, experts in dementia research verified the diagnosis through integrating examination and discussion of all available raw data.
Assessment of subjective memory complaints and informant reports of cognitive decline
Subjective memory complaints of all participants were measured by the Subjective Memory Complaints Questionnaire (SMCQ) [5] and informant reports of cognitive decline were assessed using the Seoul Informant Report Questionnaire for Dementia (SIRQD) [26]. The SMCQ is a self-reported questionnaire for elderly to report their memory problems in general and in daily living and consists of 14 items with a maximum score of 14. The SMCQ is known for its reasonable reliability and validity showing significant associations with objective cognitive impairment, which was using neuropsychological batteries [5]. The SIRQD is an informant questionnaire which consists of 15 items with a maximum score of 30. The SIRQD takes a short questionnaire and efficiently provides essential information about a patient’s cognitive impairment. It has also been proven to be reliable and valid, and especially shows a low likelihood of false positives and false negatives when applied to the elderly with a wide range of educational level, as found in the Korean elderly population [26].
Acquisition and processing of brain MRI
Brain MRI was obtained via a 3.0-T whole body imaging system (GE VH/I; General Electric, Milwaukee, WI, USA). A three-dimensional T1-weighted SPGR (spoiled gradient recalled echo) sequence was obtained (TR=22 ms, TE=4 ms, slice flip angle=40°). The obtained T1-weighted image was processed by FreeSurfer version 5.3 (http://surfer.nmr.mgh.harvard.edu/), and cortical thickness, intracranial volume, and Hv were calculated in accordance with the Desikan-Killiany atlas [27].
FreeSurfer is a software package used to analyze of neuroimaging data in order to provide an array of algorithms to quantify the functional, connectional, and structural properties of the human brain using T1-weighted input images [28].
AD-Ct was defined as the average cortical thickness of the regions which are known to be related to AD dementia [29] including the rostral medial temporal lobe (localized to the crown of the parahippocampal gyrus in the region of the uncal hippocampal formation, extending into the collateral sulcus), inferior temporal gyrus, temporal pole, angular gyrus, superior frontal gyrus, superior parietal lobule, supramarginal gyrus, posterior cingulate/precuneus, and middle frontal gyrus. Hv was calculated by summing right and left extracted Hv. To correct for differences in intracranial volumes between participants, the value of the hippocampal volume divided by the intracranial volume derived from FreeSurfer was used in statistical analyses.
Statistical analysis
Between-group comparisons of demographic and clinical data were looked into using the two-tailed t-test and χ2 test. Logistic regression analyses were applied to examine the abilities of the SMCQ, SIRQD, SMCQ+SIRQD, SMCQ+SIRQD+ Hv, and SMCQ+SIRQD+AD-Ct models to distinguish between three different cognitive disorder groups, i.e., MCI, dementia, and overall cognitive disorder (CDall) groups (MCI and dementia). Differences of -2 log likelihood (-2LL) were utilized for comparison of the predictive ability of the SMCQ, SIRQD, SMCQ+SIRQD, SMCQ+SIRQD+Hv, and SMCQ+SIRQD+ AD-Ct models. Receiver operating characteristic (ROC) curve analyses were also performed for comparing the screening accuracy of the models and the areas under curve (AUC) of ROC were compared using the method of Hanley and McNeil [30]. The score for the ROC curve analysis was calculated as the sum of each variable multiplied by the respective β coefficient from the logistic regression model.
RESULTS
Demographic and clinical characteristics
There was no significant between-group difference in age, education, or sex. CN had significantly lower SMCQ and SIRQD scores, and higher Hv value than individuals with MCI or dementia. The CN group also had significantly higher AD-Ct value than the dementia group, but no such difference in the AD-Ct value was found between CN and MCI groups (Table 1). Twenty-seven (67.5%) subjects had AD among the dementia patients, and 35 (87.5%) had amnestic MCI among the MCI individuals.
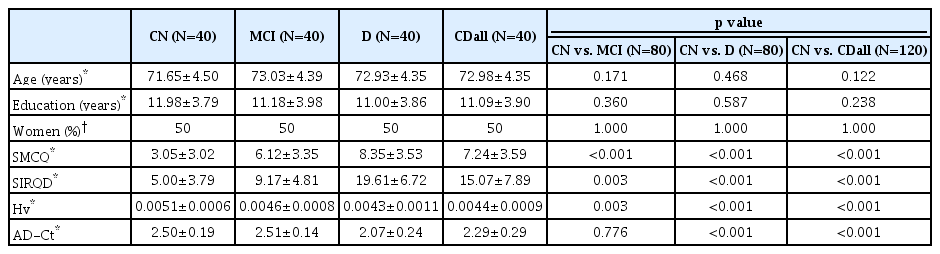
Demographic and clinical characteristics of subjects with brain MRI
Logistic regression analysis and the differences of -2 log likelihood
Compared to the SMCQ only or SIRQD only model, the SMCQ+SIRQD model had superior screening ability for any cognitive disorders (i.e., CDall, MCI, or dementia) (Table 2). The SMCQ+SIRQD+Hv model had better screening accuracy for MCI and CDall, but not for dementia, than the SMCQ+ SIRQD model. In contrast, the SMCQ+SIRQD+AD-Ct model had better ability for screening dementia, but not for screening MCI or CDall, than the SMCQ+SIRQD model (Table 2).
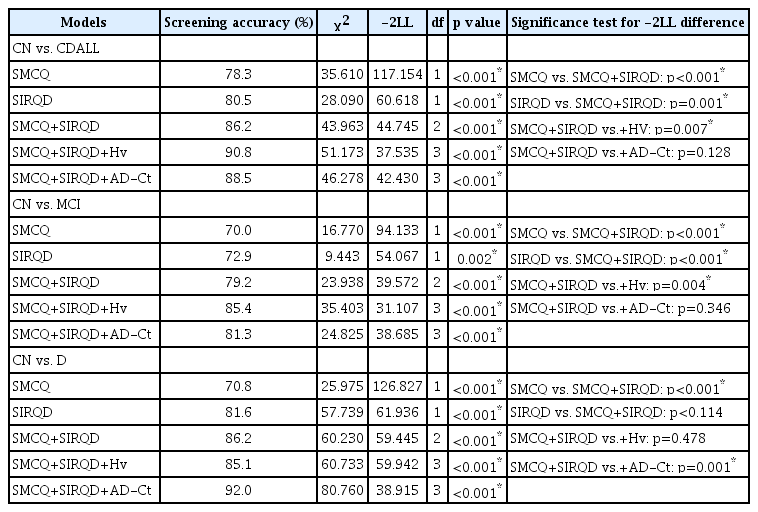
Results obtained from logistic regression analysis designed to compare the screening ability of different models
ROC curve analysis
Similar to the results from the direct comparison of logistic regression models, ROC curve analyses showed that the SMCQ+SIRQD+Hv model had the greatest AUC among models for screening MCI and CDall (AUC: 0.941 and 0.957, respectively), while the SMCQ+SIRQD+AD-Ct model had the greatest AUC among models for screening dementia (AUC: 0.966) (Table 3, Figure 1).
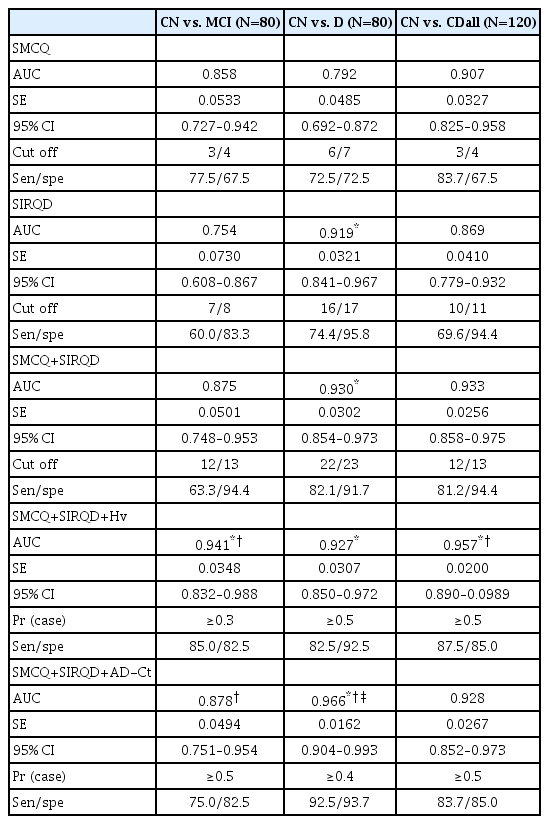
Area under curves (AUC) and SMCQ, SIRQD, SMCQ+SIRQD, SMCQ+SIRQD+Hv, and SMCQ+SIRQD+AD-Ct cut-off scores for MCI, dementia, and overall cognitive impairment
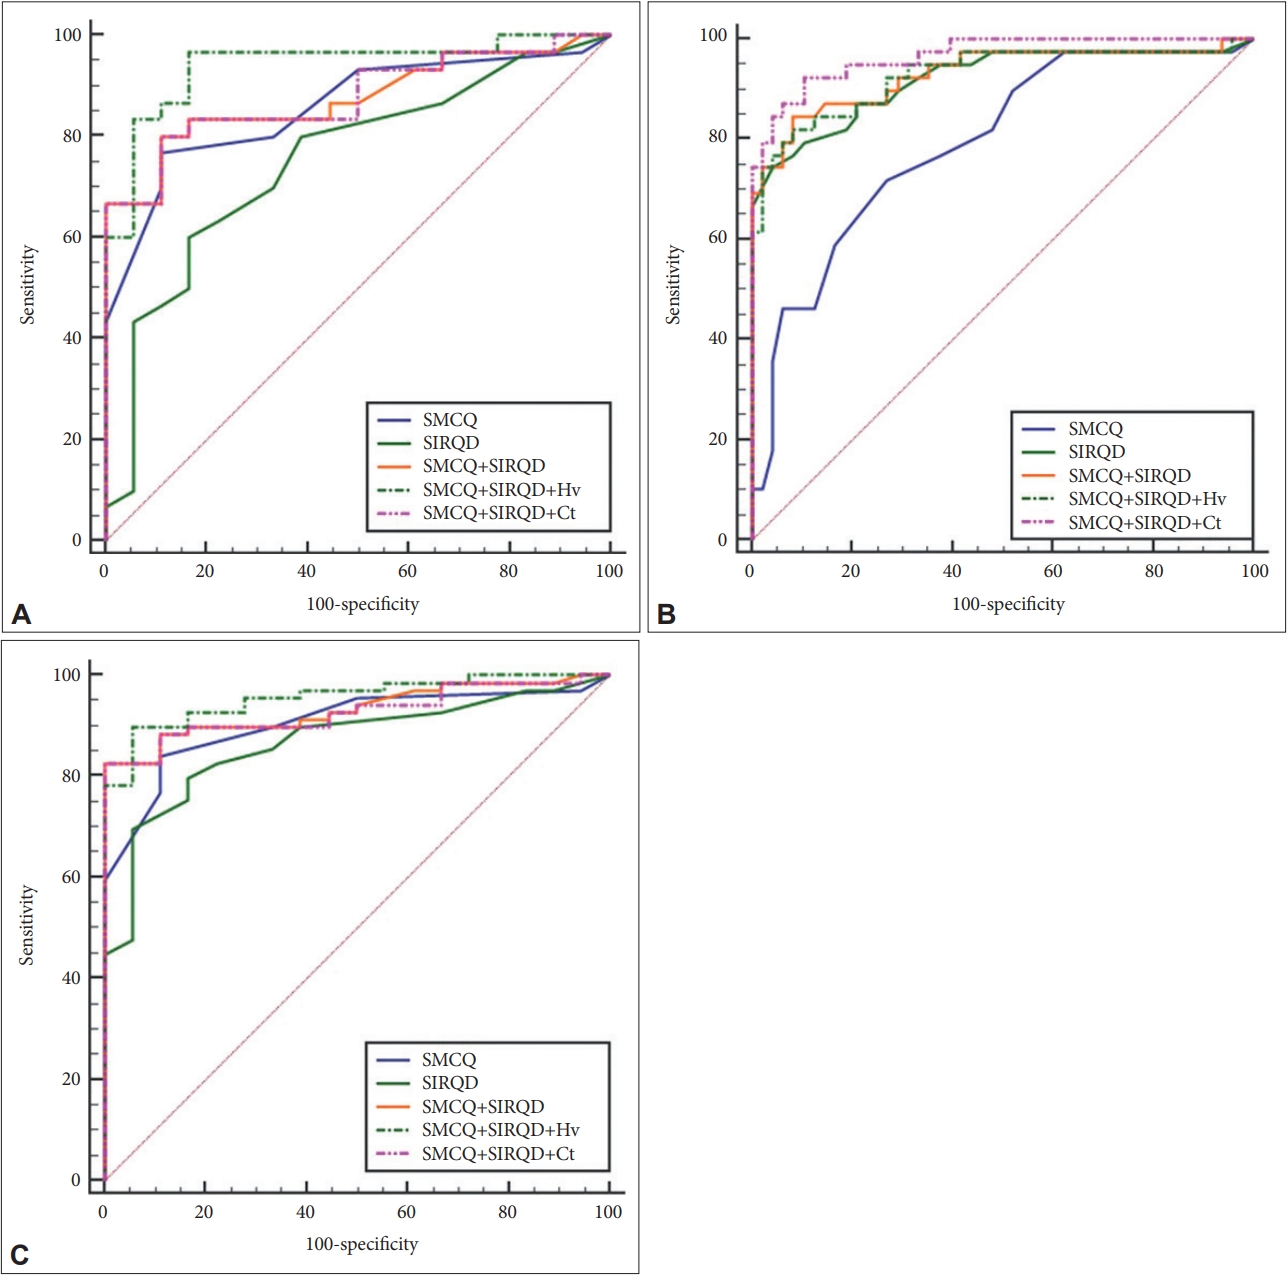
Receiver operating characteristic (ROC) curves for the Subjective Memory Complaints Questionnaire (SMCQ), Seoul Informant Report Questionnaire for Dementia (SIRQD), SIRQD-supplemented SMCQ (SMCQ+SIRQD), adjusted hippocampal volume-supplemented SMCQ+SIRQD (SMCQ+SIRQD+Hv), and AD-signature region cortical thickness-supplemented SMCQ+SIRQD (SMCQ+SIRQD+AD-Ct) in screening for (A) cognitively normal (CN), versus mild cognitive impairment (MCI), (B) CN versus dementia, and (C) CN versus overall cognitive disorder (MCI+dementia).
DISCUSSION
In this study, we investigated whether the supplementation of hippocampal volume and cortical thickness data obtained from brain MRI can improve the predictive ability of subjective memory complaints and informant reports of cognitive decline for cognitive disorders in the memory clinic environment. The results show that adding the Hv data significantly improved the accuracy of the SMCQ plus SIRQD model for screening MCI and CDall, while adding the AD-Ct data to the model improved its accuracy for screening dementia. This study is novel in that it revealed the clear usefulness of quantitative brain MRI data in improving the screening ability of subjective complaints and informant reports. Moreover, our study demonstrated that such combinations of information commonly obtained from memory clinic practice could very accurately predict MCI and dementia (AUC: up to 0.941 for MCI and 0.966 for dementia as shown in Table 3).
The hippocampus is one of the first affected brain areas in AD and its volume reduction is observed even before the clinical dementia stage [29,31,32] or even in the cognitively asymptomatic stage [33]. Several studies also showed that Hv reduction was observed in the pre-dementia stage of non-AD dementing diseases such as frontotemporal lobar degeneration, cerebrovascular disease, Parkinson’s disease, and diffuse Lewy body disease [34-37]. Such earlier reduction in Hv may explain our finding that adding Hv information to SMCQ plus SIRQD significantly enhanced the screening accuracy for MCI and CDall.
Our study showed that supplementation of AD-Ct information significantly improved the dementia screening ability of the SMCQ plus SIRQD model, whereas adding Hv information did not. The resulting SMCQ+SIRQD+AD-Ct model also had the highest accuracy in screening for dementia, while the SMCQ+SIRQD+Hv model showed the highest accuracy for screening MCI and CDall, but not dementia. A reduction in cortical thickness is observed in various dementing neurodegenerative diseases including AD [11,12,17-20,29,38] and is closely related to the worsening of cognitive symptoms [29,39]. Moreover, cortical atrophy reflects later stages of pathological changes (Braak stage IV–V) in AD, while hippocampal atrophy relates to earlier stages (Braak stage II–III) [40]. This may explain our finding of the specific benefit of adding the AD-Ct data to SMCQ and SIRQD in screening for dementia.
Limitations of this study are as followes: 1) as the sample size was not sufficiently large, we did not perform subgroup analyses according to the type or cause of cognitive disorders. 2) this is a cross-sectional study and focused on screening for current cognitive disorders. Further longitudinal studies should be conducted to examine the benefit of adding MRI information in predicting the progression of cognitive disorders. 3) Supplementation of regional quantitative brain MRI information requires a time-consuming MR processing for the quantification of AD-Ct or Hv as well as an additional cost for MRI. Easier and less-time consuming method to obtain quantitative information for cortical or hippocampal atrophy needed to be developed.
In conclusion, our results suggest that the supplementation of regional quantitative MRI information can improve the screening accuracy of subjective memory complaints and informant reports of cognitive decline for cognitive disorders. More specifically, adding hippocampal volume and cortical thickness information appears to enhance screening MCI and dementia, respectively.
Acknowledgements
This study was supported by a grant from the Ministry of Science and ICT, Republic of Korea (Grant No. NRF-2014M3C7A1046042) and a grant of the Korea Health Technology R&D Project through the Korea Health Industry Development Institute (KHIDI) funded by the Ministry of Health & Welfare, Republic of Korea (grant number: HI18C0630 & HI19C0149).
Notes
The authors have no potential conflicts of interest to disclose.
Author Contributions
Conceptualization: Dong Young Lee. Data curation: Dahyun Yi. Formal analysis: Seon Jin Yim. Funding acquisition: Dong Young Lee. Investigation: Seon Jin Yim, Min Soo Byun. Methodology: Dahyun Yi. Project administration: Seon Jin Yim, Min Soo Byun. Resources: Kiyoung Sung. Software: Dahyun Yi, Kiyoung Sung. Supervision: Dong Young Lee. Validation: Seon Jin Yim. Visualization: Kiyoung Sung. Writing—original draft: Seon Jin Yim. Writing—review & editing: Dong Young Lee.