Stress Changes the Spatial Arrangement of Neurons and Glial Cells of Medial Prefrontal Cortex and Sertraline and Curcumin Prevent It
Article information
Abstract
Objective
The present study explored the three-dimensional spatial arrangements of the neurons and glial cells within the medial prefrontal cortex (mPFC) of rats.
Methods
It evaluated the arrangement for differences after stress with or without treatment with curcumin and sertraline using second-order stereology. Orientator method was applied to obtain isotropic uniform random sections of mPFC. The pair correlation g(r) and cross-correlation functions were estimated by counting dipole probes superimposed on histological sections of mPFC.
Results
The mean total volume of neurons and glial cells was 0.80 (0.05) and 0.40 (0.07), respectively in the control group. The corresponding values decreased by 50% in the stressed group. The curve of g(r) for the neurons and glial cells showed a wider gap between the stressed rats' mPFC. Theses indicate a negative correlation (repulsion) between the neurons and glial cells in the stressed rats. Evaluation of the cross-correlation function of the neurons and glial cells also showed a negative correlation in the stressed group. The estimated values of the global degree of order in the spatial point pattern for neurons and glial cells were 0.62 and 0.20 in control and stressed animals, respectively. Curcumin and sertraline protected the spatial arrangements of the cells after stress induction in rats. In addition, the volume of the neurons and glial cells remained unchanged after stress.
Conclusion
Dissociation of the neurons and glial cells can is seen at some places in the stressed rats' cortex. However, the spatial arrangement of the cells was remained unchanged in curcumin+stress and sertraline+stress rats.
INTRODUCTION
Chronic stress induces structural and behavioral impairments. Chronic Variable Stress (CVS) has significant effects on the cellular integrity and function of certain brain areas, most especially the prefrontal cortex (PFC) and hippocampus of rats.1,2,3 Some studies have demonstrated that chronic restraint stress changed the morphological neurons in the medial PFC (mPFC).4,5 Although there are some reports regarding the quantitative aspects of the mPFC, limited experiments have been performed on the spatial arrangement of the nervous system after stress. One study applied spatial pattern analysis carried out by investigation of the K-function which is essentially a combined count-distance measure. The results showed an altered spatial pattern of the neurons and glial cellsin the subjects with major depressive disorder in the PFC.6 Another study used the saucer method and also indicated that spatial arrangement of glial cells around neurons was different in various subregions of the human neocortex.7 The alterations in the spatial arrangement of the glial cells and the neurons may reflect functional changes in the relationship between them.8,9,10 Therefore, at the first step, the present study aims to evaluate the spatial arrangement of the neurons and glial cells as well as their relationship after stress in rats. In the second step, a natural and a synthetic component; i.e., curcumin and sertraline, are prescribed and compared.
Curcumin is the principal curcuminoid of the popular Indian turmeric. It is the main component of curcuma longa and has been used in the Indian and Chinese systems of medicines. Nowadays, curcumin is being used for its diverse biological actions, such as antioxidant, anti-inflammatory, anti-carcinogenic, anti-microbial, and neuroprotective effects.11,12,13 Sertraline is an antidepressant which is used to treat major depression in adult patients. Its antioxidant and neuroprotective action have also been reported in neuro degenerative diseases.14
Therefore, the present research aims to evaluate the effects of chronic stress on the spatial arrangement of the neurons and glial cells in the mPFC of rats. The effect of application of curcumin and sertraline in these parameters will also be evaluated. We manipulated the PFC because depressed patients present differences in these cerebral structures.15 Briefly, the study was conducted to find responses to the following questions. How much does the spatial arrangement of neurons andglial cells and cross-correlation of the cells change after stress induction in mPFC of the rats? Can curcumin and sertraline prevent the possible changes in the spatial arrangement?
METHODS
Animals
In this study, 42 adult male Sprague-Dawley rats (240 to 280 g) were obtained from the laboratory animal's center of Shiraz University of Medical Sciences, Shiraz, Iran. The Ethics Committee of the University approved the animal experiment (Approval No: 91-6124). The male rats were randomly assigned to experimental and control groups. The rats were housed under standard conditions, room temperature (22-24℃), and a 12:12 h light-dark schedule and had free access to water and food. The study animals were divided into seven groups each containing 6 rats: Group I: stress+water group daily receiving stress and distilled water, Groups II: stress+olive oil group daily receiving stress and olive oil, Group III: curcumin group receiving curcumin (100 mg/kg/day) (Merck, Darmstadt, Germany),16,17 Group IV: sertraline group receiving sertraline (10 mg/kg/day) (Rouz Darou Pharmaceutical Company, Tehran, Iran, one of the limitations of this study was absence of the bioequivalence information of sertraline produced by the company),14 Group V: stress+curcumin group daily receiving stress and curcumin (100 mg/kg/day),16,17 Group VI: stress+sertraline group daily receiving stress and sertraline (10 mg/kg/day),14 and GroupVII: control group. All the animals received daily gavages for 8 weeks. It should be mentioned that they were housed in plastic cages under standard conditions.
Stress model
The animals were submitted to a CVS regime over a 56-days period or remained in their home cages without stress manipulation.18 The CVS is described in Table 1.
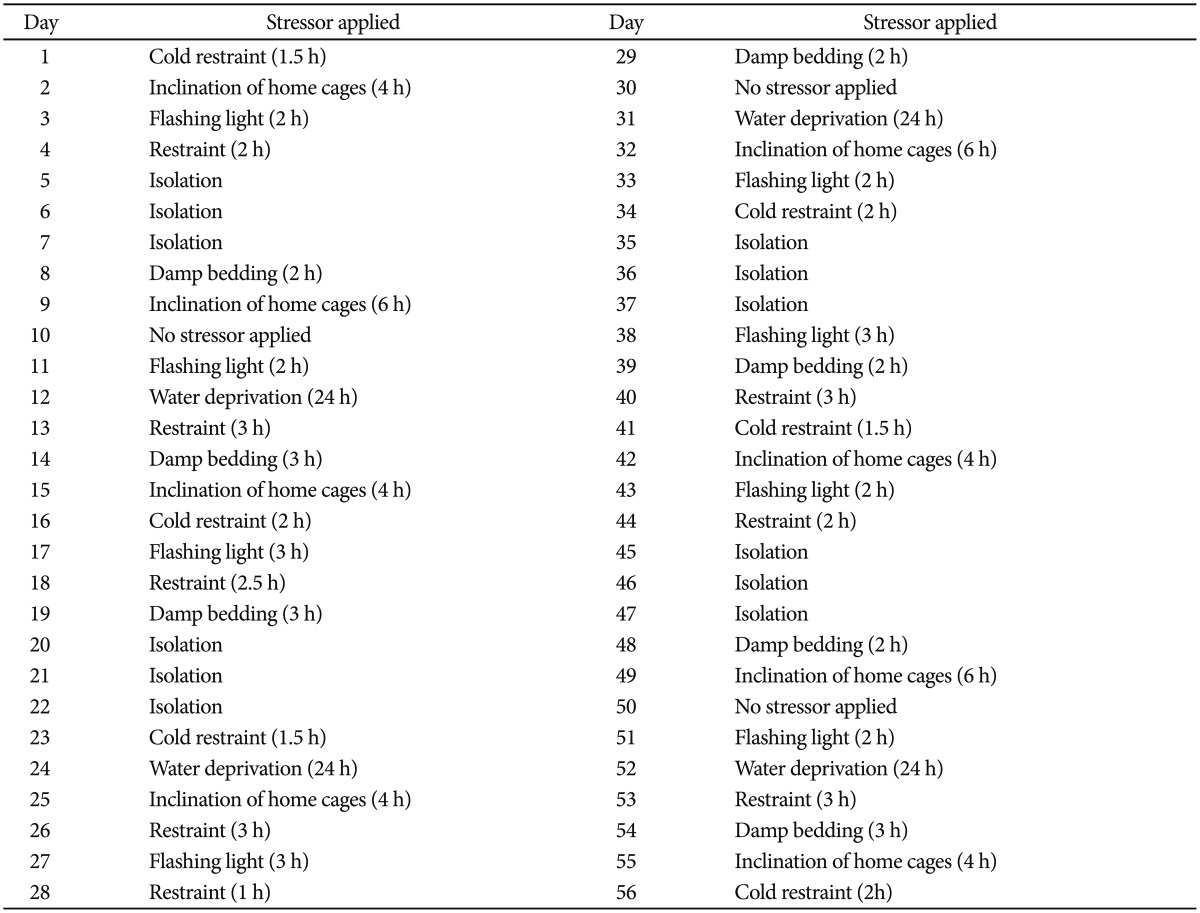
The protocol for induction of the chronic variable stress in 56 days for the rat model
Tissue preparation
The rats were deeply anesthetized and decapitated and the brains were exposed by an incision along the midline of the skull. A small amount of fixative was poured on the exposed brain immediately. The brains were removed and mPFC was identified according to atlas of Paxinos and Watson.19 Isotropic Uniform Random (IUR) sections are necessary for estimating some of the stereological parameters of the mPFC including studying the spatial arrangement of the cells. In this study, orientator method was applied to obtain the IUR sections.20 The mPFC pieces were sectioned at 4 µm thickness and were then stained by cresyl violet (0.1% in distilled water). It should be noted that the glial cells were distinguished from the neurons by their smaller size, lack of a nucleolus, and stained cytoplasm.
Estimations of covariance
The stereological objective is to estimate the local 3D arrangements of different tissue compartments within mPFC. A transparent lattice bearing a row of points was constructed to serve as a set of linear dipole probes.21,22,23,24,25,26 Each row consisted of 50 points and 49 equidistant intervals. The point interval corresponded to a distance of 2.6 µm on the scale of the tissue. This distance was selected because it offers a sensible starting distance with reference to the size of the glial cells. Consequently, both end points of dipoles (DP) of class size r=1 (equivalent to 2.6 µm) have chances of being included within the same cell section. That was also true for the neurons. The lattice was superimposed on the live image on a monitor connected to a microscope (Nikon, E-200, Japan). It was set to be random in position and orientation in each field. For each mPFC, 11 trials (a total of 550 test points) were conducted. For every trial, the nature of the tissue component underlying each test point was noted and all this information was recorded on a 50×11 matrix printed as a blank table with 50 columns and 11 rows. Within the cells of this matrix, each point was coded as 1 (neuron), 2 (glial cell), and 3 (neuropil) (Figure 1). There after the data sets were analyzed using the software prepared in Histomorphometry and Stereology Research Centre, Shiraz, Iran. To estimate "Vv", "C(r)", and "g(r)", the distance between the points (DP) ranged from r=0 (equivalent to 0 µm) to r=49 and the total distance was 49×2.6=127.4 µm. The covariance of a component (X) was estimated by the following equation:
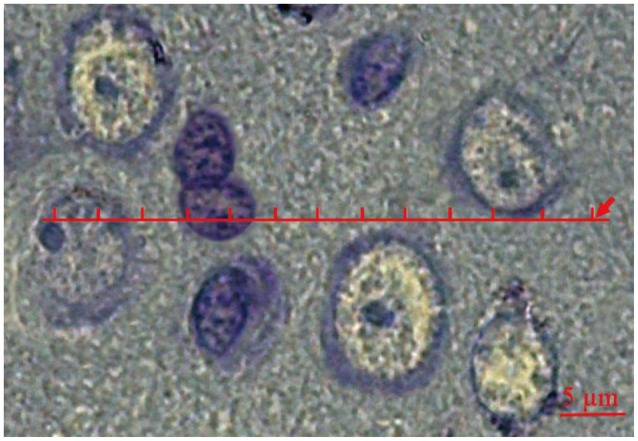
Coding of the cells for stereological estimation. A transparent lattice bearing one row of points was constructed to serve as a set of dipole probes. The point interval (r) corresponded to a distance of 2.6 µm. Each test point was coded as 1,2, and 3 if the point was laid on the neurons, glia, and neuropil, respectively.
Estimation of pair correlation function
Although a useful statistical description of spatial arrangement can be given using covariance, it depends upon the volume fraction and, as a result, making comparisons may be problematic. The dependence on volume fraction can be overcome by estimating pair correlation function.21,22,23,24,25,26 Pair correlation function is the normalized covariance function obtained by dividing covariance by the reference value (squared volume fraction):
Estimation of cross-covariance
All the above description refers to the covariance for a single component with respect to itself. In a multi-component tissue, dipoles often hit two different phases simultaneously.21,22,23,24,25,26 The function used to quantify the spatial arrangement is cross-covariance [C(r) X, Y] and can be estimated using the following equation:
Estimation of cross-correlation
The cross-covariance between the two components (X, Y) is defined as the probability that an isotropic dipole of length "r" hits components X and Y simultaneously divided by the number of the dipoles hitting the reference volume.21,22,23,24,25,26 Similarly, the cross-covariance can be normalized to take out the volume fraction differences using the estimation of cross-correlation functions and the following equation:
Estimation of degree of order
In addition to correlation and cross-correlation, to estimate the degree of order of the neurons and glial cells in mPFC, the statistic "M" was estimated in both groups. It is related to the global degree of order in the spatial point pattern.25,26 This estimation includes identification of the 1stgmax and the next following minimum gmin with the corresponding r-values rmax and rmin (Figure 2) for each reduced g-function, where rmin>rmax. Using these data, the statistic will be estimated by the following formula:
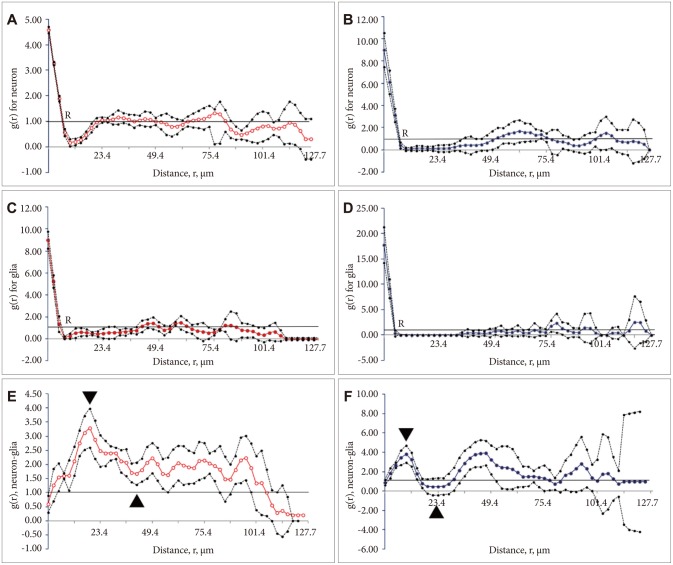
Pair correlation, and cross correlation functions g(r) of the neurons and glia. In each plot the mean over five cases is plotted with a point-wise confidence interval based on Students's t-distribution. The relationship between pair correlation function and dipole distance for neurons in the control (A) and stress+distilled water (B) rats. The horizontal reference (null hypothesis) line corresponded to the values expected for a random spatial arrangement [g(r)=1]. The pair correlation function approached closely to the reference line because no significant correlation was found between the values of points lying far away in the cortical tissue. The relationship between pair correlation function and dipole distance for glial cells in the control (C) and stress+distilled water groups (D). The cross-correlation, g(r), between the neurons and glial cells plotted versus distance, r, in micrometers in the control (E) and stress+distilled water (F) groups. The dots are the mean g(r) of the six animals in the control and stress+distilled water groups. The horizontal reference line at g(r)=1.0 is the reference line expected for a 'random' structure. "▾" and "▴" indicate gmax and gmin, respectively in both groups.
Statistics
Group means and coefficients of variation among animals (CV=standard deviation/mean) were calculated for neuron and glia volume within mPFC. Comparisons of g(r) of the neurons and glial cells and cross-correlation between the groups were undertaken using Mann-Whitney U-test.
RESULTS
Volume
The total volume (mm3) (CV) of the neurons and glia was 0.80 (0.05) and 0.40 (0.07), respectively in the control group. The corresponding values for the stress+distilled water groups was 0.35 (0.05) and 0.17 (0.10), respectively, which were significantly different from the control group (p<0.05). No differences were seen between stress+distilled water vs. stress+olive oil. The volume in the group of curcumin or sertraline alone did not represent any significant differences in comparison with the control group. The volume of the neuron and glia showed significant differences in the stress+ sertraline or stress+curcumin groups in comparison with the stress+distilled water or stress+olive oil, respectively.
Spatial arrangement of neurons
Estimates of g(r) for the neurons are plotted against the dipole distances, r, in Figure 2A and B. The values at the beginning of the curve (from r=0 to 5.2 µm) showed a difference between the control (A) and stress+distilled water groups. It then reduced and at a value of about 7 µm, indicated by letter "R", crossed the reference line. After dipping to the minimum value, the plot rose above the reference value again. In the control group, the curve crossed the line at R=7 µm and rose at 23 µm. In the stressed group, the corresponding values were R=7 and 52 µm. As Figure 2 depicts, at these distances, the data points of the stressed rats went down below the reference line [g(r)=1] indicating a significant negative correlation between the neurons. This means that they were neither arranged randomly nor clustered; rather, they were repulsed. However, this did not occur in the controls and repulsion could be detectedonly in a smaller distance. After the gap, the data points in both groups showed a random arrangement at larger distances (p<0.05). Therefore, the spatial arrangement of the neurons was changed by stress and dissociation of the neurons could be seen at some places. This indicates that the neurons are not normally arranged after stress. For better understanding of the plots, cell arrangements are presented in Figure 3. Figure 3A and B show the arrangement of the neurons in the control and stress+distilled water groups, respectively. According to the results, fewer neurons and wider gaps were detected in the stressed rats. The evaluation of the g(r) of the neuron of the control vs. stress+distilled water shows significant differences. No differences were seen between stress+distilled water vs. stress+olive oil. The group of curcumin or sertraline alone did not represent any significant differences in comparison with the control group. The g(r) of the neuron showed significant differences in the stress+sertraline or stress+curcumin groups in comparison with the stress+distilled water or stress+olive oil, respectively.
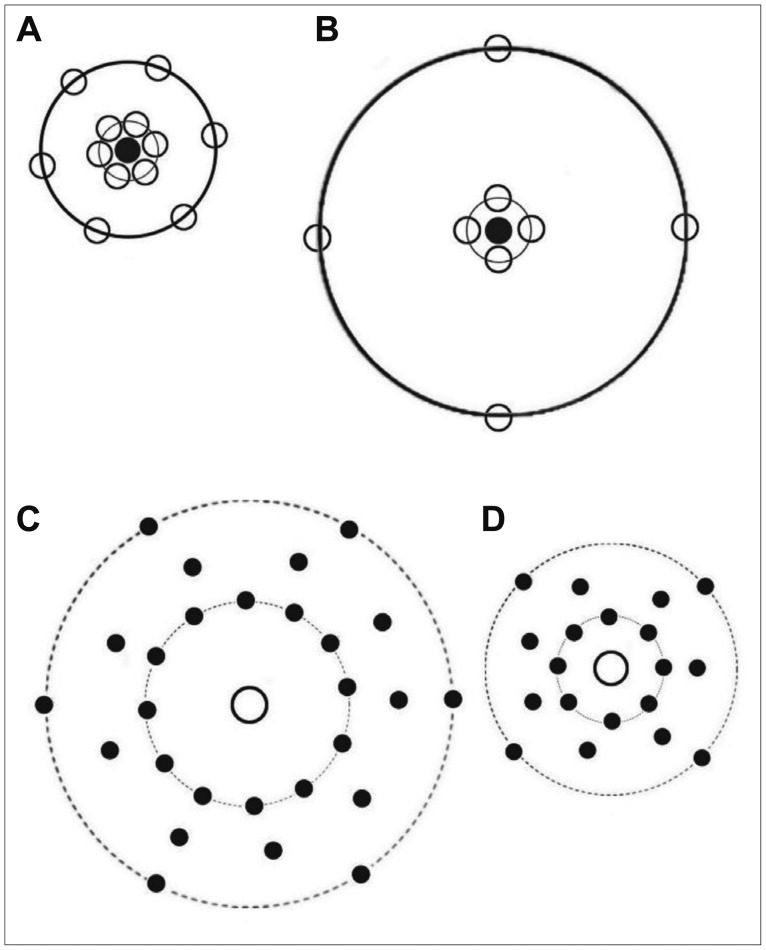
Cell spatial arrangement. For better understanding of the g(r), cell arrangements are presented here. A and B show the arrangement of the neurons in the control and stress+distilled water groups, respectively. A fewer neurons (white circles) and wider gaps were arranged around the central neuron (black circle) in the stressed rats. Similar results were also obtained with regards to the glial cells. Bivariate assessments or the cross-correlation of the neurons and glial cells in the control and stress+distilled water groups are presented in C and D, respectively. More dispersion and repulsion of the glial cells (black circles) can be seen around the central neuron (white circle) in the stressed animals.
Spatial arrangement of the glial cells
Estimates of g(r) for the glial cells are plotted against the dipole distances, r, in Figure 2C and D. As the plot shows, the curve crossed the reference line at R=5 µm in both groups. However, it rose at 44 and 70 µm in the control and stress+distilled water groups, respectively. This indicates a wider gap between R and the reference line. It shows that the data points went down below the reference line [g(r)=1] indicating a significant negative correlation between the glial cells. This means that the glial cellswere repulsed in the stressed group but not in the controls. After the gap, the data points in both groups showed a pattern of random arrangement at larger distances (p<0.05). This can be considered as the dissociation of the glia at some places (5-70 µm). Hence, it can be concluded that the glial cells, similar to the neurons, are not normally arranged after stress.
The evaluation of the g(r) of the glial cells of the control vs. stress+distilled water showed significant differences. No differences were observed between stress+distilled water vs. stress+olive oil. The group of curcumin or sertraline alone did not represent any significant differences in comparison with the control group. The g(r) of the glial cells showed significant differences in the stress+sertraline or stress+curcumin groups in comparison with the stress+distilled water or stress+olive oil, respectively.
Cross-correlation of the neurons and glial cells
Figure 2E and F showed some differences in the spatial arrangement of the neurons and glia by plotting the cross-correlation function versus distance. The cross-correlation was zero at a distance of zero micrometer. By increasing the distances, the probability that the ends of a dipole could land in the two structures of interest increased, as well. If the cross-covariance is above the reference line, it indicates a positive correlation between the neuron and the glia. When it goes downward, however, it indicates a negative correlation. In this study, the cross-covariance was above the reference line in the control rats indicating a positive correlation between the neurons and glial cells. At 18-32 µm, both structures showed a negative correlation in the stress+distilled group, but not in the control rats. At 84-88 µm also, a negative correlation was observed in the stress+distilled group in comparison to the control rats (p<0.05).
The curves began with ascending segment and there after attained positive values, mounting to a 1st maximum (gmax) and then descending to a 1st minimum (gmin) curve. According to Figure 2, the gmax and gmin in the curve of the control animals were about r=21 and 44 µm, respectively. On the other hand, the gmax and gmin for the stressed rats were about r=10 and 26 µm, respectively. As Figure 2 depicts, the height of the first maximum of the pair correlation function declined rapidly in the stressed group. This indicates a preferred distance between the two cells in the two groups. In other words, this distance indicates structural information about how neurons and glial cells within the mPFC are spatially changed relative to each other. The study findings revealed differences among the study groups regarding the bivariate assessments of the neurons and glia. For simplicity of understanding the cross-correlation of the neurons and glial cells in the control and stress+distilled water groups are presented in Figure 3C and D, respectively. More dispersion and repulsion can be seen in the stress+distilled water animals. Besides, plots of pair-correlation function of neurons and glia showed a wider gap in the spatial arrangement of these structures in the mPFC after chronic stress.
The evaluation of the cross-correlation of the neuron-glial cells of the control vs. stress+distilled water showed significant differences. No differences were observed between stress+distilled water vs. stress+olive oil. The group of curcumin or sertraline alone did not represent any significant differences in comparison with the control group. The cross-correlation of the neuron-glial cells showed significant differences in the stress+sertraline or stress+curcumin groups in comparison with the stress+distilled water or stress+olive oil, respectively.
Degree of order of the cells
The statistic "M" was related to the global degree of order in the spatial point pattern. The estimated values for the neurons and glial cells were 0.62 and 0.20 in control and stressed animals, respectively.
DISCUSSION
In the current study, stereological methods were used to estimate the spatial arrangement of the neurons and glial cells of mPFC. The major advantage of this study was the unique quantification of the spatial pattern organization of the neuronal and glial cytoarchitecture. In a simple word according to the results, fewer neurons and wider gaps were detected in the stressed rats. Similar results were also obtained with regards to the glial cells. Bivariate assessments of the neurons and glia in the control and stress+distilled water groups showed more dispersion and repulsion in the stressed animals. Besides, plots of pair-correlation function of neurons and glia showed a wider gap in the spatial arrangement of these structures in the mPFC after chronic stress. Therefore, this gap should be filled with neuropil. However, our results supported the hypothesis that an altered pattern of neuronal and glial position is present in the mPFC after chronic stress. There are reports that explain morphometric changes for neuronal and glial cells density and size in prefrontal cell of major depression patients.5,6 Our previous study revealed a difference in the cellular spatial patterns in dorsal root ganglion of sciatic nerve crush.27 The present study showed alterations in neurons and glial cells arrangement, as well. In general, investigation of the spatial arrangement may provide interesting data about the structural changes that cannot be detected using first order stereology. For instance, Hof et al. performed a stereologic analysis of the spatial distribution of oligodendrocytes in layer III of Brodmann's area 9 in the superior frontal gyrus in schizophrenia. Their results suggested a change in the spatial distribution of oligodendrocytes in schizophrenia.28 Thus, assessment of spatial arrangement should be considered in future investigations.
The changes in the spatial arrangement of the neurons and glia might be related to the cell loss in the cortex. This cell loss can be explained according to our previous study which showed that chronic exposure to stress reduced the volume as well as the number of neurons and glial cells in the mPFC (accepted for publishing). Several mechanisms might be responsible for neuron or glail loss in the mPFC. The previous data reported that chronic stress, in addition to suppressing neurogenesis, may also trigger apoptosis.29,30 In addition it was shown that the cortical neurons are sensitive to neurotransmitter level changes in the tissue.29,30 Low but persistent levels of glutamate or other excitatory amino acids such as N-methyl-d-aspartate, have been shown to cause apoptosis.29,30 On the other hand, the apoptotic neurons seen after chronic stress may express glucocorticoid receptors.29,30 In addition apoptosis is also caused by the pro-inflammatory cytokine interleukin 1-β whose expression has been shown to increase by chronic stress.29,30 Therefore, chronic stress-induced apoptosis may be the result of glucocorticoids working in collaboration with inflammatory cytokines and excitatory amino acids. It has been shown that chronic stress resulted in edema around all types of blood vessels, tortuous blood vessels and dramatic impairments in microcirculation.31
Recent data have recommended that the therapeutic action of antidepressants may include their effect on neuronal survival. In fact, antidepressants decrease tissue atrophy in depressed patients, as well as in animal models of depression.32 The findings obtained from animal studies have also suggested that many of the changes can be reversed by antidepressant treatment.33,34,35 In this study, we evaluated the effect of the chronic administration of curcumin and sertraline on the stereological parameters altered by stress. The present study showed that the changes in spatial arrangement of the cells were protected by sertraline. The previous studies indicated that curcumin shows antidepressant like action.33,34,35 It has been also used in major depression as well as inhibitor of mo-noamine oxidase enzyme. Curcumin can also regulate the level of various neurotransmitters and promotes hippocampal neurogenesis.11 Our results demonstrated that curcumin prevented the change in the spatial pattern of the neurons to glial cells in the mPFC after chronic stress. In another study, curcumin was shown to protect the dopamine producing cells of the substantial nigra area of the brain in a rat model of Parkinson's disease.11 Besides, various reports have suggested the beneficial effects of sertraline in animal models of depression.36,37,38 Several studies reported that antidepressant administration prevented both hippocampal atrophy and altered neurogenesis in the dentate gyrus induced by stress.39 Our previous study showed that stress affected the behavioral tests, such as spatial learning, memory, anxiety, and anhedonia.16 However, the pathogenesis of neurons and glial cells after chronic stress is still controversial. Yet, this method can provide useful data in investigation of different structures in mPFC after chronic stress.
In case of interpretation of the spatial arrangement graph, it should be mentioned that the behavior of near the origin may depend to an important extent on the actual size of the cells. That is, for small a dipole will often lay within the same cell; it may not often hit two cells. It is therefore might be some degree of uncertainty to conclude that, if is large for small, then the cells tend to be close together, as suggested by Figure 3A and B. In general, a weakness of second order methods is that it is much easier to interpret the shape of a graph after seeing the real pattern. In other words, it generally needs care to infer a pattern from a graph.
Conclusion
The findings of the current study showed a difference between the stressed and the control group regarding the cellular spatial patterns in mPFC of the rats exposed to chronic stress. A dissociation (a gap) was observed between the neurons and glial cells in mPFC after chronic stress. The findings also demonstrated that curcumin and sertraline could eliminate the adverse effects of stress on spatial arrangement at mPFC.
Acknowledgments
This work was performed at Histomorphometry and Stereology Research Centre, Shiraz University of Medical Sciences, Shiraz, Iran. This study is a part of the thesis written by Mohammad-Amin Abdollahifar, PhD student of Anatomy. The work was financially supported by the Research Vice-chancellor of Shiraz University of Medical Sciences (Grant No. 91-6124). The authors would like to appreciate Rouz Darou Pharmaceutical Company for their kind provision of sertraline. They are also grateful for Ms. A. Keivanshekouh at the Research Improvement Center of Shiraz University of Medical Sciences for improving the use of English in the manuscript.