INTRODUCTION
In this 21st century of IT technology, people spend a significant amount of time a day using IT devices, computers, TVs, and smartphones. Some smartphone users exhibit problematic behaviors similar to substance use disorders. These includes preoccupation with mobile communication, excessive money or time spending on smartphones, using smartphones in socially or physically inappropriate situations such as while driving an automobile, usage leading to adverse effects on relationships, increased time and anxiety if separated from a smartphone or sufficient signal. Recently, medical society has accepted this type of behavioral disorders as addiction1 and smartphone addiction is a special type of behavioral addiction.
Similar to other health related regulations, some commercial and research applications that helps self-control has been developed. At present several applications are available in Google Play Store (i.e., MoMoLang, KidsManager, MyKidsTalk, Tele-Keeper, xKeeper, KidsCare, Kytetime, NetNanny, Qustodio, and SmartSheriff). Research development on smartphone usage measurement are also available.2345 Their main features are remote monitoring and remote locking. These aids in self-regulation and limiting of smartphone usage by adopting diverse intervention mechanisms, such as pop-up alarms, locking apps/screens, self-monitoring, and motivating (e.g., inspiring messages or photos). Our previous work, SAMS also includes similar functionalities. AppDetox4 allows users to establish usage-limiting rules by specifying apps and corresponding times to lock them. NUGU6 allows groups of people to engage in limiting their smartphone usage by sharing their usage information. Our previous work, SAMS2 provides useful functions for monitoring and locking usage involving interaction with clinicians who can treat the problematic usage behavior. The applications are advertising its effectiveness, but there are no officially reported data available at present. Some research67 showed the possibility of effectiveness in self-control but the effectiveness often depends upon the detail mechanism and application methodologies. Furthermore, the effectiveness is strongly dependent upon the motivation of the users in using these applications consistently.
The source, diagnosis and treatment of smartphone addiction are studied.8910 The major method for diagnosis and treatment is self-report and counselling. However, researches in many areas of human behavior have found that there are significant differences between self-reported and actual behaviors. For example, up to 50% of head and neck cancer patients who reported being nonsmokers were actually smoking as determined by measurement of carbon monoxide in expired air and levels of a nicotine metabolite11 in blood sample. Self-reported measures of physical activity underestimated health risk biomarkers by as much as 50% when compared to accelerometer measurements,12 and self-reported TV viewing time was underestimated by an average of 4.3 hours per week when compared to data from a TV monitor.13 A few similar studies141516 have been conducted on mobile phone usage, however, to our knowledge there is no intensive study on the comparison between self-report data and measured one.
The paper is organized as follows. We describe the participant recruitment, self-report questions, and the tracking and measurement method. Then, we describe the experiment results: the effects of self-consciousness on self-reported usage time, validation of self-reported most frequently used applications and time zones, the patterns in application usage in a day. Finally, we discuss the implication of the study and recommendation to the clinicians in diagnosis and treatment of problematic smart phone users.
METHODS
Procedure
98 students were contacted at the class. After completing the survey, students were asked to install software that monitors their smartphone usage activity. Participants were offered no incentive/remuneration for their participation. A total of 82 surveys were completed for an overall response rate of 83%. Of the 82 students who completed the survey, 51 installed the SAMS Android application on their smartphones leading to 62% participation. 16 students uninstalled the application within 7 days.
Sample
A sample of 98 college students of 2015 Spring Semester, enrolled in 4 year course at a public University in the Metropolitan region of northeast Asia, was obtained through the institutional research office's approval. Students were contacted at the class. The final 35 participants, completing the survey consistently and using the monitoring app at least 7 days, are of 22.3 year (SD=2.4) on average and the ratio of male to female participation is 24 to 11.
Measures
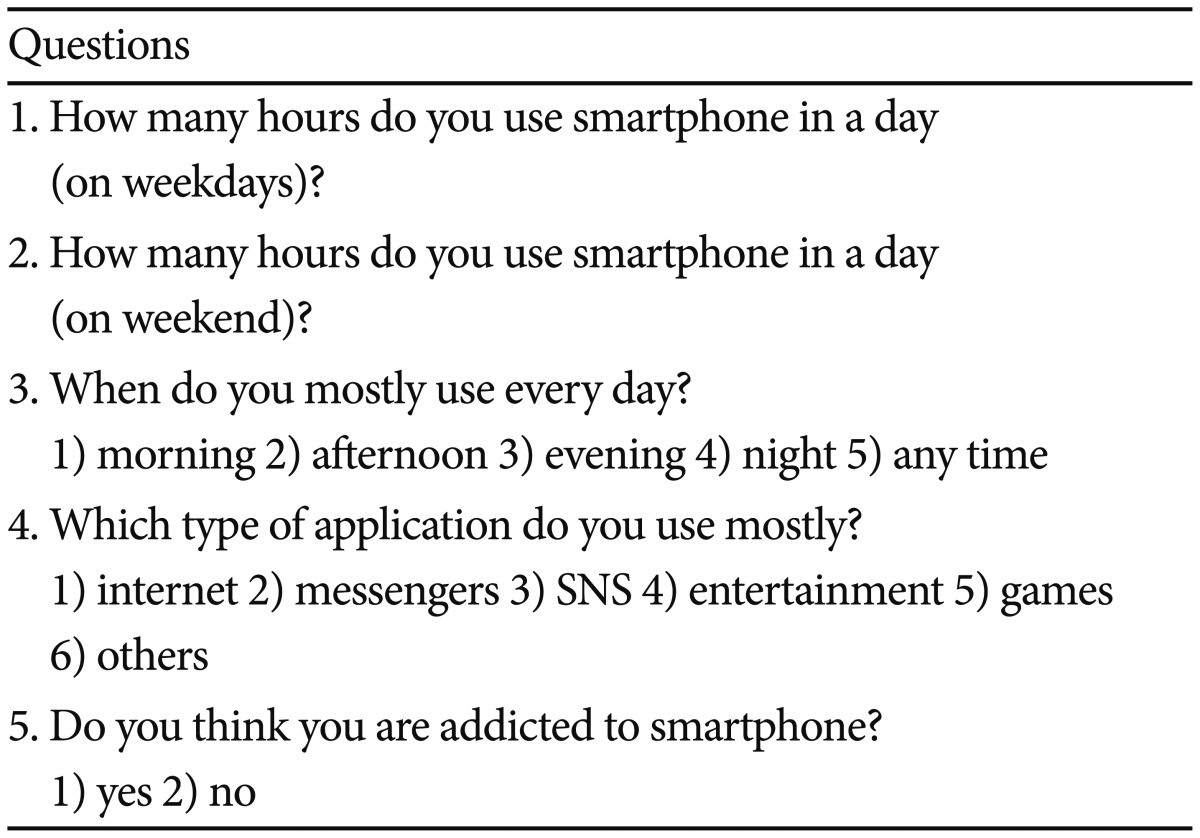
Survey questions include demographic information (sex, age), smartphone addiction scale short version (SAS-SV),9 and smartphone usage patterns. Table 1 shows the questions for the smartphone usage patterns.
Upon completing the survey, students were provided a link to download SAMS client application that monitored their smartphone usage for 6 weeks. The software runs in the background and measures which application, website, or document is being used. The data collected by the software were automatically uploaded to the SAMS server where only the researcher had access to the monitoring data. The detailed architecture and functions are described.2
Statistical analysis
The survey data were input manually and combined with data from the monitoring software, screened for anomalies, and analyzed using R. T-tests, correlation, the Cohen's d were used to compare the difference between the measured and self-reported data. When appropriate, subjects are grouped into high and low addiction scaled groups.
RESULTS
From the literature review, we found three areas have been studied most frequently and considered important: 1) The key diagnosis measures for smartphone addiction.89 2) The Strength of influence of each application on the users regarding smartphone addiction.21718 3) The effect of using smartphone on life 4) Intervention and e-therapy.67 Therefore, the main comparison measures are smartphone usage hours, frequently used time period, and favorite application.
Following the suggested cut-off value 30 in SAS-SV,9 the subjects are classified into addicted group (10 subjects) and non-addicted group (25 subjects). Note that the original suggested cutoff values was 31 for boys and 33 for girls, but no suggested value are published for college student.
Usage time
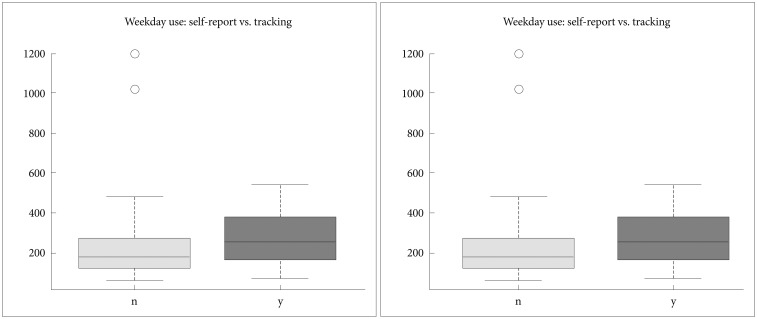
First, we checked the self-perceptive diagnosis on smartphone addiction (yes or no question) and SAS-SV value (Figure 1). The users aware of overuse scores larger SAS-SV (p<0.01), and larger total usage time (p<0.01) in average (Cohen's d=1.2). Later we used self-diagnosis for group category, as the threshold value for SAS-SV is still under study for adult users and the correlation between measured usage time and SAS score was studied previously.2
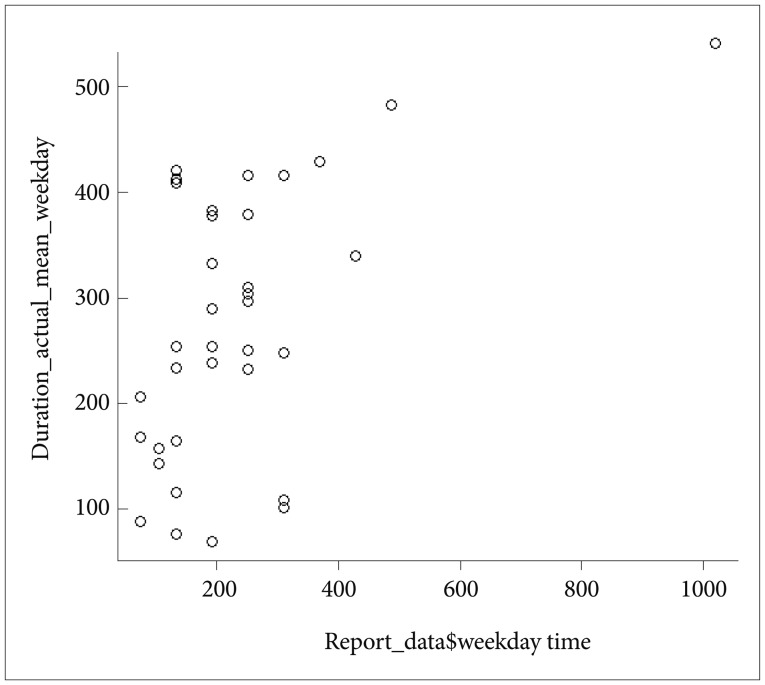
Figure 2 compares the average daily usage time between self-report and measured values on weekdays and weekends. The result shows the reported usage time is a smaller than the measured value by approximately 20% percent.
Figure 3 shows the correlation cluster, and reveals that the mean usage time of self-reported and measured value has significant correlations (correlation coefficient=0.528, p<0.01) but still generously different. Figure 3 shows only the case for weekdays but the pattern is quite similar to weekend data.
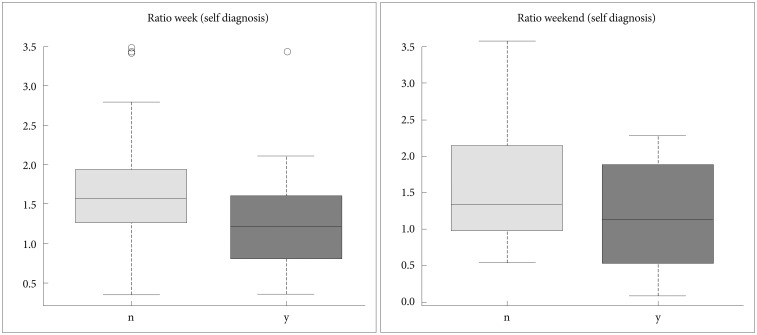
Figure 4 reveals an interesting result that shows the ratio of measured to self-reported time of the overuse aware users are larger consistently in weekdays and weekend (1.5) than of the overuse unaware (around 1.15) ones. This implies that clinician should interpret the self-reported usage time differently for the two types of users.
Usage pattern in a day
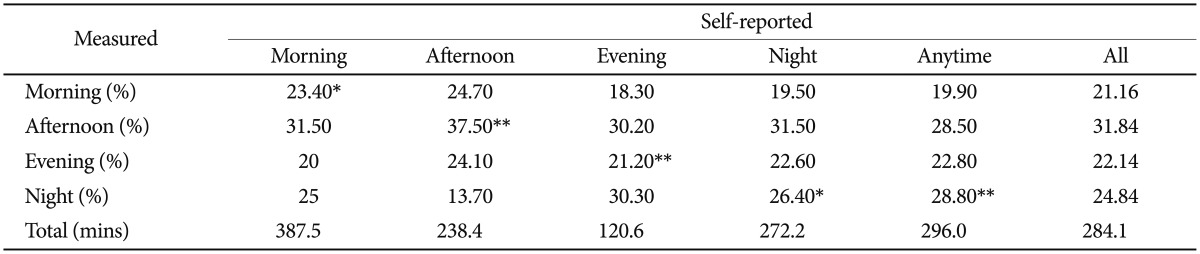
For the answer to time period, a few participants chose two, for example ‘evening and night.’ In such cases, we assigned the user into multiple groups for data analysis, e.g., in both the evening-use-group and in night-use-group. It helps to explain the usage pattern better than an arbitrarily chosen one.
For data analysis, we classify the day into 4 periods: 1) Morning: the interval between sunrise and noon (7:00 to 12:00, 5 hours), 2) Afternoon: between noon and evening (12:00-18:00, 6 hours), 3) Evening: between afternoon and night (18:00-22:00, 4 hours), and 4) Night: between the sunset and the sunrise when the Sun is below the horizon: 22:00-7:00, 9 hours). In fact, there are some ambiguities in survey questions on the definition of these time periods, especially on the evening. We tried to use the best convention from participants.
Table 2 shows that the average percentages of declared and measured usage time. Subjects used more time in their declared time period than other time periods (p<0.1 or 0.5). Please note that time periods have different durations, e.g., 4 hours for the evening and 9 hours for night. These patterns have significant correlations with the real usage. In total statistics, time spent using smartphone in the afternoon is almost over 30% being the largest or near to the largest in all 5 groups. The actual data shows the usage time in the afternoon is so huge for the group who selected afternoon as their mostly used period and is nearly 40%.
Favorite application types
We filtered out top 150 applications from approximately 12000 application reported by the participants as being used to decrease overhead to categorize them into 5 categories according to the scope of the survey. The usage time of these 150 applications contribute over 95% percent to the total spent time. Google app category is first obtained through google app store API1 and then mapped into the 5 survey app-categories on our own decision. For this data analysis, we used all the data from all 41 participants including the 6 users who have less than 7 days record.
The top popular applications in each category are 1) Messenger (Kakao Talk, Line, ChatOn), 2) Entertainment (Youtube, Video, Books), 3) SNS (Facebook, Twitter, Instagram), 4) Games (Chess, Worldcraft, Puzzle), and 5) Internet (Browser, SmartSubway, Gmarket).
Table 3 shows the statistics. Subjects mostly spent more time in their declared application types than others (p<0.1 or 0.5). The measured app categories take portion over 20% and within the top rank 2 in usage time. However, in Messenger Category, the spent time of most of the user is large and even larger than their self-reported value. So this is obvious usage of messengers is too common among the users. Interestingly, the users who responded SNSs as their favorite application use messenger applications for a small time. We assume usage of messengers like KakaoTalk is decreased as Facebook Application has its own chatting service. The result shows the user reporting SNS and game as the favorite application spend much time in game and internet, but the sample count is small for statistical interpretation and no implication is drawn.
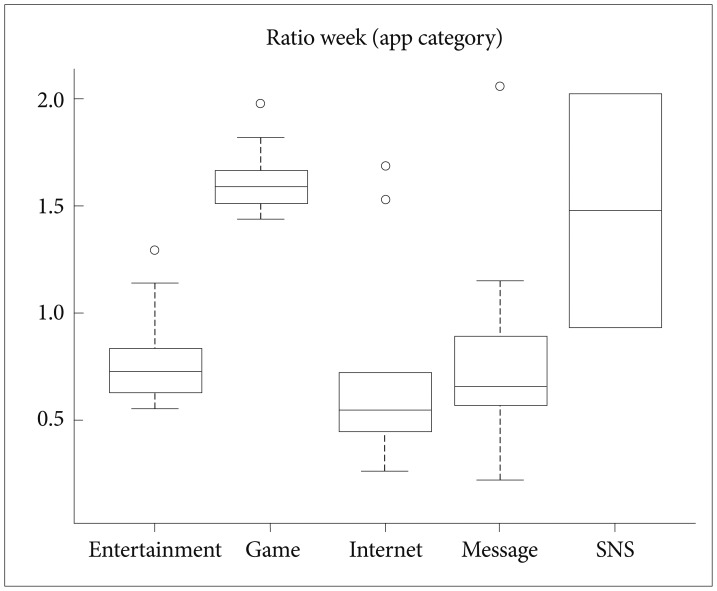
Figure 5 shows that SNS and game users show a significant difference in the ratio of measured to reported usage time (the mean difference=0.69, 0.73). Previous research1920 on the impact of content upon smartphone addiction reports the game and SNS is strong positive predictors of smartphone addiction. This result implies that the more addictive are likely to underestimate their real usage time, which could be hint for development of tolerance.
For the last data analysis, the variations of usage time grouped by application category are examined in Table 4. The usage of games and messenger applications is higher in the afternoon, night and morning respectively. The entertainment usage (webtoon, music, and video applications) and the internet usage (news and mail etc) are higher in the night and morning respectively than in other time periods.
Comparison between addicts and non-addicts
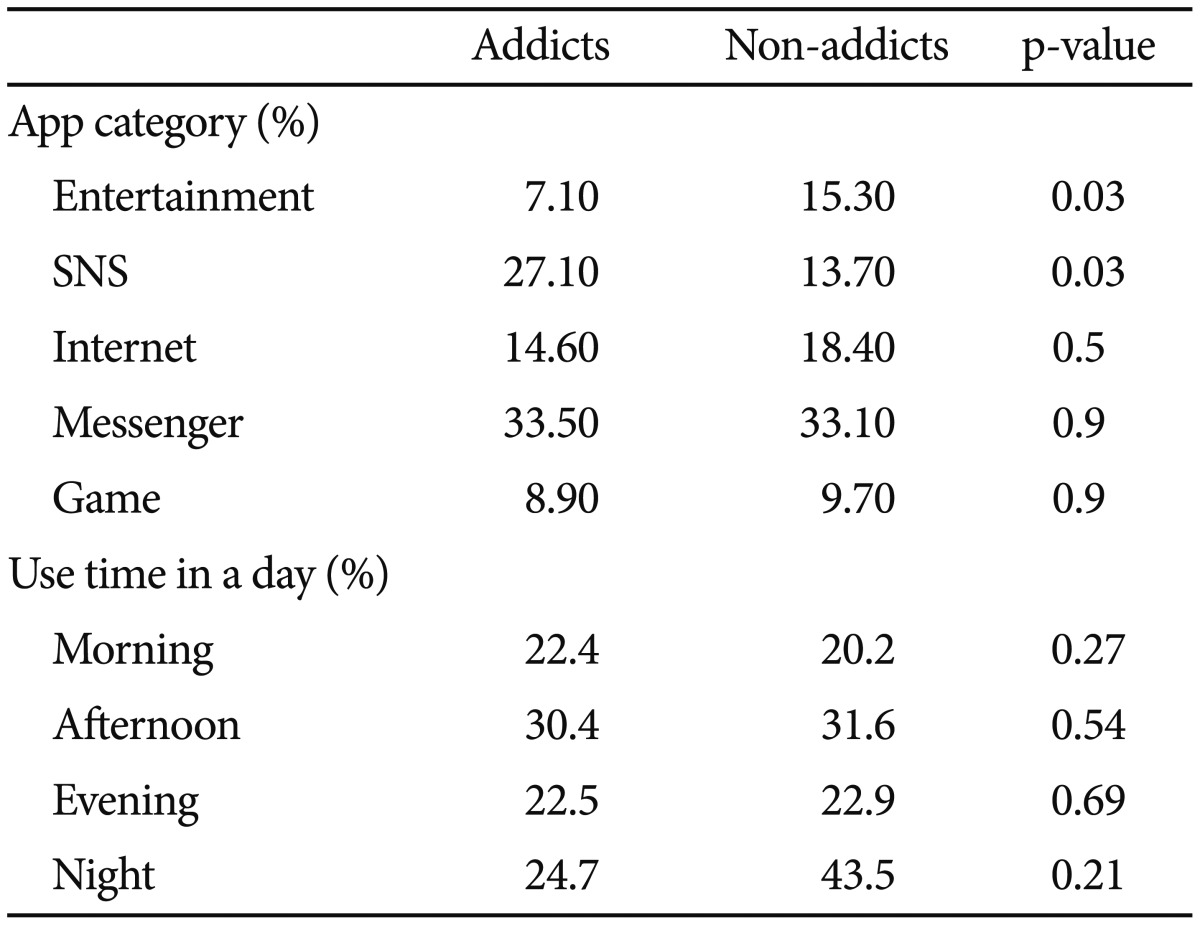
The actual usage patterns between addicted group and non-addicted group are compared in Table 5. SNS application usage is larger in the addicted group whereas entertainment application preferred in the non-addicted group. There was no statistically significant usage difference in messenger, game, and internet categories. When we compare the usage pattern in a day between the two groups, our study cases do not show significant difference in the daily pattern between addicted group and non-addicted group.
DISCUSSION
The results of this study reveal that self-report measures of smartphone use can approximate but are not accurate measures of actual use. This gap between self-reported and actual measurements suggests the following list of caution in interpreting self-reports.
The self-conscious users of their overuse of smartphone show conservative properties in estimating their usage. The personality and education level on smartphone addiction of subjects could influence the self-report significantly. We could guess that it is likely that ‘self-conscious’ user are likely careful, sensitive, or depressed, and they are better aware of their behaviors. All the subjects in this study are from same university, so we could not study the education difference on this conservatively estimating property. The personality study, for example, BIG-5 personality questions, for the conscious person could be done for understanding why they estimate their usage conservatively in the following study.
The actual time and application type patterns of measured data roughly match the self-report data. The most intensive time period was ‘afternoon,’ not evening, which implies students use more in campus when they cannot access their laptops or desktops. The study shows that messenger categories are used mostly. However, there are some ambiguities in survey questions on the definition of these time periods and application types. The definition of time zone/period, i.e., morning, afternoon, evening, night can depend upon personal life-style and culture, especially on the evening. Therefore the survey should be prepared clear considering typical life patterns of the subjects.
The result shows there are significant cognitive bias in actual usage patterns exists in self report of smartphone addictions. Their reported favorite applications and peak usage time sometimes do not match with the mostly used ones and time period they use those. Also, some applications include multiple functions such as games, SNS, and messenger service. For example, it is not easy both in self-report and measurement to differentiate which application service they are using, messenger or SNS. Therefore further questions in surveys and monitoring mechanism should be developed for understanding the usage details of these multi-functional applications.
The study has limitations in the number of participants and the diversity and range of subjects. Also the IT usage trends keep changing rapidly so the continual and successive studies should be taken in a systematic way periodically. Since overusing smartphone became personal and social concerns, medical clinicians and psychologists have begun to develop its diagnosis and treatment methods.
However, the self-report based decisions for diagnosis and improvement are apt to fail in reflecting real state of the subjects. The authors consider the sources of mismatch are mis-perception of users on their own usage pattern and subjective acceptance of the questions. Regardless the origin of mismatch, the error in self report can cause difficulty or mistakes in diagnosis and treatment. Therefore, the measurement based approach should be incorporated in the clinical process.