The Association between Depressive Mood and Cholesterol Levels in Korean Adolescents
Article information

Abstract
Objective
Previous studies have shown that there is a correlation between lipid levels and depressive mood, and that lipids could be useful biomarkers for depression. We conducted this study to clarify the association between lipid levels and depressive mood in adolescents, especially in community samples.
Methods
We analyzed data from the Korea National Health and Nutrition Examination Survey (KNHANES) that was conducted from 2013 to 2016. A total of 2,454 adolescents aged 12–18 years (1,273 boys, 1,181 girls) participated in the Survey. We conducted a cross-sectional study using multiple logistic regression, adjusting for age, household income, daily energy intake, daily fat intake, and daily cholesterol intake, to assess the association between depressive mood and serum lipid levels.
Results
Depressive mood was found in 8.7% of those included in the study. Borderline (110–129 mg/dL) and high (≥130 mg/dL) levels of low-density lipoprotein cholesterol (LDL-C) were significantly associated with depressive mood [Borderline level: odds ratio (OR)=5.55, 95% confidence interval (CI) 1.56–19.81, p=0.01; High level: OR=5.73, 95% CI 1.06–31.08, p=0.04]. However, this association was not found in girls.
Conclusion
Our findings indicate that depressive mood in boys is associated with higher LDL-C levels. Further investigation regarding this relationship and the underlying biological mechanisms is needed.
INTRODUCTION
Depressive disorders in adolescents are common and characterized by core persistent and pervasive sad or irritable mood and anhedonia that lead to marked functional impairment [1]. Adolescent depression has a frequent recurrence of symptoms and is likely to be a chronic illness that lasts until adulthood, affecting the quality of life of those experiencing it [2].
Among the various hypotheses regarding the pathophysiology of depression, it has been suggested that serum lipid levels might represent a biological marker of depression [3,4]. A few mechanisms by which cholesterol may contribute to depression have been proposed in past studies. One such mechanism is that cholesterol, an important component of the cell membrane, affects serotonergic transmission or serotonergic receptor function [3,5]. Another potential mechanism is that abnormal cholesterol levels may lead to an altered inflammatory profile [6]. In addition, it has been suggested that the interactions between stress, the lipid profile, and the hypothalamic-pituitary-adrenocortical (HPA)-axis may contribute to depression [7].
In studies of adults, it has been suggested that serum cholesterol levels are inversely correlated with depressive mood [8] and suicidality [9]. In a recent meta-analysis of 42 studies [10], serum low density lipoprotein cholesterol (LDL-C), as a continuous variable, was significantly lower in patients with depression. However, the authors also reported that LDL-C as a categorical measure represented a marginally significant higher odds of developing depression in the presence of high serum LDL-C. As a result, they suggested the presence of a U-shaped association between serum LDL-C and depression, with both high and low levels of serum LDL-C related to an increased risk for depression.
These findings were not replicated consistently in studies of children and adolescents. In the study by Glueck et al. [11], children and adolescents with various diagnoses, including affective, adjustment, disruptive, anxiety, schizophrenic, and organic psychiatric disorders, in a psychiatric inpatient setting had a higher triglyceride (TG) value than controls. In this study, a low total cholesterol value was associated with a suicidal tendency. In another study of 12–21-year-old youths who were admitted due to suicidal tendencies, serum total cholesterol levels were higher in suicidal adolescents than in non-suicidal adolescents [12]. However, there were no correlations between cholesterol levels and depression, violence, or impulsivity.
Longitudinal cohort studies of mood and lipid levels have also been reported. Louise et al. [13] analyzed data from participants of the Western Australian Pregnancy Cohort study and reported that, at age 14, boys with higher anxious-depressed symptoms in the Teacher Report Form/6–18 had higher TG measurements. In addition, Jeffery et al. [14] reported that low mood in 16-year-old healthy adolescents who were recruited from randomly selected schools was associated with a higher TG value and cholesterol: high-density lipoprotein cholesterol (HDL-C) ratio.
These inconsistent results demonstrate the need for further evaluation of the relationship between lipid levels and depression in adolescents. However, to the best of our knowledge, there has been no study exploring the correlation between serum lipid levels and depression in a community sample. In addition, previous studies have been performed mostly in Caucasian children and adolescents, which may limit the generalization of previous results to non-Western countries, including Korea.
We assessed the association between dyslipidemia and depressive mood in community adolescents in Korea. We hypothesized that abnormal cholesterol levels would be associated with depressive mood in adolescents.
METHODS
Study design
The current study was based on data from the Korea National Health and Nutrition Examination Survey (KNHANES) conducted by the Korea Centers for Disease Control and Prevention (KCDC). The KNHANES is a nationwide survey designed to assess the health and nutritional status of non-institutionalized civilians in Korea. This nationwide cross-sectional survey collects detailed information on socioeconomic status, anthropometric measures, biochemical profiles, and health and nutritional status with three component surveys, including the Health Interview, the Health Examination, and the Nutrition Survey. The representative households were selected using a stratified and multi-stage clustered probability sampling design, where individuals aged 1 year and over were targeted for the survey. KNHANES used a two-stage stratified clustering. In the first stage, 192 primary sampling units (PSUs) in geographically determined sampling units were examined according to the administrative district and type of housing. A systematic sampling system was applied to each PSU, which had an average of 60 households, based on the residential area, age, and gender, and extracted 20 households from each PSU. The Health Interview and Health Examination were performed by trained medical staff and interviewers at a mobile examination center. Afterwards, dieticians visited the homes of participants for the Nutrition Survey. A total of 22,948 out of 29,321 (78.3%) sampled persons participated in at least one of the three components in the 6th KNHANES (2013–2015). In addition, the first year of the 7th KNHANES (2016) response rate was 75.4%; 8,150 of 10,806 sampled persons participated in at least one of the three components. The detailed description of the KNHANES design and data profile has been published previously as a separate paper [15]. Data used in the current study were derived from 2,454 adolescents aged between 12 and 18 years who had completed the three component surveys from the 6th KNHANES (2013–2015) to the 7th KNHANES (2016).
Using this nationally representative database, we can obtain useful epidemiological information on depressive mood in Korean adolescents, including the overall prevalence rate, factors related to depressive mood in adolescents, as well as their home environment and the socioeconomic status of their mother.
Measures
We extracted variables that might affect depressive mood in adolescents based on information from previous studies of adolescents [16] and variables that are thought to be related to serum lipid profiles in adolescents have also been determined through previous studies [17]. Information about these variables was available through the Health Interview of adolescents and their mothers, and the Health Examination and Nutritional Survey of adolescents. We considered age, body-mass index (BMI), household income, daily total energy intake, daily total fat intake, and daily total cholesterol intake as confounding factors affecting depression in adolescents and their serum lipid profiles.
In the current study, we classified those who answered “yes” in an item in the Health Interview, “Have you ever experienced feelings of sadness or despair that interfered with daily life and persisted for longer than 2 weeks in the past year?,” as those with a depressive mood.
In the mother-related variables, the education level of the mother was divided into 2 groups according to the total education period. Perceived heath condition of mother during the last 2 weeks was categorized into 5 groups, including very poor, poor, fair, good, and very good. Household income was classified into 2 groups. Groups with a household income less than the 25th percentile were classified as the “low” group, while those in the 25th percentile or more were classified as the “middle-high” group. Maternal diagnosis of depression was based on the health interview regarding past medical history of diagnosed depression.
Using the Least-Mean-Square (LMS) estimates presented in the 2017 Korean national Growth Chart, the BMI collected from the KNHANES was converted to a z-score relative to the age of the participants [18]. It was indicated by percentile, and categorized into 4 groups as follows: underweight (below the 15th percentile), normal, overweight (from the 85th to the 95th percentile), and obese (above the 95th percentile).
To measure blood lipid levels, blood samples were collected after at least 8 h of fasting from subjects who agreed to provide blood. Total cholesterol, HDL-C, LDL-C, and TG were measured by an enzymatic method using a Hitachi Automatic Analyzer (Hitachi, Japan). HDL-C was measured according to the Lipid standardization program by the US Centers for Disease Control. To determine LDL-C levels, in 2013–2014 we used either direct measurement (TG ≥200 mg/dL) or calculated the Fried-Wald equation (TG <200 mg/dL) according to the TG level. In 2015–2016, all participants had their LDL-C level measured using a direct method. Information regarding nutrient intake was obtained through a 24-h recall dietary questionnaire.
We classified total cholesterol, HDL-C, LDL-C, and TG levels as either acceptable, borderline, or abnormal levels, and the reference values were determined as follows based on the National Cholesterol Education Program (NCEP) Expert Panel III guideline for children and adolescents [19]: total cholesterol: 170 mg/dL; HDL-C: 45 mg/dL; LDL-C: 110 mg/dL; TG: 90 mg/dL. In the case of total cholesterol, LDL-C, and TG, if the measured value was higher than the reference value it was regarded as borderline or abnormal. The range for a borderline level of total cholesterol was determined as 170–199 mg/dL, 110–129 mg/dL for LDL-C, and 90–129 mg/dL for TG. The serum lipid level above these borderline levels was classified as being abnormal. Conversely, in the case of HDL-C, if the measured value was lower than the reference value it was regarded as borderline or abnormal. The range for a borderline level of HDL-C was 40–45 mg/dL, and if the level was below this, it was classified as an abnormal level.
Statistical analysis
Statistical analyses were conducted with SPSS software version 24.0 (IBM Co., NY, USA). Since the data of KNHANES were collected through stratification, clustering, and systematic sampling, we used analytical methods for complex samples and followed the KNHANES analysis guidelines published by the Korea Center for Disease Control and Prevention [20].
To assess the Korean population of adolescents, the sample weights assigned to participants were applied to all analyses. The sample weights were generated by considering the complex sample design and taking into account the following three factors. Design weight is a reciprocal of the probabilities of the selection of PSU and household, and weight of adjustment for non-response is a reciprocal of the non-response rate of household and person. The post-stratification factor generated the survey result estimates for age, sex, and residential area categories approximately equal to the total population in Korea [21]. Data are presented as the weighted percentage for categorical variables and the weighted mean±standard error (SE) for continuous variables.
To evaluate the differences in the baseline characteristics according to the dichotomous variables of the presence depressive symptoms and sex, categorical variables were analyzed using a Rao-Scott χ2 test. In addition, multiple logistic regression analyses were performed to correct for variables that were considered to be significant in the simple logistic regression, as well as other variables associated with depressive mood or serum lipid profiles. Therefore, we evaluated the association between serum lipid levels and depressive mood after adjusting for age, household income, total energy intake, total fat intake, and total cholesterol intake.
Ethics statement
All procedures and the protocol for this study were approved by the Institutional Review Board of the KCDC (2013-07CON-03-4C, 2013-12EXP-03-5C, 2015-01-02-6C). Informed consent was submitted by all subjects when they were enrolled in the parent study.
RESULTS
Characteristics of the subjects according to sex
The characteristics of the study population by sex are presented in Table 1. Of the 2,454 subjects, 51.9% were boys and 48.1% were girls. A depressive mood was reported in 8.7% of the total number of participants, and girls reported more depressive mood (boys: 6.6%; girls: 11.0%; p=0.002). The mean total cholesterol, HDL-C, and LDL-C values in girls were significantly higher than those in boys. However, there was no significant difference in the mean TG value. Regarding dyslipidemia, especially in total cholesterol and HDL-C, there was a statistically significant difference in the proportions belonging to each category according to sex. The characteristics of the maternal factors did not differ between the sexes; however, the percentage of low household income was significantly higher in girls (p=0.03).

Characteristics of subjects according to sex
Characteristics of the subjects according to depressive mood
An analysis was conducted on a total of 1,157 boys and 1,051 girls, since 116 boys and 130 girls missed the question about depressive mood. As we found that there were differences in depressive mood and lipid profiles between the sexes, the data from boys and girls were examined in separate analyses. The factors associated with depressive mood are presented Table 2. There was no significant difference in any of the BMI categories regarding depressive mood in either boys or girls. The mean LDL-C value was higher in boys with depressive mood showing marginal significance compared to those without depressive mood (p=0.05). There was a significant difference of categorized LDL-C among boys with or without depressive mood (p=0.01). In girls, we could not find any difference in the lipid profile according to depressive mood.

Factors associated with depressive mood
Association between serum lipid levels and depressive mood
The results of the multiple logistic regression analysis adjusting for age, household income, daily energy intake, daily fat intake, and daily cholesterol intake are summarized in Table 3. In boys, borderline and higher levels of LDL-C were significantly associated with depressive mood [borderline level: odds ratio (OR)=5.55, 95% confidence interval (CI) 1.56–19.81; higher level: OR=5.73, 95% CI 1.06–31.08], and the borderline level of total cholesterol was significantly associated with depressive mood (OR=2.04, 95% CI 1.04–4.00). However, this association was not present in girls.
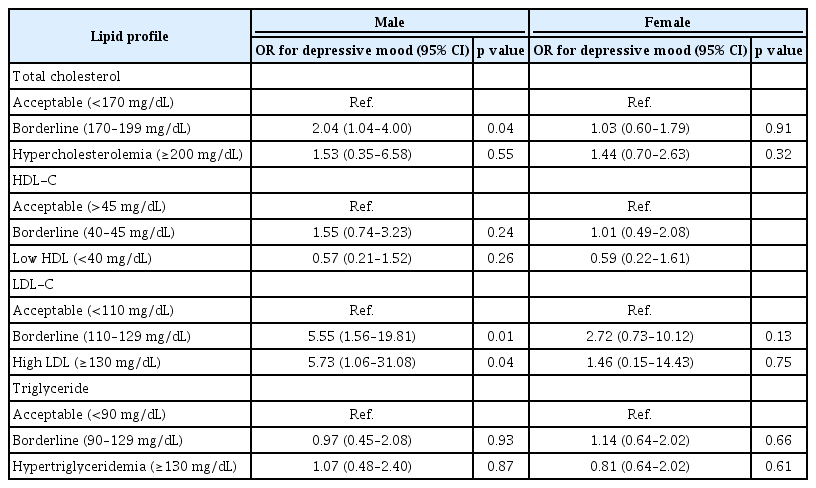
Multiple logistic regression analysis of depressive mood
DISCUSSION
Our results indicated that LDL-C level could be related to the risk of depression, especially in boys. We found that boys with borderline and high LDL-C had a higher prevalence of depressive mood than those with acceptable levels of LDL-C. Unlike boys, there was no correlation between depressive mood and dyslipidemia in girls.
Most past studies regarding the relationship between the serum lipid profile and psychiatric illnesses in adolescents that have been published thus far were mainly conducted in an inpatient setting [11,12]. To our knowledge, the current study was the first study to use a nationwide and representative sample of the general population, especially youth groups. The current study targeted a large community-dwelling population as opposed to inpatient subjects, and the results suggest that there is a difference in the relationship between depressive mood and lipid levels according to sex in the general population. In addition, the data from KNHANES helped us to adjust for a wide range of covariates when assessing the relationship between lipid levels and depressive mood.
In our analysis, the relationship between depressive mood and cholesterol level differed by sex. This finding is in line with previous adult studies [22,23]. Lindberg et al. [22] conducted a study on 729 male and 337 female employees; they reported that total cholesterol and LDL-C values were lower in men who reported low mood or glumness compared with those who did not. However, in women, the TG value, but not the total cholesterol or LDL-C values, was lower in those who experienced low mood, depression, or anxiety. Tedders et al. [23] also reported different results depending on sex. They used data from 4,115 men and 4,275 women aged 18 or older (average of age 46) in the National Health and Nutrition Examination Survey 2005–2008 of the US household population. They reported a U-shaped relationship in which the lower quartile and upper quartile LDL-C values were related to increased odds of severe depression in male subjects. However, in female subjects, lower HDL-C was associated with severe depression when compared with the upper quartile of HDL-C. To explain such sex differences, Ancelin et al. [24] suggested that lower serotonin transporter gene linked promoter region (5-HTTLPR) activity associated with the s allele may contribute to an increased vulnerability for depression in the presence of lower LDL-C levels in men.
In adolescent studies, there has been little evaluation of the relationship between depressive mood and lipid levels according to sex. Thus, it is noteworthy that in our study the relationship between depressive mood and lipid levels was classified according to sex. Our results suggest that adolescents also differ with regard to the relationship between depressive mood and lipid levels according to sex, as with the results of the adult studies discussed above.
Several hypotheses have been put forth to explain the mechanisms underlying the observed correlations between lipid levels and depression. Many researchers have discussed the associations between cholesterol, serotonin, and depression. Papakostas et al. [25] proposed that a high cholesterol level is responsible for the decrease in the sensitivity of the serotonin receptor. Cholesterol has an important role in cell membrane structure since these lipid microdomains influence the fluidity of the lipid bilayer and signal transduction. Therefore, it has been proposed that an altered cholesterol level may modulate the functional properties of the serotonin transporter. Although a number of studies have suggested that a low cholesterol level could result in alterations in the properties of the serotonin transporter in the cell membrane within the central nervous system [26], others have insisted that elevated cholesterol levels could also influence the properties of the serotonin transporter [27]. The present results support the idea that both increased and decreased cholesterol levels are associated with serotonergic dysfunction. Interactions between stress, lipid profiles, and the HPA-axis have also been proposed. According to the stress-induced lipolysis model [28], higher levels of cholesterol could be due to increased secretion of cholesterol in the liver, and this is usually derived from free fatty acid secretion in adipose tissues when high levels of serum epinephrine exist under stressful conditions.
There are some limitations to our analysis. First, the original survey had a cross-sectional design, so we could not prove the causality between dyslipidemia and depressive mood. Second, because we could not use a structured or semi-structured diagnostic instrument and the confirmation of diagnoses by experts, we designated subjects with depressive mood using only a single mood symptom item. Therefore, the findings in the current study may not be generalizable to subjects clinically diagnosed with major depressive disorder. Third, although we considered most covariates that can affect mood in adolescents, there could be other confounding factors that might potentially influence the current findings. In the present study, only one question about depressive mood was used to assess the association with lipid levels, but further studies could be conducted using validated diagnostic tools to systematically assess adolescent depression. Moreover, we only assessed the association between dyslipidemia and depressive mood in adolescents and did not assess the association between low lipid levels and depressive mood. More research is needed to determine whether the relatively low levels of LDL-C evaluated as meaningful in this study are associated with depressive mood.
In conclusion, this study shows a relationship between high LDL cholesterol levels and increased depressive mood among boys in a community-living younger population in Korea. This finding emphasizes the idea that dyslipidemia may play a role in depression, not only in adults but also in adolescents, and that treatment of borderline or abnormal cholesterol levels is also required in this group.
More studies are needed to explain the differing effects of abnormal serum cholesterol levels between adolescent boys and girls, and the causal relationship between dyslipidemia and depressive symptoms.
Notes
The authors have no potential conflicts of interest to disclose.
Author Contributions
Conceptualization: Jun-Won Hwang, Jeana Hong, Eun ji Kim. Data curation: Jun-Won Hwang, Jeana Hong, Eun ji Kim. Formal analysis: Jeana Hong. Investigation: Jun-Won Hwang, Jeana Hong, Eun ji Kim. Methodology: Jun-Won Hwang, Jeana Hong, Eun ji Kim. Project administration: Jun-Won Hwang, Jeana Hong, Eun ji Kim. Resources: Jun-Won Hwang, Jeana Hong, Eun ji Kim. Software: Jun-Won Hwang, Jeana Hong, Eun ji Kim. Supervision: Jun-Won Hwang, Jeana Hong. Validation: Jun-Won Hwang, Jeana Hong, Eun ji Kim. Visualization: Jun-Won Hwang, Jeana Hong, Eun ji Kim. Writing—original draft: Jun-Won Hwang, Jeana Hong, Eun ji Kim. Writing—review & editing: Jun-Won Hwang, Jeana Hong, Eun ji Kim.