Risk and Protective Factors for the Onset of Cognitive Impairment in Korea: A 10-Year Longitudinal Panel Study
Article information

Abstract
Objective
This study aimed to examine the associations between multiple modifiable risk/protective factors and the onset of cognitive impairment, using nationally representative panel data spanning 10 years.
Methods
A total of 7,568 respondents who were cognitively normal at baseline were included and followed up for 10 years using data from the 2006–2016 Korean Longitudinal Study of Ageing. The data were converted into 28,113 person-year observations, and a life table approach and a series of event history models were used to estimate the transition rates to cognitive impairment over time and to examine the influence of time-varying factors on the onset of cognitive impairment. Cognitive impairment was measured using the Korean version of the Mini-Mental State Exam.
Results
About half of the respondents without cognitive impairment at baseline had experienced cognitive impairment by the end of the last interview, and women were more likely than men to experience cognitive impairment during the observation period. Vascular risk factors, hearing loss, socioeconomic status, regular exercise, participation in social activities, and frequent contact with close friends were significantly associated with the onset of cognitive impairment.
Conclusion
This investigation of modifiable factors for cognitive impairment using population-based data may lead to the identification of preventive strategies that people could integrate into their lifestyles.
INTRODUCTION
As life expectancy and the proportion of older adults in the population increase in South Korea (hereafter Korea), healthy aging and the overall quality of life among the older adult population have emerged as major social issues. Cognitive impairment and dementia constitute well-known risk factors preventing “successful aging,” potentially reducing the cognitive ability and adequate physical functioning required for an individual to lead an independent life [1]. Although cognitive impairment is an inevitable consequence of reaching old age and disease-modifying treatment of severe cognitive impairment is currently unavailable, it is now known that more than one-third of cases of cognitive impairment and dementia may be attributable to modifiable risk factors, meaning that it may be possible to prevent or delay the onset of cognitive impairment [2].
A large body of research, mostly conducted in Western countries, has highlighted multiple protective and risk factors associated with the onset of cognitive impairment, including the early-life environment, vascular risk factors, hearing loss, physical activities, socioeconomic status, health behaviors, and social engagement. This research has not identified any single factor that sufficiently explains the onset of cognitive impairment because multiple factors have different influences throughout an individual’s life-course [3,4]. Despite the fact that identifying the modifiable factors for cognitive impairment is of utmost importance, only a handful of studies have examined these factors in Korea [5-10]. Surprisingly, most existing research on cognitive impairment in Korea has been based on cross-sectional data on subpopulations from specific residential areas or clinics [6,8-10]. Results based on cross-sectional data and small, non-representative samples may have inherently limited generalizability, are subject to reverse causality, and have considerable potential bias because of highly selective recruitment [3]. Even the few previous studies using longitudinal data [5,7] were based on subpopulations and had short follow-up periods; therefore, these studies were unable to examine the long-term factors for cognitive impairment among the general population.
One exception was a study conducted by Lyu and Kim [11], which examined gender-specific risk factors for the incidence of cognitive impairment, using nationally representative biannual longitudinal data from the Korean Longitudinal Study of Ageing (KLoSA). These researchers found that vascular risk factors, physical activities, poor hearing, depression, and regular exercise increased the risk of cognitive impairment. Although Lyu and Kim’s study filled a gap in the literature, it could not fully reflect the dynamic aspects of modifiable factors for cognitive impairment by using only two waves of data, 2006 and 2012; the 6-year gap between the observation of the predictor and the outcome variables and the imprecise examinations of the timing of cognitive impairment by excluding the 2008 and 2010 data.
To address these limitations in previous work, the present study used all waves of data on a nationally representative sample over a 10-year period to examine the modifiable risk and protective factors for the onset of cognitive impairment. More specifically, taking a life-course perspective, this study examined the transition and timing of cognitive impairment by estimating life tables. In addition, the present study used event history analysis to identify the dynamic aspects of risk and protective factors for the transition to cognitive impairment. To do this, the study considered modifiable factors as time-varying and examined the influence of predictors on the odds of cognitive impairment.
METHODS
Study sample
Data for this study came from the KLoSA, a nationally representative longitudinal survey of non-institutionalized Koreans 45 years old or older, that has been conducted every two years since 2006 [12]. For this study, 6 waves of KLoSA were utilized, conducted from 2006 to 2016. In the KLoSA, multiple birth cohorts were interviewed in 2006 (n=10,254) and monitored with five follow-up surveys in 2008 (n=8,688), 2010 (n=7,920), 2012 (n=7,486), 2014 (n=7,029), and 2016 (n=6,618). Most attrition in subsequent waves was because of non-response (n=2,691) or death (n=994). For the life table and the event history analyses, the analytic sample was restricted to those who had no missing information on cognitive function (excluding 213 respondents) and had not experienced cognitive impairment (excluding 2,473 respondents) at the time of the baseline survey in 2006, leaving 7,568 respondents for analysis. The data were then converted into person-year observations, with observations beginning at the first wave and ending at the onset of cognitive impairment, the most recent interview, or the survey wave where there was missing information on cognitive function (28,113 person-year observations). This study was thus able to examine the associations of modifiable factors with the transition from normal cognitive status to cognitive impairment during the observation period. This study was approved by the Institutional Review Board of Kangwon National University (IRB number: KWNUIRB-2020-02-005).
Measures
Cognitive impairment
Cognitive impairment was assessed using the Korean version of the Mini-Mental State Exam (MMSE). The MMSE has been widely employed for evaluating global cognitive health status [13] and is generally considered more appropriate for identifying a “demented state,” compared with tests exploring specific cognitive domains [14]. Total scores range from 0 to 30, with higher scores indicating higher cognition status. Following previous work [14], in the present study, the algorithmic diagnosis of cognitive impairment was defined as having an MMSE of less than 24 points (coded as cognitive impairment=1; otherwise, normal status=0).
Modifiable risk and protective factors
First, vascular risk factors were considered using self-reported diagnosis of hypertension (yes=1, no=0), diabetes (yes=1, no=0), cerebrovascular disease (yes=1, no=0), heart disease (yes=1, no=0), and obesity (yes=1, no=0) in each survey wave. Next, hearing loss, which was treated as a time-varying binary variable identifying whether a respondent had difficulties in daily living because of poor hearing (yes=1, no=0), was included. Third, education, working status, and household income were included as indicators of socioeconomic status. Education was modeled using three dummy variables (less than high school=0, complete high school=1, and college or higher=2), and employment status was coded to compare those who were currently employed (=1) with others (=0) in each survey wave. Total household income was measured with quartiles within each survey wave. The fourth group of variables considered were health behaviors, assessed with time-varying variables for regular exercise (yes=1, no=0) and never having smoked (yes=1, no=0). Fifth, social activities and relationships were included, using participation in socially productive activities and the frequency of contact with close friends in each survey wave. Engagement in socially productive activities was measured using the frequency of participation in any of the following: church or other religious gatherings, friendship organizations, leisure/sports activities, alumni associations, volunteering, and political gatherings. This variable was categorized into three groups: never or almost never participated in any activities (=0), participated once or twice a month (=1), and participated almost every week or more (=2). Social relationships were gauged using the frequency of contact with close friends, categorized into three groups: never or almost never (=0), once or twice a month (=1), and almost every week or more (=2). Besides modifiable factors, this study also considered the socio-demographic variables, including age, gender, marital status, and residential status.
Analytic plan
Using the person-year data file, this study constructed life tables to estimate the transition rates to cognitive impairment over time during the observation period. By estimating the transition rates and survival rates in each survey wave, the study was able to determine how many respondents who were cognitively normal at baseline experienced cognitive impairment, as well as when these transitions occurred. In addition, the study estimated these transition rates by gender and birth cohort to detect gender and cohort differences in the onset of cognitive impairment. After estimating the life tables, this study used a series of event history models to examine the influence of modifiable factors on the transition to cognitive impairment. In this part of the analysis, Models 1–5 predict the odds of cognitive impairment associated with the different modifiable factors, controlling for the socio-demographic variables described above: Model 1 includes vascular risk factors, Model 2 examines hearing loss, Model 3 includes socioeconomic status, Model 4 examines health behaviors, and Model 5 includes social activities and relationships. The final model, Model 6, is the full model, which includes all modifiable factors.
RESULTS
Descriptive statistics
Table 1 presents weighted descriptive information on the variables examined in the analysis at baseline (2006). The mean age of the respondents was 56 years, and about half were women. About 4 in 10 respondents had a middle school education or lower, and only 15% had a college education or higher. Among the examined vascular risk factors, hypertension and obesity were the most prevalent, seen in 22% and 24% of the respondents, respectively. Only 2% of the respondents had difficulties in daily living because of poor hearing. About 45% of the respondents exercised regularly, and 66% had never smoked. Roughly 7 in 10 respondents engaged in some type of social activity more than once a month, and about 63% were in contact with close friends almost every week or more.
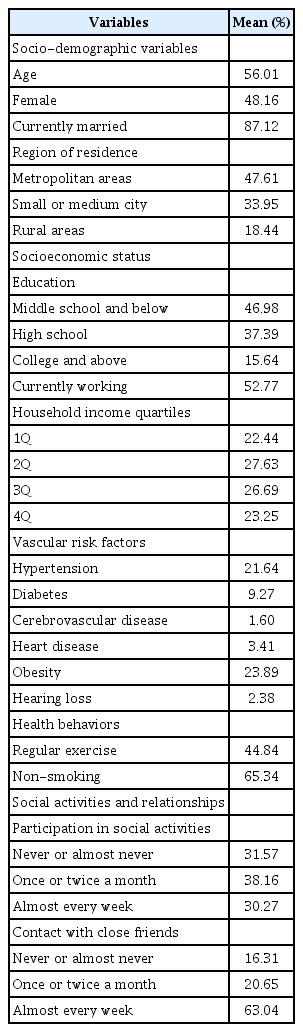
Weighted descriptive statistics of the analytic sample in 2006 (N=7,568)
Life table estimates
Table 2 presents the transition rates from normal cognitive status to cognitive impairment across waves by gender and birth cohort, estimated using a life table approach. At Wave 1, no respondents had experienced cognitive impairment. About 11% of the respondents then experienced cognitive impairment between Waves 1 and 2. As the number of observation waves progressed, the proportion of respondents who had ever experienced cognitive impairment increased, with about half of the respondents having experienced cognitive impairment by the last survey wave. In addition, women were more likely than men to experience cognitive impairment during the observation period, with 57% of men and 45% of women never having experienced cognitive impairment at the last survey wave. As expected, the risk of experiencing cognitive impairment increased with age: only 15% of those aged 61–93 years at baseline survived to the last wave without experiencing cognitive impairment, whereas the corresponding rate was 78% among those aged 45–50 years at baseline.
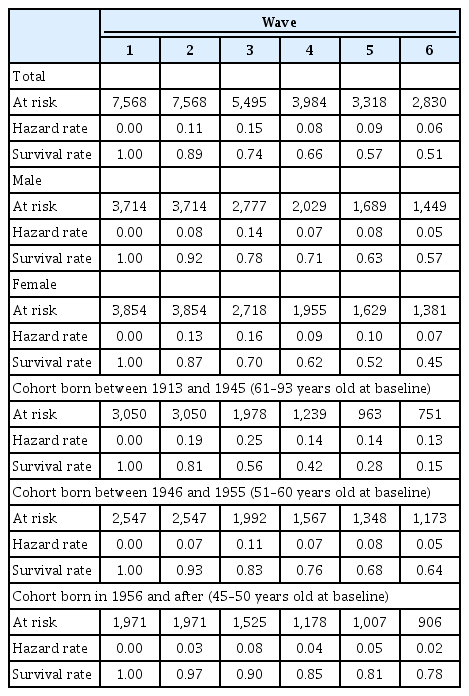
Percentage experiencing cognitive impairment among respondents who were cognitively normal at baseline by gender and birth cohort (N=7,568; 28,113 person-years)
Modifiable factors for the onset of cognitive impairment: event history analysis
Table 3 presents the coefficients and odds ratios from the multivariate models predicting cognitive impairment among those who were cognitively normal at baseline. Model 1 examined the associations of vascular risk factors with the onset of cognitive impairment, controlling for survey wave and socio-demographic factors. Self-reported diagnoses of hypertension, diabetes, and cerebrovascular disease were found to be significant predictors of cognitive impairment, with respondents who had these conditions being more likely to experience cognitive impairment, compared with respondents who did not have these conditions. More specifically, having hypertension elevated the odds of cognitive impairment by about 12%, and a self-reported diagnosis of cerebrovascular disease increased these odds by about 66%. Obesity was not found to be a significant predictor of cognitive impairment. To examine whether the association between obesity and cognitive impairment may change with age, I conducted an additional analysis by adding the interaction term of age and obesity to Model 1 (not shown but available upon request). After adding this interaction term, the coefficient of obesity became statistically significant (b=1.1, p<0.01), and the age-obesity interaction term was negatively associated with cognitive impairment (b=-0.17, p<0.01).
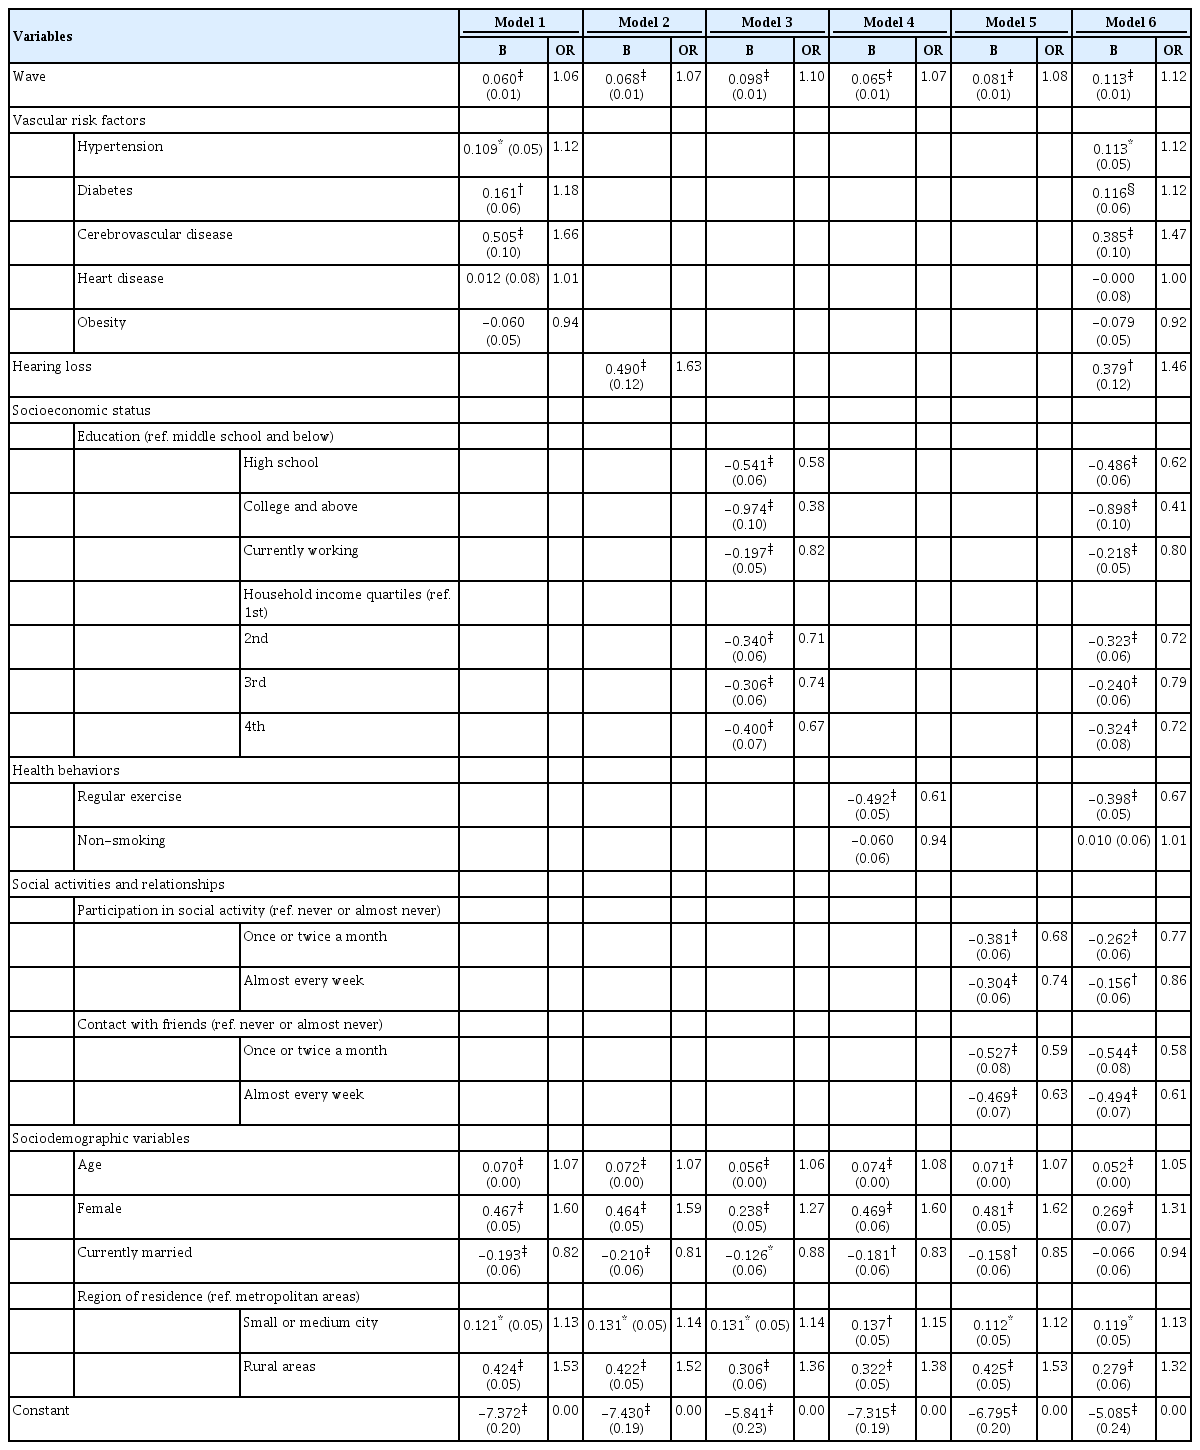
Logistic regression models predicting cognitive impairment (N=7,568; 28,113 person-years)
Model 2 shows that hearing loss was a key risk factor for cognitive impairment: The odds of experiencing cognitive impairment were about 60% higher among people with poor hearing than among those whose hearing was not impaired. In Model 3, indicators of higher socioeconomic status, including education, employment status, and household income, were significantly associated with a reduction in the odds of cognitive impairment. The results indicate that the odds of experiencing cognitive impairment were 40% lower for respondents with a high school degree and about 60% lower for respondents with a college education, compared with the same odds for those with middle school or less education.
The health behaviors introduced in Model 4—especially regular exercise—decreased the risk of cognitive impairment: The odds of experiencing cognitive impairment were about 40% lower among respondents who exercised regularly than among those who did not. In contrast to exercise status, smoking was not a key risk factor for cognitive impairment. Smoking was significantly associated with cognitive impairment in the bivariate model, but, after controlling for gender, this association became non-significant. In Model 5, social activities and relationships were shown to work as protective factors for cognitive impairment. Participating in social activities more than once a month appeared to lower the odds of experiencing cognitive impairment. Likewise, frequent contact with close friends also decreased the odds of cognitive impairment. In the full model including all modifiable factors (Model 6), vascular risk factors, hearing loss, socioeconomic status, regular exercise, participation in social activities, and social relationships were found to work as important risk or protective factors for cognitive impairment, although the size of the coefficients was smaller, compared with the previous models.
DISCUSSION
Advancing population health research on the modifiable factors associated with cognitive impairment in Korea is important, given the nature of cognitive impairment, which occurs mainly in people aged older than 65 years, who make up a continuously increasing share of the population in Korea [20]. Scholars studying Western populations have argued that more than a third of cognitive impairment cases are attributable to modifiable factors [2], but little is known regarding the influences of modifiable factors on cognitive impairment in Korea. This study thus attempted to address this research gap and revealed following findings.
First, vascular risk factors, including hypertension, diabetes, and cerebrovascular disease, increase the risk of cognitive impairment. This is consistent with previous studies arguing that brain health is largely affected by the condition of the blood vessels and heart; a healthy heart can pump enough blood, and healthy blood vessels enable the nutrition-rich blood to reach the brain [15-18]. Interestingly, the present study revealed that the association between obesity and cognitive impairment changes with age: being overweight in midlife increases the risk of cognitive impairment, but late-life obesity does not. This finding is congruent with previous studies [19,20] that have argued that being moderately overweight may be an indicator of good health among older adults.
Second, consistent with previous studies [21-23], the present study found that hearing loss works as an important risk factor for cognitive impairment. Scholars have argued that poor hearing is a harmful risk factor that is relevant to many older adults because the risk of hearing loss progressively increases with age [24]. The underlying mechanism linking hearing loss and cognitive impairment is as yet unclear, but hearing loss may aggravate the cognitive load on a vulnerable brain [25] or lead to social disengagement and isolation [26,27]. Any interventional programs should be considered to increase the use of assistive listening devices by providing affordable hearing aids as soon as possible after hearing loss is identified.
The third main finding of the present study was that indicators of socioeconomic status, including education, employment, and income, are important predictive factors for cognitive impairment. Several mechanisms have been suggested to explain these associations. Education may be a part of a causal chain, wherein education leads to other socioeconomic resources, including a better job and higher income, and to health-promoting circumstances, such as better access to health care and medical treatment, a healthier lifestyle, and residence in healthier neighborhoods [15,28]. In addition, education may enhance an individual’s cognitive reserve, which is the brain’s ability to cultivate the efficient use of cognitive networks, enabling a person to continuously perform cognitive tasks and to deal with pathological damage to the brain [28-31].
Fourth, regular exercise may prevent or delay the onset of cognitive impairment, but it appears that smoking status does not, which is consistent with previous studies in Korea [11,32]. Regular exercise and physical activities are important protective factors for cognitive impairment, although little is known regarding the types or frequencies of exercise that are most efficient for reducing the risk of cognitive impairment [15]. The potential mechanisms for physical exercise to improve cognition operate through other modifiable risk factors, including lowering the risks of hypertension and general cardiovascular disease, as well as through direct neurological effects, including increasing neurogenesis and cerebral blood flow [33-35].
Finally, in line with previous studies [15,36-38], the present study provides evidence that active engagement in social activities and frequent contact with close friends may lower the risk of cognitive impairment. Participation in social activities and good social relationships with close friends may provide important opportunities to enjoy a more socially integrated lifestyle, to be physically active, to have frequent social interactions, and to share material and psychological resources, potentially leading to the prevention of cognitive impairment [36-40] Given the importance of social engagement and social networks, it is crucial to provide opportunities for participation in social activities through various social welfare programs.
This study has several limitations that should be considered. First, sample selection bias may have been introduced by including only respondents who were cognitively normal at baseline: Because unhealthy older adults were at higher risk of cognitive impairment at baseline, healthier older adults were more likely to be included in the sample. Second, although the MMSE has been used globally for detecting cognitive impairment in large populations, it does not assess specific cognitive domains. Future studies should examine the influence of modifiable factors on specific cognitive domains, using data including the medical diagnosis of cognitive impairment based on clinical evaluation among the general population. Finally, although the present study included several risk/protective factors as well as socio-demographic variables, other important factors (i.e., cognitive reserve) may influence cognitive impairment, and these variables should be considered in future analyses.
Despite these limitations, the current study contributes to advancing knowledge about cognitive impairment by investigating modifiable factors associated with cognitive impairment in a large, population-based dataset. This research has led to the identification of preventive strategies that people could integrate into their lifestyles. In addition, the study may also contribute to the establishment of interventional public health programs aiming to reduce the risk of cognitive impairment.
Acknowledgements
The study was supported by the Ministry of Education of the Republic of Korea and the National Research Foundation of Korea (NRF-2019S1A5A 8032299).
Notes
The author has no potential conflicts of interest to disclose.