State and Trait Anxiety Related Gamma Oscillations in Patients With Anxiety Within the Research Domain Criteria Framework
Article information

Abstract
Objective
Diagnosis of anxiety has relied primarily on self-report. This study aimed to investigate the neural correlates of anxiety with quantitative electroencephalography (qEEG) focusing on the state and trait anxiety defined according to the Research Domain Criteria framework existing across the differential diagnosis, rather than focusing on the diagnosis.
Methods
A total of 41 participants who visited a psychiatric clinic underwent resting state EEG and completed the State-Trait Anxiety Inventory. The absolute power of six frequency bands were analyzed: delta (1–4 Hz), theta (4–8 Hz), alpha (8–10 Hz), fast alpha (10–13.5 Hz), beta (13.5–30 Hz), and gamma (30–80 Hz).
Results
State anxiety scores were significantly negatively correlated with absolute gamma power in frontal (Fz, r=-0.484) and central (Cz, r=-0.523) regions, while trait anxiety scores were significantly negatively correlated with absolute gamma power in frontal (Fz, r= -0.523), central (Cz, r=-0.568), parietal (P7, r=-0.500; P8, r=-0.541), and occipital (O1, r=-0.510; O2, r=-0.480) regions.
Conclusion
The present study identified the significantly negative correlations between the anxiety level and gamma band power in fronto-central and posterior regions assessed at resting status. Further studies to confirm our findings and identify the neural correlates of anxiety are needed.
INTRODUCTION
The Diagnostic and Statistical Manual of Mental Disorders (DSM), which is a widely used classification system of mental health and disease, makes diagnostic deductions based on symptoms and behaviors reported by patients or observed by clinicians [1]. However, this diagnostic system is limited in that individuality is lost in evaluation, treatment, and prognosis because heterogeneously expressed symptoms are categorized as a part of a single disease entity. For instance, the diagnostic criteria for major depressive disorder in the Diagnostic and Statistical Manual of Mental Disorders, 5th ed (DSM-5) includes nine heterogeneous symptoms: depressed mood, diminished interest, sleep disturbances, psychomotor agitation or retardation, fatigue, worthlessness, cognitive dysfunction, and suicidal ideation [1]. In addition, although the symptom presentation of patients might vary widely, the diagnosis of major depressive disorder depends on counting the number of symptoms, which might result in lack of consideration of individuality in the evaluation and treatment process.
Another limitation of classic diagnostic systems in psychiatry, unlike other fields of medicine, is a lack of incorporating neuroscientific technology developed in recent decades for diagnostic purposes [2]. Reflecting the concerns for these limitations, the DSM-5 adopted a dimensional approach regarding psychiatric disorders, viewing them as spectral entities rather than as strictly categorical, and new research results have been reported based on this revised classification system [1].
Besides the changes in diagnostic systems, the Research Domain Criteria (RDoC) project was proposed by the National Institute of Mental Health in 2010 as a framework to integrate information from various sources and domains, including symptoms, genetics, neuroscience, and, physiology, as applied to understanding and conducting research regarding psychiatric disorders. RDoC is not a new classification system replacing the DSM, but a framework for the research of mental health and disease. RDoC includes six research areas (negative valence, positive valence, cognitive systems, systems for social processes, arousal/regulatory systems, and sensorimotor systems), with research being actively conducted worldwide [3]. For example, with respect to anxiety, there is an RDoC Anxiety and Depression project (RAD project), in which brain imaging has been used to establish and explain the association between brain-based constructs and anxiety symptoms [4].
Anxiety, one of the most common psychopathologies, is a complex physical and psychological emotional response. It is an unpleasant psychological state in which one might experience tension and irritability with the anticipation of a future threat [1]. It is often accompanied by various physiological responses of the autonomic nervous system, such as tachycardia, tremor, and dizziness as well as muscle tension and vigilance [1]. To assess the severity of anxiety symptoms in patients, the State- Trait Anxiety Inventory (STAI) is one of the most widely used self-reporting checklists for the assessment of anxiety symptoms [5]. The STAI consists of two subdomains: state anxiety evaluates the intensity of current feelings “at this moment” and trait anxiety assesses the proneness to anxiety as a temperamental trait [5]. Although both share common features in that they assess the anxiety of an individual, they are reported to have some distinct neurobiological characteristics. For instance, a functional imaging study reported that while the anterior insula and basolateral amygdala constitute a network linked to both, state and trait anxiety are distinctively linked to dynamic functional and more static structural neural aspects, respectively [6]. Differences between state and trait anxiety are also observed in clinical tasks assessing the performance of executive function. Ursache and Raver [7] reported that higher trait anxiety predicted lower performance in a Stroop task evaluating executive function whereas higher state anxiety was associated with better performance.
The assessment of psychiatric symptoms has relied primarily on self-report. However, in recent years, there have been increasing reports that electroencephalography (EEG) might be helpful in the assessment of the mental health disorders [8,9]. In particular, quantitative electroencephalography (qEEG) is a neurological technique that analyzes the spectral band power of the delta (1–4 Hz), theta (4–8 Hz), alpha (8–13 Hz), beta (13.5–30 Hz), and gamma (30–80 Hz) frequency bands. qEEG has several benefits over other neuroimaging techniques, in that it is non-invasive with no radiation exposure, it has excellent time resolution, and a low inspection cost [10,11]. While qEEG can assist the physician in making a diagnosis, it can do more than simply detecting EEG abnormalities and helping form a diagnosis [10,12]. qEEG has also been applied in studies investigating disorders that are associated with anxiety, such as panic, posttraumatic stress (PTSD), and obsessive-compulsive disorder (OCD) [9,13,14]. For instance, studies have reported diminished alpha activity in anxiety disorder [15-17] and increased theta activity in OCD [18,19]. However, compared to other psychiatric disorders, the literature on qEEG and anxiety disorder is small and difficult to translate to the clinical setting due to the heterogeneity of symptoms among the disorders included in anxiety disorders [10,20].
Thus, the present study aimed to investigate the neural correlates of anxiety with qEEG focusing on the state and trait anxiety defined according to the RDoC framework existing across the differential diagnosis, rather than focusing on the diagnosis. In pursuing this purpose, we used the self-reporting of outpatients to examine anxiety symptoms and the various factors that influence it, such as socio-demographic factors and depressive symptoms. After controlling for these factors, we expected to find that anxiety symptoms were independently related to qEEG.
METHODS
Participants
Individuals who visited the psychiatric clinic at Daegu Catholic University Hospital from 2017 to 2018 were considered for inclusion in the study. The inclusion criteria were 1) individuals with anxiety as the main symptom and between 19 and 70 years old and 2) STAI (state) or STAI (trait) score >40, meaning probable clinical levels of anxiety [21]. All participants were right-handed, and handedness was assessed with the Edinburgh Handedness Inventory. Individuals with brain damage, a neurological disorder, a genetic disorder, substance dependence, epilepsy or any other mental disorder (e.g., schizophrenia, bipolar disorder, and eating disorder) reported during a personal history and anamnesis were excluded from participation in this study. Individuals who exhibited an IQ of 70 or lower according to the Wechsler Adult Intelligence Scale, 4th edition, Korean version or who needed immediate intervention due to the possibility of self-harm and aggressive behavior were also excluded. Because all participants were either drugnaïve or had not taken psychoactive drugs for one month before participating in the study, we could exclude the influence of medications. Participants gave their informed consent after being given a complete description of the study. This study was approved by the Institutional Review Board (IRB) of the Daegu Catholic University Medical Center (DCUMC IRB approval No. CR-19-005) and was performed in accordance with the Declaration of Helsinki (World Medical Association: Ethical Principles for Medical Research Involving Human Subjects, 1964).
Depression assessment
The Beck Depression Inventory-II (BDI-II) measures the degree of severity of clinical depression symptoms [22]. It consists of 21 items scored on a scale from 0 to 3; items include cognitive, emotional, motivational, and somatic symptoms. The total score ranges from 0 to 63, and a higher total score means more severe depressive symptoms. In this study, we used the scale validated by Sung et al. [23].
Anxiety assessment
The STAI assesses anxiety in adults [5] and consists of two selfrating 20-items rated by 4 point-Likert scale, one measuring state anxiety and the other measuring trait anxiety. The state anxiety scale requires people to describe how they feel in the present. State anxiety scores increase in response to situational stress and decline under relaxed conditions. The trait anxiety scale asks people to indicate how they generally feel. Trait anxiety scores reflect relatively stable individual differences in anxiety proneness that are impervious to situational stress. This study used the Korean translation of the STAI from Kim and Shin [24], which has previously been shown to exhibit excellent psychometric properties, with an internal consistency reported at Cronbach’s α=0.91 [25].
Electroencephalography recording and pre-processing
This study’s methods (EEG recording, pre-processing, power spectrum analysis, and statistical analysis) were the same as the core methodology used in the authors’ previous studies [26-28]. In the past few years, the authors have studied the use of qEEG as a diagnostic marker for psychiatric disorders as described in the DSM-5, such as attention-deficit hyperactivity disorder and schizophrenia, using the same research methodology as in this study. Here, the existing EEG protocol was used to study the relationship between qEEG and anxiety symptoms in the RDoC framework.
The EEG recordings were performed using a SynAmps2 direct-current (DC) amplifier and a 10–20 layout 64-channel Quick-Cap electrode placement system (Neuroscan Inc., Charlotte, NC, USA). The EEG data were digitally recorded from 21 gold cup electrodes placed according to the international 10–20 system. The impedances were maintained below 5 kΩ, and the sampling rate was 1,000 Hz. We used the linked mastoid reference and two additional bipolar electrodes to measure the horizontal and vertical eye movements.
Matlab 7.0.1 (Math Works, Natick, MA, USA) and the EEGLAB toolbox [29] were used to pre-process and analyze the EEG recordings. First, the EEG data were downsampled to 250 Hz. Next, the EEG data were detrended and mean-subtracted to remove the DC component. A 1-Hz high-pass filter and a 60-Hz notch filter were applied to remove the eye and electrical noise. Next, independent component analysis (ICA) was performed to remove well-defined sources of artifacts. ICA has been demonstrated to reliably isolate artifacts caused by eye and muscle movements and heart noise [30]. Components that corresponded to eye blinking or muscle movement were identified using a published technique that compares favorably with other artifact rejection techniques [31]. We identified and removed at least one component that corresponded to muscle artifacts, and no detected residual muscle artifacts. Finally, clinical psychiatrists and EEG experts visually inspected the corrected EEGs. For the analysis, we selected more than two minutes of artifact-free EEG readings from the three-minute recordings.
Power spectrum analysis of the electroencephalography recordings
Six frequency bands were defined for further analysis: delta (1–4 Hz), theta (4–8 Hz), slow alpha (8–10 Hz), fast alpha (10–13.5 Hz), beta (13.5–30 Hz), and gamma (30–80 Hz). The spectral power of the EEG data was calculated via fast Fourier transformation using the “spectrogram.m” function of the signal processing toolbox in Matlab. Time windows of 1,000-ms with an 800-ms overlap and Hamming window were used for the spectral analysis. Finally, the absolute powers were averaged over all of the time windows and frequency bands for further analysis.
Statistical analyses
All of the values are expressed as mean and standard deviation. To assess the relationship between the state and trait anxiety scores and EEG recordings, we used a Pearson’s partial correlation analysis that controlled for age, sex, and BDI-II. Statistical significance was defined as p<0.0026 (0.05/19). To control for false positives from multiple comparisons, we used the Bonferroni correction in which the p-values were multiplied by the number of comparisons. To improve clarity, topographical plots of the results of the Pearson’s partial correlations are presented. All data were analyzed using the Statistical Package for the Social Sciences (SPSS) software, version 18.0 (SPSS Inc., Chicago, IL, USA).
RESULTS
Demographic and clinical data
Forty-one individuals (11 males and 30 females) voluntarily agreed to participate after receiving an explanation of the purpose and methodology of the study. The mean age of the participants was 53.00±13.56 years for males and 52.53±11.09 years for females. The average score of BDI-II for all participants was 31.10±12.52, which indicates that participants experience moderate to severe depressive symptoms. In case of the scores of state anxiety and trait anxiety, the average scores were 59.63±11.74 and 59.54±10.86, respectively, indicating mild to moderate symptoms of anxiety. Demographic and clinical data are summarized in Table 1.

Demographic data and cognitive function of subjects
Correlation analysis
Pearson’s partial correlation analyses were performed on the state and trait anxiety scores and EEG recordings. We found that the STAI scores were negatively correlated with the absolute gamma power. After applying the Bonferroni correction (p<0.0026), significant findings were revealed in both state and trait anxiety. First, state anxiety scores were significantly negatively partially correlated with the absolute gamma power in the frontal (Fz, r=-0.484) and central (Cz, r=-0.523) regions. Second, trait anxiety scores were significantly negatively partially correlated with the absolute gamma power in frontal (Fz, r=-0.523), central (Cz, r=-0.568), parietal (P7, r=-0.500; P8, r=-0.541), and occipital (O1, r=-0.510; O2, r=-0.480) regions. The partial correlations between the STAI scores and the absolute delta, theta, alpha, and beta powers were not statistically significant. The results of Pearson’s partial correlation analysis controlling for age, sex, and BDI-II between the STAI scores and absolute gamma power are presented in Table 2. The scatter plots and topographical features of the partial correlation are presented in Figure 1.

The results of the Pearson’s partial correlation analysis (corrected for age, sex, and BDI-II) between K-STAI and absolute gamma power
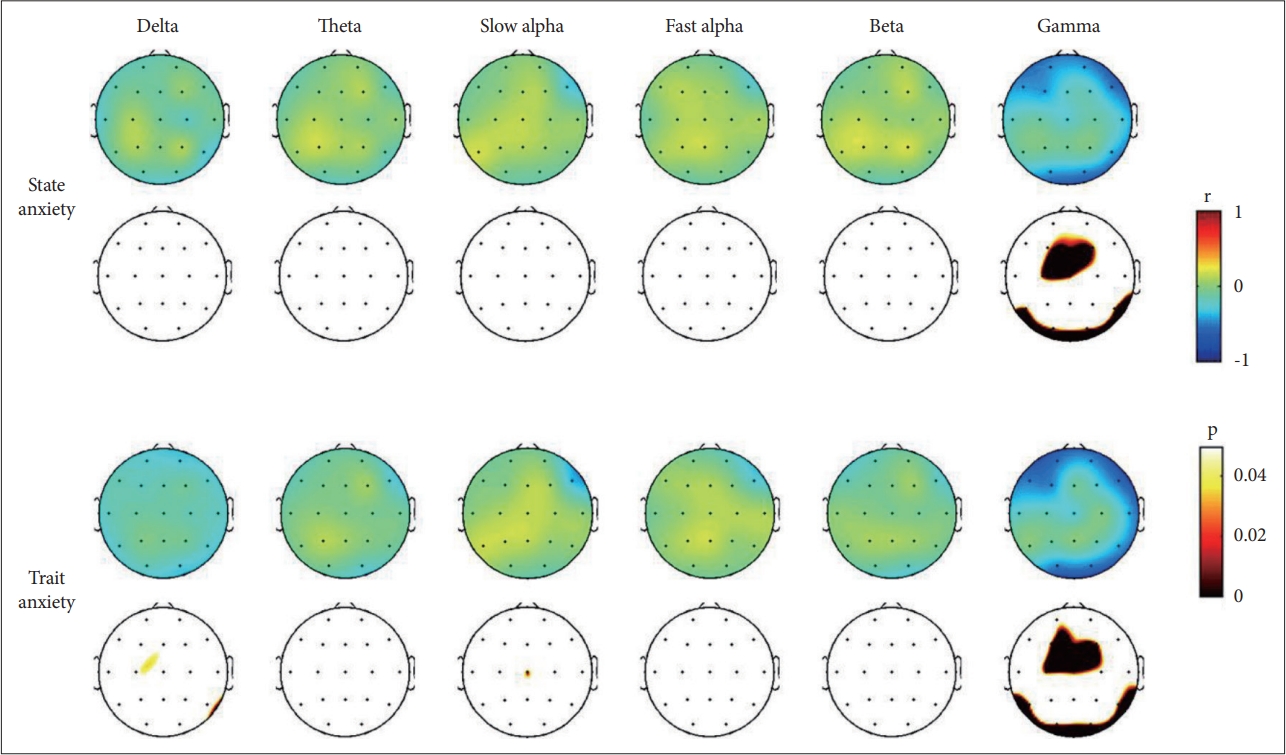
Topographical representation of the statistical results of the Pearson’s partial correlation analysis controlled for age, gender, and BDI-II between the anxiety symptom and electroencephalogram analysis. Upper topoplots denote Pearson’s correlation coefficients (r). Lower topoplots denote statistical significance (p) after applying the Bonferroni correction. BDI-II, Beck Depression Inventory-II.
DISCUSSION
The present study investigated the association between EEG band power and anxiety, both state and trait anxiety, as defined by the STAI. The significant negative correlations between anxiety level and gamma band power in fronto-central and posterior regions were the main findings of our study.
Gamma oscillations, representing the high frequency band (30–80 Hz), are short-lived and generated from the recurrent coordinated interactions of excitatory and inhibitory neurons [32-34]. Gamma band activity is the ubiquitous phenomenon of cortical process rather than activity of some specific neurons [34], and reflects various cognitive process such as attention, binding, object representation, memory, and language, among which, memory seems to be the most prominent and fundamental to other cognitive process [34-36]. Particularly, gamma oscillations are related to emotional memory via cortical arousal induced by an emotionally arousing stimulus, which in turn facilitates the coordination of signaling between brain regions, essential for the encoding and expression of emotional memory [37].
Many previous studies have reported that emotional stimuli, especially negative stimuli, induce enhanced gamma activity [37]. For instance, Keil et al. [38] assessed gamma band activity in healthy university students when an emotional stimulus was presented. Participants had enhanced gamma band activity in response to aversive stimuli but no difference when shown neutral pictures. Luo et al. [39] also assessed the gamma band activity of 21 adults when an emotional stimulus was presented, and observed enhanced gamma band activity in the amygdala, as well as in visual, prefrontal, parietal, and posterior cingulate cortices when shown emotional stimuli compared to neutral stimuli.
Among the negative emotions associated with the change of qEEG, some researchers have specifically focused on anxiety, which can be induced in response to particular tasks. Liu at al. [40] investigated the amplitude of the EEG power band oscillation while people with high- and low-math anxiety were expecting an arithmetic problem to be presented. People with high-math anxiety showed stronger gamma band activity, as well as beta band activity, than those with low-math anxiety while solving the arithmetic problem, indicating that individuals with high-math anxiety might use more attentional resources during the anticipation of arithmetic problems. Schneider et al. [41] also analyzed EEG band power during the processing of emotional faces as related to state anxiety and reported enhanced gamma band activity in the visual cortex and fusiform gyrus during the presentation of fearful faces. Moreover, an individual’s level of state anxiety was positively correlated with the gamma band responses. Miskovic et al. [42] investigated the change of EEG gamma band power in individuals with high- and low-social anxiety while waiting to give a speech. EEG gamma power increased in the parietal lobe during the speech anticipation period in both groups. However, these increases of gamma power did not differentiate the high- and low-anxiety groups, which suggests that the increased gamma power appears to reflect a state-dependent increase of arousal. Similarly, Oathes et al. [43] inspected the level of gamma activity in patients with generalized anxiety disorder and controls during a worry induction task and reported increased gamma activity during the worry induction in both groups.
The previous studies consistently reported increased gamma activity when experiencing negative emotions, including anxiety [37]. Those reports seem to contradict our current findings, in which we found negative associations between gamma power activity and anxiety scores. However, we should consider one critical difference between the previous studies and the current. The previous studies evaluated the gamma band activity during an induction of the negative emotion whereas the present study assessed qEEG during resting status. The aforementioned studies also reported that the increase of gamma activity during the induction of anxiety was state-dependent rather than based on group differences, such as between high- and low-anxiety groups [41-43]. Gamma oscillations reflect not only cortical arousal for processing emotional stimuli, but also related cognitive process including attention. Although individuals with high anxiety have a selective bias toward threatening stimuli and deploy more processing resources to threatening information [44-46], they are reported to show attentional deficits and a diffused and unstructured network related to cognitive processing [40,47,48]. In our study, gamma band activity had a significant negative association with the degree of anxiety. In addition, these associations were more widespread with trait anxiety than with state anxiety. Although it is speculative, these findings might reflect a deficit in maintaining attention during the resting state in individuals with high anxiety. Consistent with this, a previous study with patients with depression reported that gamma power was positively correlated with scores on inattention [49].
In the present study, the delta, alpha, theta, and beta band powers were not significantly correlated with state and trait anxiety scores. Previous studies examining EEG correlates of anxiety have reported inconsistent findings with respect to these frequency bands. A previous study reported that state and trait anxiety were positively related to alpha and negatively related to delta relative power independent of cortical site [50]. Another study reported that the absolute delta and theta powers were significantly correlated with observer ratings of anxiety in patients with panic disorder, while relative beta power was related to self-ratings of anxiety [51]. Sachs et al. [52] found in a study of patients with social phobia that scores on trait anxiety were positively correlated with alpha power, and negatively correlated with absolute theta and slow alpha powers. In our study, delta and theta power did show a negative association with trait anxiety on most electrodes, however, the correlations did not reach significance.
Limitations
This study has some limitations that need to be noted. A small sample size is the first limitation of our study which might decrease the power of our findings. In fact, despite the consistent negative association among trait anxiety and delta and theta power on most electrodes, the nonsignificant correlation could be due to a small sample size. In addition, a lack of a healthy comparison group limits the generalized interpretation of the present findings in the normal population as well as the differential comparison between patients with anxiety and controls. Thus, future studies with a larger sample size that include healthy controls are warranted to confirm our findings. The assessment for the level of anxiety symptoms being based on only the STAI is another limitation of our study. As aforementioned in the introduction, the symptom presentation of anxiety across the disorders (i.e., panic disorder, PTSD, and OCD) are heterogeneous [20]. As well, the association between anxiety and EEG might vary according to assessment tools (i.e., observer-rating versus self-rating) [51]. Thus, the adoption of multiple assessment tools based on a multi-informant approach may elucidate the neural correlates of anxiety. Finally, the heterogeneous constitution of participants was also a limitation. For instance, age or cognitive function may have an effect on neural correlates. Although we tried to reduce the variability with our inclusion criteria for age and IQ, the wide range of age and IQ in our participants might affect the results. Future studies with a strictly matched sample are warranted to confirm our findings.
Conclusions
The present study investigated the associations between EEG power bands during resting state and the level of anxiety symptoms according to the RDoC framework, focusing on the characteristics of anxiety symptoms rather than specific diagnoses. This study identified the significantly negative correlations between the anxiety level and gamma band power in frontocentral and posterior regions. Our results provide novel and differential findings from the previous studies in that we investigated the association in resting-status, whereas the previous studies were performed on task-based situation. Future studies with a larger sample including healthy controls are needed to confirm our findings.
Notes
Availability of Data and Material
The datasets generated or analyzed during the study are available from the corresponding author on reasonable request.
Conflicts of Interest
The authors have no potential conflicts of interest to disclose.
Author Contributions
Conceptualization: Kyoung Min Kim, Jun Won Kim. Data curation: all authors. Formal analysis: all authors. Funding acquisition: Jun Won Kim. Investigation: all authors. Methodology: Kyoung Min Kim, Jun Won Kim. Project administration: Jun Won Kim. Supervision: Kyoung Min Kim, Jun Won Kim. Visualization: Kyoung Min Kim. Writing—original draft: all authors. Writing—review & editing: all authors.
Funding Statement
This work was supported by the grant of Research Institute of Medical Science, Daegu Catholic University (2018).