Risk Factors for Various Cognitive Function Decline Trajectories in Adults Over 40 Years of Age: A Retrospective Cohort Study
Article information

Abstract
Objective
The aims of our study were to identify distinct trajectories of cognitive function using the group-based trajectory model. We also investigate which demographic factors act as risk factors for cognitive decline in each group.
Methods
The data from the Seoul National University Hospital Healthcare System Gangnam Center, from 2005 to 2019. The number of study subjects was 637. We used a group-based model to identify cognitive function trajectories. Multinomial logistic regression was employed to define risk factors for cognitive function decline.
Results
The cognitive function trajectories among adults over 40 years of age were heterogeneous. We identified four trajectories: high (27.3%), medium (41.0%), low (22.7%), and rapid decline (9.1%). Older age, male, low educational level, bad dietary habits, diabetes mellitus, technical worker, and lower income increased the likelihood of a cognitive function decline.
Conclusion
A younger age, a higher educational level, professional worker, good dietary habits, no diabetes mellitus, and no obesity improved cognitive function. A combination of these factors can improve “cognitive reserve” and delay cognitive decline. Interventions to prevent cognitive decline are needed after identification of high-risk groups for cognitive decline.
INTRODUCTION
Aging is inevitable, accompanied by reduced intellectual ability, decline in sensory functions, and reduced emotional responses [1]. The decline in intellectual ability begins with memory issues, and impairments of judgment and comprehension [2]. In most parts of the world, the prevalence of dementia in adults aged 60 and up is around 5%–7% [3].
In 2018, it was estimated that 50 million people globally had dementia, with the number expected to triple by 2050 [4]. Due to the fact that dementia is a prominent cause of mortality and is accompanied by expensive healthcare costs [5], preventative and interventional measures that reduce cognitive decline in older adults are essential.
Several sociodemographic characteristics and health habits can affect cognitive decline. These included older age, lower income [6], not cohabiting with a spouse [7], poorer education [8], rural residence [9], poor self-rated health,10 limitations on the activities of daily living [6], and chronic illness [11]. Current smokers [12] exhibited low cognitive functioning but normal alcohol consumers [13] and those who exercised [14] frequently maintained a healthy weight [6] and participated in social activities [15], exhibited high-level functioning [16]. In this regard, decline of cognitive function affects people’s general health as well as their mental health. Therefore, identifying factors that affect cognitive function decline is essential for the creation of effective interventions.
The trajectory analysis is intended to account for individual variability with respect to the average population trend. The trajectory is necessary in order to provide an intervention suitable for the group because the demographic characteristics or risk factors will be different for each group grouped with similar characteristics over time [17].
To implement the trajectory, a group-based trajectory model (GBTM) is used. GBTM methods identify the individual characteristics of each study subject. And it is a method to show the progress pattern of how a specific variable changes with time and to classify it appropriately [18].
Among the studies related to mental illness, there are not many studies that have analyzed the trajectory of cognitive function, but there are many studies related to the trajectory of depression. In some psychiatric studies, there are studies that confirm the multiple change patterns of depression while reflecting the heterogeneity and dynamics of the group. Depression change does not appear as a single trajectory, but multiple trajectories exist. In addition, various patterns of change were found to be diverse, such as a pattern of maintaining a low level of depression or a high level of depression, a pattern of decreasing the level of depression, and a pattern of increasing it [19-21].
Other previous study on the trajectory of depression, there was a high-risk group particularly vulnerable to depression among the elderly with disabilities, and risk factors affecting this group included social relationships and daily life performance. In that paper, it was revealed that the results can be used as evidence to prepare alternatives such as increasing opportunities to socialize with people and supporting assistive devices to improve daily life performance to prevent depression in the elderly [22]. As such, it is possible to devise an intervention method that can select and prevent high-risk groups through trajectory analysis.
Similarly, cognitive function may also appear in various ways, such as a pattern in which cognitive function is maintained high, a pattern in which the cognitive function is maintained at a moderate level, and a pattern in which cognitive function is rapidly decreased, depending on the person. Finding influencing factors for enhancing or sustaining cognitive function may be done by looking at the categorization of individuals’ cognitive function trajectory. And ultimately, we investigated effective strategies for improving mental health in older adults.
The aims of our study were 1) to identify distinct trajectories of cognitive function using the GBTM method and 2) to find out what risk factors exist for each identified group, such as demographics, lifestyle, comorbidities, and economic conditions.
METHODS
Participants
Participants visited the Seoul National University Hospital Healthcare System Gangnam Center for health checkups that included the Consortium to Establish a Registry for Alzheimer’s Disease-K (CERAD-K), medical interviews, blood tests, and physical measurements. In total, 3,992 individuals underwent CERAD-K testing and physical measurements from 2005 to 2020. This includes individuals with and without repeat assessment of cognitive function and physical measurement. For the longitudinal study, 637 remained and enrolled in the study, excluding participants without CERAD-K repeat tests, physical measurements, blood tests, or other measurements.
Study measures
Cognitive function
In this study, cognitive performance was defined as the CERAD-K score. We use seven subtests evaluating verbal fluency, Boston Naming, word list memory, word list recall, word list recognition, constructional praxis, and constructional recall. The verbal fluency test assesses verbal productivity, semantic memory, and linguistic ability. For example, a subject is asked to name as many animals as possible in 1 min [23]. In the Boston Naming test, the subject looks at pictures and names the objects seen [24]. The word list memory requires immediate recollection. Participants read 10 common words every 2 s and immediately recall as many as they can over 90 s. After 15 min, the subject within 90 s recalls 10 words from the word list memory task in the word list recall test, which assesses short-term memory. In the word list recognition test, the subject discriminates between 10 words used in the word list memory test and a new set of 10 words, this assesses recognition ability [25]. The constructional praxis assesses visual, spatial, and constructional skills. Each subject is given four line drawings of increasing complexity. Each figure is studied for no more than 2 min. The constructional recall test assesses the capacity to recall figures presented in the constructional praxis test after a brief delay [24].
Independent variables
The independent variables were demographic, economic, lifestyle, and comorbidity variables. The demographic variables included age, gender, and educational level (high school graduate or above). The economic variable was household income (monthly average less than or over 5 million won). Occupations were divided into professional and technical. The lifestyle variables included current smoking, current alcohol consumption, exercise (exercise regularly at least once a week or not), and dietary habits. If subjects eat three times a day, eat breakfast five times or more a week, have regular meal times, eat moderately, and eat out once or twice a week, the subject’s dietary habits are in the good category. If subjects skip a meal, eat fast, eat too much, and eat out more than three times a week, subject’s dietary habits are classified as bad. The comorbidities included hypertension, diabetes mellitus, and hyperlipidemia. Comorbidities were classified according to whether they were receiving treatment after diagnosis and whether they were currently taking medication. Obesity, defined by the waist circumference, is greater than 90 cm in men and greater than 85 cm in women.
Statistical analysis
Data analysis was divided into two parts: 1) identification of cognitive function decline trajectories and 2) exploration of the associated risk factors.
In trajectory analysis, cognitive function was measured by CERAD-K total score. The Stata TRAJ program [26] employing the Nagin GBTM was used to identify trajectories of cognitive function decline. GBTM can discover diverse clusters within the sample population and develop trajectories based on their trends when using a single repeated measurement outcome. Based on their posterior probability, individuals are classified into the subcategories that are most likely [27]. This assumes that at least two significantly different change trajectories exist; the optimal trajectory number is found by calculating the Akaike information criterion (AIC) [28] and the Bayesian information criterion (BIC) [29,30]. The model for which AIC and BIC are closest to 0 is optimal [31,32]. Prior to calculation of the AIC and BIC, intercept, linear, quadratic, and cubic models are explored until a meaningful model is found for each trajectory.
Finally a multinomial logistic regression analysis was conducted to explore associations among independent baseline variables. Cognitive performance with multinomial logistic regression models adjusted for age, gender, education level, dietary habits, smoking, alcohol consumption, and exercise. p-value of <0.05 was considered statistically significant. Analyses were performed using Stata MP version 16 (StataCorp LLC., College Station, TX, USA).
Ethics approval and consent to participate
The study was planned and conducted in accordance with the principles of the Declaration of Helsinki, and the study protocol was approved by the Ethical Review Board of Seoul National University Hospital and Seoul National University Boramae Medical Center (IRB No.J-2003-049-1108, 20-2020-11). The requirement for informed consent was waived by the Ethics Committee of Seoul National University Hospital and Seoul National University Boramae Medical Center because of the retrospective nature of the study and was not required for research that relied exclusively on secondary use of anonymous human biological materials as long as the process of data recording or dissemination of results does not generate identifiable information.
RESULTS
Identification of the trajectories of cognitive function decline
To find an optimal model for the trajectories, the AICs and BICs of trajectory models featuring two to four groups were calculated; the latter model was optimal (Figure 1). The cognitive function decline trajectories were 1) high cognitive function group, 2) medium cognitive function group, 3) low cognitive function group, and 4) rapid cognitive function decline group. The medium group was largest (41.0%), and the quadratic function yielded statistically significant data. This group maintained a CERAD-K score of 80 to 60. The second-largest group (27.3%) was and the quadratic function also yielded statistically significant data. This group maintained a CERAD-K score of 90 to late 70’. The third-largest group (22.7%) was statistically significant in the linear function. This group maintained a CERAD-K score in the range early 60’ to late 50’. For the rapid cognitive function decline group (9.1%) was also statistically significant in the linear function. The CERAD-K score declined from 50 in to 10.

Identified trajectories of cognitvie function. CNORM, censored normal model.
Characteristics of the participants
The baseline demographic characteristics are summarized in Table 1. Of all subjects, 274 (43.0%) were male and 363 (56.9%) female. A total of 339 (62.3%) were over high school graduates. Professional workers accounted for 223 (35.0%). A total of 521 (81.8%) had average monthly incomes over 5 million won. Totals of 601 (94.3%) and 427 (67.0%) did not smoke or drink alcohol, respectively. Totals of 473 (74.2%) and 223 (35.0%) exercised and had good dietary habits, respectively. In terms of comorbidities 270 (42.4%) suffered from hypertension, 90 (14.1%) diabetes mellitus, 158 (24.8%) hyperlipidemia, and obesity 300 (47.1%). The demographic characteristics of group in Table 2. The baseline social characteristics differed significantly between the groups in age (p<0.0001), educational level (p<0.0001), dietary habits (p<0.0001), exercise (p=0.02), household income (p<0.0001), occupation (p=0.04), diabetes mellitus (p=0.01), and obesity (p=0.01).
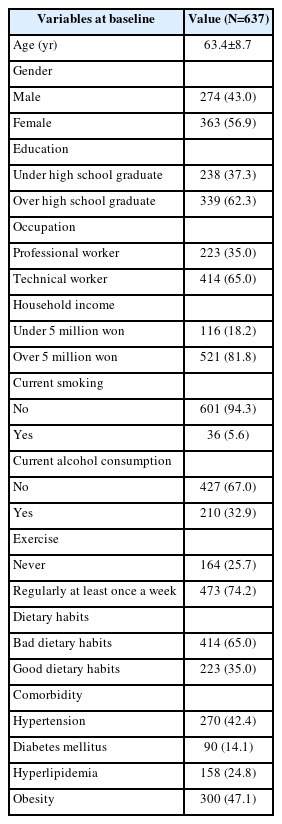
General characteristics of study population
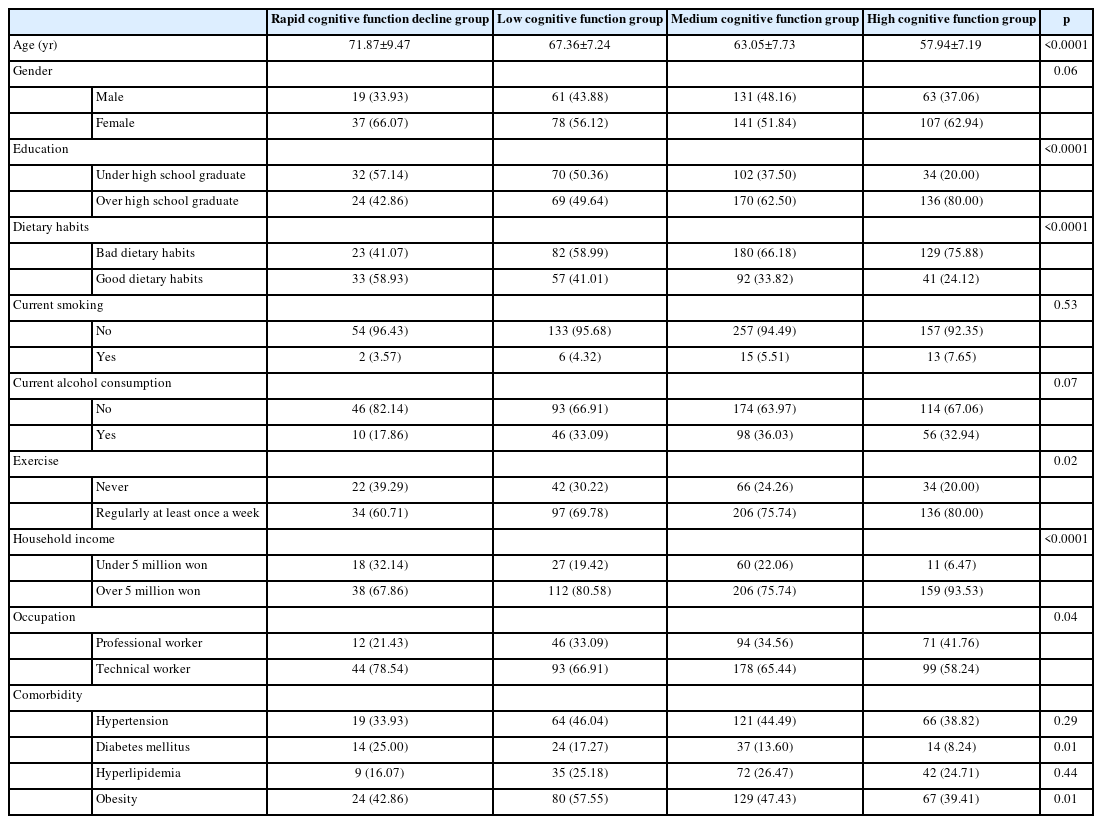
Demographic characteristics of trajectory groups
Factors affecting the trajectories
Table 3 summarizes the results of multinomial logistic analysis using “high cognitive function group” as the reference. The people who were older age (odds ratio [OR]=1.27), bad dietary habits (OR=2.13), technical worker (OR=2.63), and diabetes mellitus (OR=3.71) were more likely to be in the rapid cognitive function decline group than in the high cognitive function group. And the higher the education level (OR=0.12) and household income over 5 million won (OR=0.14) the lower the probability of belonging to rapid cognitive function decline group.
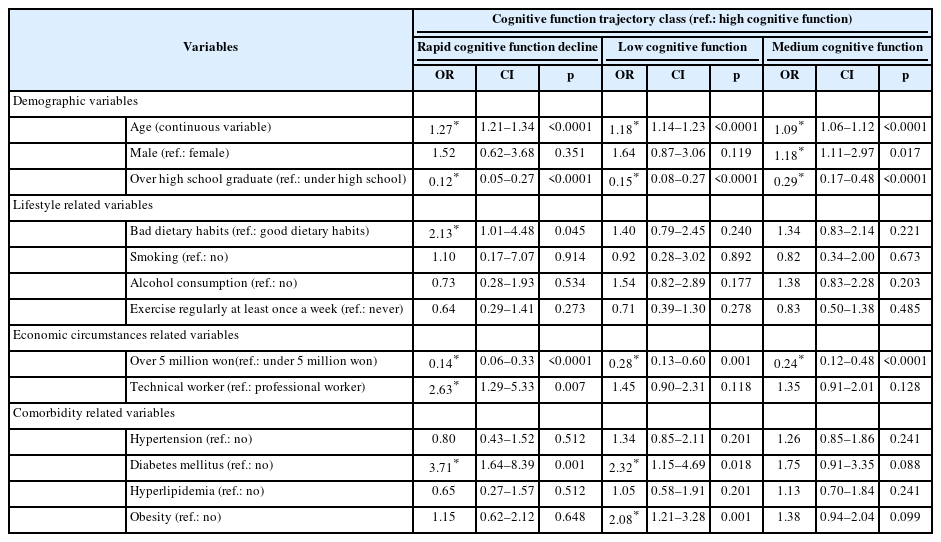
Multinomial logistic regression of cognitive function decline
People in the low cognitive function group were more likely to be older age (OR=1.18), diabetes mellitus (OR=2.32), and obesity (OR=2.08) than people in the high cognitive function. And the higher the education level (OR=0.15) and household income over 5 million won (OR=0.28) the lower the probability of belonging to low cognitive function group.
A comparison of the medium cognitive function group and high cognitive group revealed that older age (OR=1.09), male (OR=1.18), increased the likelihood of people in the medium cognitive group. And the higher the education level (OR=0.29) and household income over 5 million won (OR=0.24) the lower the probability of belonging to medium cognitive function group.
DISCUSSION
The purpose of this study were to look into various changes in cognitive function trajectories over time and to investigate what factors contributed to these changes by using GBTM. We found four distinct trajectories of change in cognitive function in adults over 40 years of age: high, medium, low, and rapid decline. Although cognitive decline is a natural phenomenon with age, the pattern of cognitive decline is different for each individual. Some people have a gradual decline in cognitive function, while others have a sharp decline in cognitive function.
Following the confirmation of the cognitive function trajectories, the relevant factors that influenced membership in each trajectory were identified. Older age, lower education level, bad dietary habits, comorbidities, a low household income, and technical workers were more likely to indicate group of the low and rapid cognitive function decline. Such variables should be modified to prevent the risk of rapid cognitive function decline. Similar to the results of previous studies on Alzheimer’s disease and dementia, our study found that cognitive function declines with age, with lower education, and with lower household income [6,8]. Life competencies such as resilience, self-esteem, and productive efficiency to risky and stressful circumstances are all acquired through higher education [33]. Individuals with higher life competences are better able to avoid risk factors that may impair cognitive function and, on the other hand, engage in more cognitively demanding activities, which also help to maintain cognitive function in later life [34]. Furthermore, education enhances socioeconomic competencies, allowing access to additional resources such as increased earnings.
Noncommunicable diseases such as hypertension, diabetes mellitus, and obesity are associated with aging [35-37] and are caused by a lack of physical exercise [38,39]. Hypertension causes damage to the structure of cerebral blood vessels, increases atherosclerosis, and inhibits cerebrovascular regulating processes. These vascular abnormalities enhance the brain’s sensitivity to ischemia injury, particularly in sensitive white matter regions crucial for cognitive function, and may contribute to the development of cognitive decline [40]. Diabetes mellitus is a metabolic disorder in which the body does not produce enough insulin or does not operate normally. Insulin is thought to have neuromodulatory properties that help synapses become more flexible. Insulin signaling dysfunction, chronic inflammation, hyperglycemia, and increased oxidative stress all play important roles in the pathophysiology of Alzheimer’s disease [41-43].
We also found associations between dietary habits, obesity and cognitive function. When body fat increases, harmful substances in visceral fat interfere with the action of insulin. Then, the reaction that allows the sugar component in the blood to be converted into an energy source and enter the cells becomes dull, resulting in insulin resistance, which makes it difficult for insulin to function properly. To compensate for the impaired insulin function, the brain induces more insulin to be secreted, resulting in hyperinsulinemia. Beta-amyloid, a commonly known substance associated with cognitive decline, is a surface protein of brain cells. When this protein is made in excess and accumulates in the brain, it causes damage to brain cells. Insulin interferes with the decomposition of beta-amyloid and, as a result, reduces brain perfusion, leading to cognitive decline [44]. This pathophysiologically explains the relationship between obesity and cognitive decline. Dietary habits affect obesity. Irregular meals increase insulin secretion and fat synthesis by enhancing the activities of adipogenic enzymes [45]. Too many meals or difficulties in controlling intake enhance obesity. Skipping breakfast can trigger snacking and overeating at lunch or dinner. We noted frequent consumption of processed and fast foods; the higher these intakes, the higher the blood cholesterol and triglyceride levels, triggering cardiovascular disease and obesity [46]. According to these findings, it is possible that controlling one’s dietary habits and obesity is important factors in the prevention of cognitive function decline.
There are strengths in our research. Many previous studies used the Mini-Mental State Examination (MMSE) to evaluate cognitive function; the MMSE evaluates orientation, memory, calculation, recall, language, and spatial and temporal abilities over about 20 minutes [47]. The CERAD-K that we used evaluates verbal fluency, Boston Naming, MMSE, word list memory, construction praxis, word list recall, word list recognition, constructional recall, and trail making test A/B; the test requires over 1 hour [24]. CERAD-K has more questions and is more accurate than MMSE. The strengths of our study are that we tracked subjects for several years using the CERAD-K test, which is better than the MMSE.
The limitations are that it is difficult to generalize our results this was a single Healthcare system Gangnam Center of Seoul National University work. However, about 45,000 patients visit center annually; our results will be robust. Also, we did not assess social relationships such as meetings with close friends or social gatherings. In previous studies, meetings with close friends and family, and religious and club activities, improved mental health [48,49] because humans are constantly aware of the situation and keep thinking while understanding the other person’s point of view while talking to the other person and anticipating how their actions will affect their future relationships.
Despite these limitations, we identified trajectories of cognitive decline in adults aged over 40 years and identified risk factors. Our results can be used to prevent cognitive decline with aging. In the future, it is important more specific programs such as dietary improvement and weight management can be prepared based on the research results.
In conclusion, we identified four distinct trajectories of cognitive decline in those aged over 40 years; the declines were associated with different demographic, lifestyle, and economic factors, as well as comorbidities. A younger age, a higher educational level, a professional worker, good dietary habits, no diabetes mellitus, and no obesity improved cognitive function. The combination of these factors is a “cognitive reserve” that delays cognitive decline.
Our findings highlight the need to prevent such decline. Identification of those at high risk followed by interventions that prevent decline are essential.
Notes
Availability of Data and Material
The datasets generated or analyzed during the study are not publicly available as they are owned by Seoul National University Hospital Healthcare System Gangnam Center and contain personal information, but are available from the corresponding authors on reasonable request.
Conflicts of Interest
The authors have no potential conflicts of interest to disclose.
Author Contributions
Conceptualization: Sujeong Han. Data curation: Sujeong Han. Formal analysis: Sujeong Han. Investigation: all authors. Methodology: Sujeong Han, Sung-il Cho. Project administration: Dae Hyun Yoon. Resources: Jun-Young Lee, Dae Hyun Yoon. Supervision: Sung-il Cho, Dae Hyun Yoon. Validation: all authors. Visualization: Sujeong Han. Writing—original draft: Sujeong Han. Writing—review & editing: all authors.
Funding Statement
None