Effects of Uric Acid on the Alterations of White Matter Connectivity in Patients with Major Depression
Article information
Psychiatry Investig. 2018;15(7):743-743
Publication date (electronic) : 2018 July 17
doi :
https://doi.org/10.30773/pi.2017.12.17.e1
This corrects the article "Effects of Uric Acid on the Alterations of White Matter Connectivity in Patients with Major Depression" in Volume 15 on page 593.
Psychiatry Investig 2018;15(6):593-601
https://doi.org/10.30773/pi.2017.12.17
Following publication of the above article, the authors discovered that the p-value for group difference in sex (male/female) in Table 1 was incorrect. And the authors described unclearly whether the p-value for the sex distribution was obtained by chi-square test or Fisher’s exact test. The corrected table appears below.
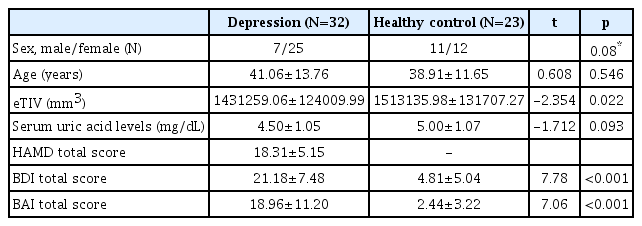
Characteristics of the study participants
The authors would like to apologize for any inconvenience caused.
Article information Continued
Copyright © 2018 Korean Neuropsychiatric Association