Gender-Specific Associations of Sensory Impairments with Depression and Cognitive Impairment in Later Life
Article information
Abstract
Objective
Sensory impairments, such as vision and hearing impairments, increase with age, and studies have shown that self-reported vision and hearing impairments are associated with adverse mental health outcomes in later life. Although gender differences may exist in the associations between sensory impairments and geriatric mental health outcomes, little research has been done examining gender differences in the above associations. Therefore, the purpose of this study was to investigate the relationship between self-reported sensory impairments and geriatric mental health outcomes with the aim of determining whether any association differs by gender.
Methods
The study sample was drawn from a nationally representative data set, the 2012 Korean Longitudinal Study of Ageing, and the final sample consisted of 2,167 females and 1,664 males aged 65 and over. Self-reported sensory impairments were categorized into four groups: no sensory impairment (reference), vision impairment only, hearing impairment only, and dual sensory impairment. Depression and cognitive impairment were used as dependent variables in separate analyses.
Results
Adjusted for confounding variables, results from a multivariate analysis showed that vision impairment was significantly associated with depression only among women. Moreover, hearing impairment was significantly associated with cognitive impairment for women, but not for men. Having dual sensory impairment was associated with depression only among men, while having dual sensory impairment was associated with cognitive impairment only among women.
Conclusion
These findings suggest that the associations between sensory impairments and geriatric mental health outcomes vary according to gender. Therefore, gender-specific strategies in healthcare policies are needed.
INTRODUCTION
Vision and hearing impairments are common among older adults because of the normal aging process. Vision impairment increases with age primarily because cataracts, macular degeneration, glaucoma, and diabetic retinopathy increases with age [1,2]. Hearing impairment also increases with age primarily because tiny hair cells inside the inner ear which pick up sound waves are damaged as people get older [3]. Evidences show that vision and hearing impairments are significantly associated with falls, functional status, depression, cognitive impairment, quality of life, and even mortality [4-10].
Although vision and hearing seem independent sensory functions, they often occur together and the impact of having both vision and hearing impairments (i.e., dual sensory impairment) can be more detrimental among older population [11]. Therefore, researchers sought to investigate the relationship between dual sensory impairment and adverse health outcomes. Recently, a literature highlighted the impact of dual sensory impairment on mental health [12]. Empirical studies revealed that dual sensory impairment is associated with depression and cognitive impairment among older adults [4,13-17].
A few studies also revealed gender differences in sensory impairments [18-21]. Studies found that vision impairment is more prevalent among women than men, while hearing impairment is more prevalent among men than women [7,22,23]. Since older women were mostly housewives and older men were mostly in the labor force during their life course, sensory impairments may play different roles on mental health outcomes by gender [19]. However, research is currently lacking examining gender-specific associations of dual sensory impairment with depression and cognitive impairment in later life.
Therefore, the purpose of this study was to investigate the relationship between sensory impairments and geriatric mental health outcomes (i.e. depression and cognitive impairment) with the aim of determining whether any association differs by gender. Since depression and cognitive impairment are two major geriatric mental health issues to which older adults pay close attention and are related to quality of life in the elderly, determining gender differences in above associations will be helpful in developing gender-specific health policies that can contribute to older adults’ well-being. It is hypothesized that the association between sensory impairments and geriatric mental health outcomes will be different by gender.
METHODS
Study sample
Data for this study came from the 2012 wave of the Korean Longitudinal Study of Ageing (KLoSA), a nationally representative survey conducted and funded by the Korea Labor Institute. The KLoSA includes community-dwelling middle and old-aged population who are aged 45 and older living in households selected by multistage stratified probability sampling based on geographical area. The household response rate was 70.7%, and the individual response rate within households was 75.4%. Respondents in individual households were interviewed using computer-assisted personal interviewing (CAPI) methods. The KLoSA survey includes questionnaires on demographics, family, health, employment, income, assets, and subjective expectations and satisfaction [24].
In 2012, a total of 7,486 respondents completed the interview. In this study, the sample was restricted to older adults aged 65 and older. Among 4,134 respondents who were aged 65 and older, a pool of 3,831 subjects remained eligible for empirical analysis after a listwise deletion of cases with missing values. The sample was subdivided into female and male groups, which consisted of 2,167 and 1,664 subjects respectively.
Measures
Dependent variables
The measure of depression and cognitive impairment were used as dependent variables in the present study. Depression was measured by using the Korean version of the shortform (10-item) Center for Epidemiological Studies Depression (CES-D) scale (Cronbach’s alpha: 0.796) [25,26]. Each item was dichotomized based on whether the respondents had depressive symptoms during the past week. Two positive items were coded reversely. The total score ranged from 0 to 10, higher score indicating worse symptoms of depression. Based on the total score, a dichotomized depression variable was created (1=4 or higher score, 0=3 or lower score) [26,27].
The measure of cognitive impairment was derived from the Korean version of the Mini-Mental State Examination (K-MMSE) that had a maximum score of 30 points (Cronbach’s alpha: 0.880) [28]. K-MMSE is widely used for screening of cognitive impairment among older adults, and the normative data for K-MMSE has been developed for clinical use [29]. The cut-off scores (2 standard deviation of the mean) from the K-MMSE normative data were used to determine cognitive impairment [29].
Independent variables
Both self-reported status of eyesight and hearing were assessed with a five-point likert scale. First, vision and hearing impairment measures were assessed (1=poor/very poor, 0=fair/good/very good). Then, dual sensory impairment was determined if the respondent had both vision and hearing impairments. Based on these measures, the measure of sensory impairments was categorized into four groups: no sensory impairment (reference group), vision impairment only, hearing impairment only, and dual sensory impairment [13,14].
Covariates
In this study, age (number of years), marital status (1=married, 0=otherwise), a set of dichotomous variables of education [no education (reference group), elementary school graduate, middle school graduate, high school graduate, and some college or more], and log transformed household income were included as pre-existing socio-demographic factors. For missing data on income, multiple imputed values generated by the KLoSA research group were used [30]. Poor selfrated health was assessed with a five-point likert scale, then dichotomized (1=fair/poor health, 0=otherwise). The Korean version of activities of daily living (ADL) and instrumental activities of daily living (IADL) instruments were used to assess the number of ADL and IADL limitations [31]. ADL items included having difficulty in dressing, washing face and hands, bathing, eating, transfer, toileting, and continence, and IADL items included having difficulty in decorating, housework, preparing meals, laundry, outgoing for a short distance, using transportation, shopping, handling money, using telephone and taking medicine [31]. The number of chronic conditions was determined based on the physician-diagnosed chronic conditions (high blood pressure, diabetes, cancer, lung disease, liver disease, heart disease, cerebrovascular disease, psychiatric disorder, and arthritis). Smoking status was dichotomized (1=current smoking, 0=otherwise). Drinking status was dichotomized (1=normal drinking, 0=otherwise) based on the respondents’ drinking behavior [32]. In the KLoSA, the CAGE questions (cutting down, annoyance by criticism, guilty feeling, and eye-openers) were used to identify the respondents’ drinking behavior. If the current drinker answered “yes” to one or none of the four CAGE questions, the respondent was considered to have a normal drinking behavior [33]. Physical activity was dichotomized (1=regular exercise, 0=otherwise) in which regular exercise is considered as respondents having engaged in physical activity more than once a week. Body mass index was dichotomized (1=normal weight, 0=otherwise) in which respondents’ body mass index in the range of 18.5–22.9 kg/m2 was considered normal [34]. The number of participating in weekly social activities was assessed with attending religious meeting, social clubs, leisure group, alumni society, volunteer groups, political party, and others.
Statistical analysis
In this study, analyses were conducted separately for females and males. For the descriptive analyses, means (M) and standard deviations (SD) were used to assess the sample characteristics. T-tests and chi-square tests were conducted to evaluate the gender differences in descriptive statistics. Then, the multivariate logistic regression was used to investigate the association between sensory impairments and depression/cognitive impairment. Results from unadjusted models (Model 1) are reported first, followed by results from a set of hierarchical models adjusting for the covariates (Model 2 included Model 1 and the socio-demographic covariates, Model 3 included Model 2 and the health-related variables, and Model 4 included the Model 3 and the health behavior variables). Statistical gender differences in the relationship between sensory impairments and depression/cognitive impairment were also evaluated using t-statistics for regression coefficients [35]. Because of the complexity of sampling design, all statistical analyses were conducted based on the suggested sampling weight, using SPSS version 19 (SPSS, Chicago, IL, USA).
RESULTS
Descriptive statistics
Table 1 contains descriptive statistics for the study sample. More than half of women were depressed, while a little less than half of men were depressed. Cognitive impairment was more prevalent among women than men. About one third of women and one fourth of men had sensory impairments. Vision impairment was more prevalent among women than men. In contrast, more males had hearing impairments than females.

Sample characteristics by gender
In terms of other sample characteristics, women were far less educated than men. About half of women were married, while more than 90% of men were married. A large difference between men and women was also found in drinking behavior. Normal drinking was more prevalent among men than among women.
Logistic regression results: sensory impairments and depression
Table 2 and 3 show the empirical results of a logistic regression models that describe the associations between sensory impairments and depression hierarchically for each gender. For both genders, the associations between sensory impairments and depression were partially mediated when health factors were added in Model 3. In the final model, the odds of having depression was 49% higher for women with vision impairment than women with no sensory impairments, while there was no significant difference in the odds of having depression between men with vision impairment and men without any sensory impairment. However, men with dual sensory impairment were more likely to be depressed than men having no sensory impairments, while no significant difference was found between women with dual sensory impairment and women without any sensory impairment. In terms of gender differences, the association between sensory impairment and depression was not statistically significant.

Sensory impairments and depression (female N=2,167)
Sensory impairments and depression (male N=1,664)
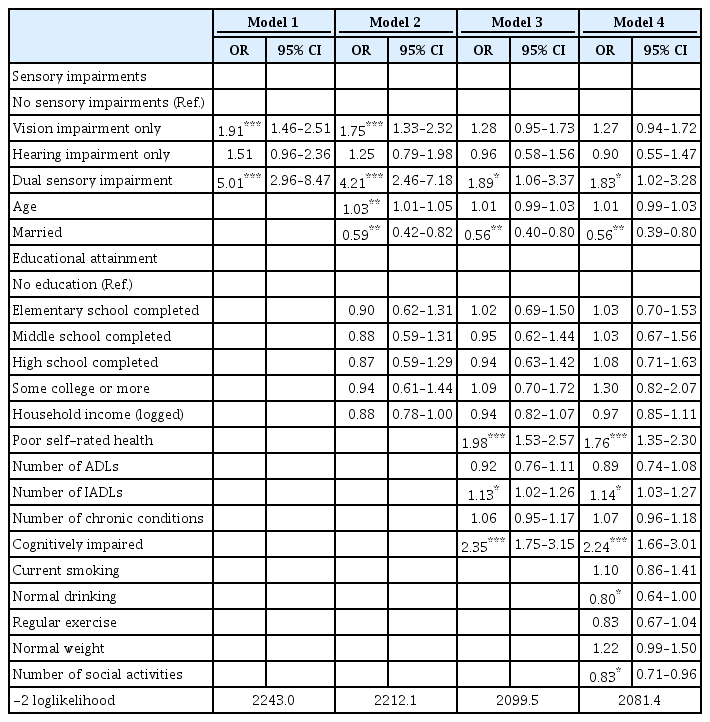
Logistic regression results: sensory impairments and cognitive impairment
Table 4 and 5 present the logistic regression results showing the associations between sensory impairments and cognitive impairment hierarchically for each gender. When sociodemographic factors were added in Model 2, the association between hearing impairment and cognitive impairment became not significant only among men. When health factors were added in Model 3, the association between vision impairment and cognitive impairment became not significant for both genders. In the final model, having hearing impairment and dual sensory impairment were significantly associated with cognitive impairment only among women. In terms of gender differences, the association between sensory impairment and cognitive impairment was not statistically significant.

Sensory impairments and cognitive impairment (female N=2,167)

Sensory impairments and cognitive impairment (male N=1,664)
DISCUSSION
This study was designed to examine the relationship between self-reported sensory impairments and depression/cognitive impairment among older adults in Korea. Corresponding to previous studies, sensory impairments were significantly associated with both depression and cognitive impairment. Although no statistical gender differences were found in above associations, gender-specific associations were found. For example, vision impairment was significantly associated with depression, and hearing impairment was significantly associated with cognitive impairment only among women. In addition, having dual sensory impairment was significantly associated with depression only among men, while having dual sensory impairment was associated with cognitive impairment only among women.
The results suggesting that vision impairment is associated with depression only among women is consistent with previous finding [19]. Based on Confucianism, older Koreans had gender-specific social roles and family structure. Most of the older Korean women used to be housewives doing all of the housework throughout their daily lives, therefore, older women with vision impairment might had difficulties doing their daily works, which could lead to depression [36]. In addition, Esteban et al. [18] found that women had significantly worse quality of life than men with the same degree of vision problems due to different pathologies. Thus, vision impairment can be more problematic for depression among women than among men.
The results of this study also suggest that hearing impairment is associated with cognitive impairment only among women. According to Garstecki and Erler [37], older adults with hearing impairment have communication problems, and this can be more problematic with women than with men. Older adults with communication problems tend to be isolated and their social network can be very limited. Social ties and social support are protective factors for cognitive impairment [38], and psychosocial factors may play more important role on cognitive health among women than among men [39]. Therefore, it is not surprising that hearing impairment has a significant relationship with cognitive impairment among women.
Consistent with previous findings [16,40,41], this study also suggests that there is a significant association between dual sensory impairment and geriatric mental health outcomes. Interesting finding is that dual sensory impairment was not significantly associated with depression in female population. This finding is similar to previous finding with Chinese older adults which did not differentiate gender [41]. In our study, dual sensory impairment became no more significant when health-related variables were included in the model. This may be because deterioration in self-rated health, functional ability, and cognitive function may diminish the effect of dual sensory impairment on depression among older women. To further understand this association, longitudinal study may be needed.
Despite these interesting findings, there are some limitations in this study. First, the sensory impairment was measured based on self-reported measures, therefore the result may be different compared to using clinical data [42]. In addition, males and females may have differing health perceptions and assessments, which can show differential results. Therefore, using objective measures will be helpful to determine the severity or stage of vision or hearing impairment. Second, the prevalence of depression measured with CES-D was relatively high among Korean older adults. Since other studies have also reported high prevalence of depression among older Koreans using the same measure, the result is not surprising. However, since CES-D is not a clinical measure, readers should interpret the reported result with caution. Third, the current study is a cross-sectional study. Therefore, it cannot be established that sensory impairment is causally related to geriatric mental health outcomes. Since our goal of this paper was to investigate the gender differences in the association between sensory impairments and geriatric mental health, we limited our study to a cross-sectional design. In the future, it would be valuable to do a prospective study examining longitudinal change in geriatric mental health associated with sensory impairment among older Koreans.
Although this study has several limitations, this study makes a number of important contributions. First, this study investigated the relationship between sensory impairments and geriatric mental health outcomes among Korean older adults using a nationally representative sample. Therefore, the findings from this study can be generalized. Second, this study examined the gender differences. Although gender differences in the associations between sensory impairments and geriatric mental health outcomes were not established statistically, this study found different mechanisms in each gender. Therefore, gender-specific strategies for the treatment and rehabilitation of sensory impaired older adults can be suggested. Finally, by examining both depression and cognitive impairment, we can have better understanding how sensory impairment is associated with different geriatric mental health outcomes.
Acknowledgements
This research was supported by a grant of the Korea Health Technology R&D Project through the Korea Health Industry Development Institute (KHIDI), funded by the Ministry of Health & Welfare, Republic of Korea (grant number: HI16C1418).
This work was supported by the National Research Foundation of Korea Grant funded by the Korean Government (NRF-2012S1A6A3A01033504).