Relationship between Clozapine-Induced Electroencephalogram Abnormalities and Serum Concentration of Clozapine in Japanese Patients with Treatment-Resistant Schizophrenia
Article information
Abstract
Objective
The objective of this study was to investigate the relationship between the serum concentration of clozapine (C-CLZ), Ndesmethylclozapine (N-CLZ) and the daily dose of CLZ (D-CLZ), and the relationships among CLZ and electroencephalogram (EEG) abnormalities.
Methods
Twenty-eight patients were recruited to this study, but 8 patients were excluded because clozapine was discontinued before the post-treatment measurement of EEG or C-CLZ. Ultimately, 20 patients (6 men, 14 women) with an average age of 36 years were enrolled. The subjects were divided into EEG normal and abnormal groups. C-CLZ and N-CLZ were measured at 4, 12, 26, and 52 weeks after initiating CLZ administration.
Results
All patients had normal baseline EEG signals, and 8 patients showed EEG abnormalities later. There were significant correlations between C-CLZ and D-CLZ, and between N-CLZ and D-CLZ. The C-CLZ/D-CLZ, N-CLZ/D-CLZ, and C-CLZ/N-CLZ ratio were not significantly different between the EEG normal and EEG abnormal groups. The EEG abnormal group had significant higher proportion of patients with high intra-individual variability in their C-CLZ/D-CLZ ratio.
Conclusion
There is no relationship between C-CLZ and EEG abnormalities. However, patients with high intra-individual variability in their C-CLZ/D-CLZ ratio had greater possibility of exhibiting EEG abnormalities.
INTRODUCTION
Clozapine (CLZ) is effective against treatment-resistant schizophrenia (TRS), and was introduced to Japan in 2009. In Japan, all physicians who prescribe CLZ, and their patients, must be registered with the Clozaril Patient Monitoring Service. In addition, CLZ administration is limited to patients with TRS who exhibit defined poor response or satisfy poor tolerance criteria.
It is known that CLZ induces serious side effects, such as agranulocytosis and seizures. Electroencephalogram (EEG) abnormalities are even more common. It has been reported that CLZ-induced EEG abnormalities occur in a dose-dependent manner, and correlate with the serum concentration of CLZ (C-CLZ) [1-4]. However, contradictory results have also been reported [5]. There is no convincing evidence that C-CLZ is related to EEG abnormalities. However, the studies mentioned above were performed on Caucasian patients. Ethnicity has been shown to influence clozapine pharmacokinetics [6]. For example, lower daily clozapine doses are needed to achieve comparable blood levels in Asians compared to Caucasians [7]; C-CLZ has been reported to be significantly lower in Korean patients than in Caucasian patients [8].
N-desmethylclozapine (N-CLZ) is a major active CLZ metabolite, mainly produced by oxidative metabolism of CYP1A2. CLZ and N-CLZ have opposing actions on the cholinergic system. With regard to cognition, the C-CLZ to N-CLZ (C/N) ratio is a strong predictor of working memory performance in patients with schizophrenia, although C-CLZ and N-CLZ alone show no association [9]. With regard to EEG abnormalities, the usability of the C/N ratio is unclear.
We investigated the following in Japanese patients with schizophrenia: 1) the relationship between C-CLZ, N-CLZ, and the daily dose of CLZ (D-CLZ), and 2) the relationship among CLZ and EEG abnormalities.
METHODS
Subjects and demographic profiles
Twenty-eight patients, who provided written informed consent, were recruited into this study. The study was approved by our Institutional Review Board (IRB 746). This study was conducted according to the principles expressed in the Declaration of Helsinki. The subjects were all consecutively hospitalized patients with TRS. All patients met the criteria of poor response or poor tolerance. Poor response is defined as failure to respond to a sufficient term (at least 4 weeks) of treatment with a sufficient dose of at least two well-tolerated antipsychotics [including at least one atypical antipsychotic (such as risperidone, perospirone, olanzapine, quetiapine, and aripiprazole) at over 600 mg/d chlorpromazine equivalent]. Poor tolerance is defined as the failure to adequately respond to monotherapy with at least two atypical antipsychotics, such as risperidone, perospirone, olanzapine, quetiapine, and aripiprazole, due to a failure to increase the dose to a necessary level for any of the following reasons: occurrence or worsening of moderate or more severe tardive dyskinesia, tardive dystonia, or other tardive extrapyramidal symptoms; occurrence of uncontrolled parkinsonian symptoms, akathisia, or acute dystonia. No patient had received CLZ before, or had a history of seizure or brain injury. Five patients were excluded because CLZ was discontinued before the post-treatment measurement of EEG or C-CLZ because of cardiomyopathy, agranulocytosis, leucopenia, and pure red cell aplasia. Three more patients were excluded because their serum concentrations of CLZ were not obtained. Ultimately, 20 patients (6 men, 14 women), who were on average 36 years old, were enrolled. Administration of CLZ (Novartis International AG, Basel, Switzerland) was initiated at a dose of 12.5 mg/d on the first day, and was increased to 25 mg/d on the second day. On the third day and thereafter, the daily dose was increased slowly, in increments of 25 mg, to achieve a dose of up to 200 mg/d over 3 weeks. The dose was increased according to symptoms; however, an interval of at least 4 days was maintained between increments of doses up to 100 mg. CLZ was administered once or twice daily at 9:00 and/or 21:00. The maximum dose was 600 mg/d, which is well-defined in Japan. In principle, the duration of hospitalization was defined as 18 weeks after initiating clozapine administration. However, given the following criteria were met, the patients were discharged before 18 weeks: desire for discharge, achievement of the maintenance dosage, at least 3 weeks of hospitalization, improvement of clinical symptoms, and confirmation of safety.
EEG recording
The EEG recordings were performed using the International 10–20 system and a 21-channel monitor. All records were assessed with the patient’s history and medications blinded. The EEG recordings were obtained every 4 weeks, several days prior to CLZ treatment. After the occurrence of EEG abnormalities, extra measurements of EEG were performed every 2 weeks.
Measurement of the serum concentration of CLZ
All patients received CLZ for at least 4 weeks. Plasma concentrations of both CLZ and N-CLZ are known to reach steady-state levels by 4 weeks after repeated oral administration. The levels of C-CLZ and N-CLZ were measured at 8:30, and, subsequently, 4, 12, 26, and 52 weeks after initiating CLZ administration.
Blood samples were stored at -20°C until assayed. C-CLZ and N-CLZ were measured using high-purity high-performance liquid chromatography (HPLC) with ultraviolet (UV) detection. The HPLC system consisted of a Shimadzu Nexera and a Shimadzu Workstation LC solution chromatography integrator (Kyoto, Japan). The peaks were detected by a UV detector, at a wavelength of 254 nm. The peak areas were used for the quantification of C-CLZ and N-CLZ.
Data analysis
The subjects were divided into EEG normal and abnormal groups. The correlations between C-CLZ and D-CLZ, and between N-CLZ and D-CLZ were evaluated for each group using Spearman’s rank-correlation coefficient. The C-CLZ per D-CLZ (C/D), N-CLZ per D-CLZ (N/D), and C/N ratio were compared between the two groups using Student’s t-tests. The threshold of significance for all tests was set at 5%.
RESULTS
All patients had normal baseline EEG, and 8 patients (40%) showed EEG abnormalities later (1 patient at 4 weeks; 5 patients at 8 weeks; 1 patient at 9 weeks; 1 patient at 52 weeks). The EEG findings were spike and slow wave (7 patients, 88%), theta (5 patients, 63%), and delta (3 patients, 38%). No patients withdrew from this study because of the appearance of EEG abnormalities. The patient’s characteristics are outlined in Table 1. Seventy-one serum levels were measured in total. There was a significant correlation between C-CLZ and D-CLZ (EEG normal: rs 0.58, p<0.01; EEG abnormal: rs 0.46, p=0.01), and between N-CLZ and D-CLZ (EEG normal: rs 0.53, p<0.01; EEG abnormal: rs 0.48, p=0.01) (Table 2). The C/D, N/D, and C/N ratio were not significantly different between the EEG normal and EEG abnormal groups (Table 3). Figure 1 shows the time course of C/D in all patients from both groups. The average C/D ratio was 2.0. The percentage of patients whose C/D ratio was greater than 2 was 50% in the EEG abnormal group (4 out of 8 patients) and 8% in the EEG normal group (1 out of 12 patients). There was a significant difference between the groups (chi-square test, p<0.05).

Patients’ characteristics

Correlation coefficients between C-CLZ and D-CLZ, and between N-CLZ and D-CLZ in the EEG normal and EEG abnormal groups

The differences in the C/D, N/D, and C/N ratios between the EEG normal and EEG abnormal groups
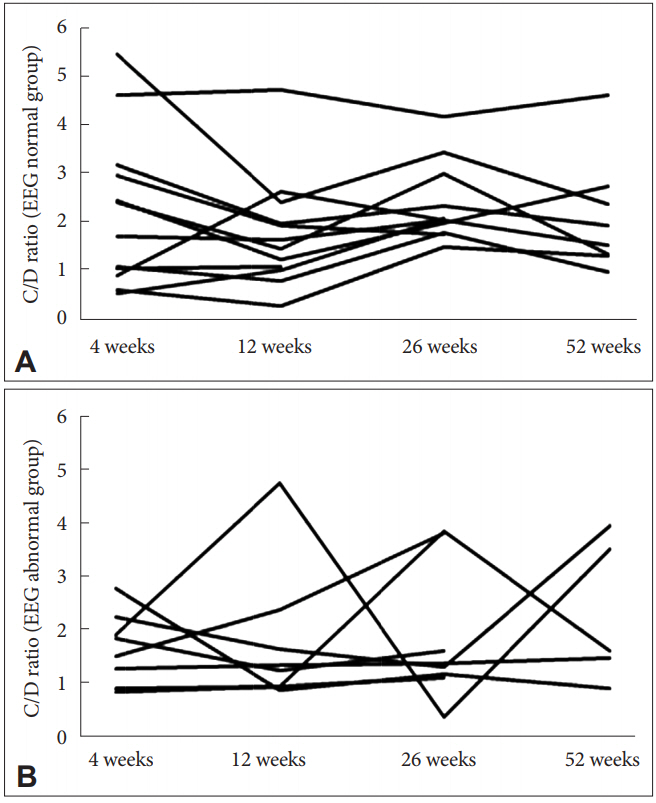
The time course of the C/D ratio for each patient from both groups. A: C/D ratio of the EEG normal group, B: C/D ratio of the EEG abnormal group. C/D: serum concentration of clozapine/daily dose of clozapine, EEG: electroencephalogram.
DISCUSSION
In this study, there were significant correlations between CCLZ and D-CLZ, and between N-CLZ and D-CLZ. The mean D-CLZ, C-CLZ, and N-CLZ in this Japanese study are similar to previous reports [10-15]. However, the correlation coefficients were only moderate. These results are similar to those from the study by Chang et al. [10], which reported that the correlation coefficient between plasma concentrations and DCLZ was moderate (r=0.590). The authors explained the low coefficients by the large inter-patient variations in plasma concentrations of CLZ at the same dosage. Many studies have shown that variables such as sex, smoking, age, body weight, caffeine intake, and concomitant use of drugs may affect CYP1A2 activity [3,16,17-25]. However, contradictory evidence regarding the association between plasma CLZ concentrations with sex and age also exists [14,19,26-28]. In addition, Piwowarska et al. [12] analyzed the C-CLZ and its metabolites using a repeated measures multivariate analysis of variance. They reported a significant correlation between D-CLZ and C-CLZ with a low correlation coefficient (0.2674, p<0.05), but the relationship between C-CLZ and D-CLZ was not linear at all doses. The C-CLZ in serum when the dose of the drug is higher and exceeds 500 mg might be explained by the inhibition of CYP1A2 by the drug.
Among typical and atypical antipsychotics, CLZ is the drug most strongly associated with EEG abnormalities (CLZ: 47.1%, olanzapine: 38.5%, risperidone: 28.0%, typical neuroleptics: 14.5%, quetiapine: 0.0%) [29]. The EEG abnormalities reported to be associated with CLZ treatment range from 16% to 74% [4,30]. Haring et al. [13] described EEG abnormalities in 53% of patients, and reported that these were dependent on the plasma levels of CLZ. The authors determined that the dose was not statistically related to the EEG abnormalities. Subsequently, it has been reported that CLZ-induced EEG abnormalities occur in a dose-dependent manner, and are correlated with serum levels of CLZ [1,2,4,13]. However, Goyal et al. [5] reported EEG abnormalities in 61.9% of patients receiving 100 mg or less of CLZ. Freudenreich et al. [1] reported that 13% of patients develop spikes with no relationship to the dose of CLZ or CCLZ.
The plasma concentration of N-CLZ, a known major metabolite of CLZ, can vary from 20% to 150% of C-CLZ [31]. The C/N ratio is a strong predictor of working memory and cognitive performances in patients with schizophrenia, even though the concentrations of C-CLZ and N-CLZ alone are not, which is likely because of the opposing effects of CLZ and N-CLZ [9,15]. The C/N ratio has been suggested to be a valuable predictor of response to CLZ in patients with TRS [32]. Anderson et al. [33] reported that the C/N ratio may be a significant factor in determining the increased incidence of weight gain and dysmetabolic profiles in female patients. The C/N ratio may possibly represent a useful index for the side-effects of CLZ. However, in this study, the C/D, N/D, and C/N ratios were not significantly different between the EEG normal and EEG abnormal groups. Therefore, the C/N ratio contributes little to EEG abnormalities, which contrasts with its relationship with working memory and cognitive function. In addition, both the C/D and N/D ratios were not significantly different between the EEG normal and EEG abnormal groups. Our findings suggest that there is no relationship between C-CLZ and EEG abnormalities. Considering the intra-individual variability of the C/D ratio, the percentage of patients whose C/D ratio was greater than 2 was 50% in the EEG abnormal group and 8% in the EEG normal group. There was a significant difference between the groups (p<0.05). These results suggest that the patients with high intra-individual variability in the C/D ratio are predisposed to EEG abnormalities. To our knowledge, there are no reports regarding the relationship between the intra-individual variability of the C/D ratio and EEG abnormalities. Rajkumar et al. [34] demonstrated a 30-fold inter-individual variability among the participants, with their C/D ratio ranging from 0.28 to 8.29. Several studies have shown an influence of variables such as sex, smoking, age, body, caffeine intake, and the concomitant use of drugs on CYP1A2 activity [3,16,17-25]. Piwowarska et al. [12] showed that the mean C-CLZ indicates a proportional increase in the drug concentrations in relation to the used doses. Even the C-CLZ measurements in one patient, who had measurements taken 11 times within 13 months, yielded various values for CLZ at the same dose during treatment [12].
A limitation of this study was the small sample size. Therefore, it is necessary to conduct further studies including larger sample populations to confirm the association between the intra-individual variability of C/D and other side-effects of CLZ.
In conclusion, there are some reports that EEG abnormalities are associated with the dose of CLZ or C-CLZ. However, evidence to the contrary also exists. We demonstrated that there is no relationship between C-CLZ and EEG abnormalities. It is well-known that C-CLZ shows large inter-individual variability. However, there are no reports on the association between intra-individual variability and the side-effects of CLZ. Our results indicate that the patients with a high intra-individual variability in the C/D ratio had a greater possibility of exhibiting EEG abnormalities. We recommend that clinicians should assess C-CLZ repeatedly to detect EEG abnormalities, and perhaps other side-effects of CLZ, early.
Acknowledgements
We are grateful to all the participants in this study. We thank Yumiko Akamine for measurement of the serum concentrations of CLZ.
Notes
The authors have no potential conflicts of interest to disclose.