Long-Term Grey Matter Changes in First Episode Psychosis: A Systematic Review
Article information
Abstract
Objective
To determine possible progressive changes of the grey matter at the first stages of the schizophrenia spectrum disorders, and to determine what regions are involved in these changes.
Methods
We searched the literature concerning studies on longitudinal changes in grey matter in first-episode psychosis using magnetic resonance imaging, especially studies with an interval between scans of more than a year. Only articles published before 2018 were searched. We selected 19 magnetic resonance imaging longitudinal studies that used different neuroimaging analysis techniques to study changes in cerebral grey matter in a group of patients with a first episode of psychosis.
Results
Patients with first episode of psychosis showed a decrease over time in cortical grey matter compared with a group of control subjects in frontal, temporal (specifically in superior regions), parietal, and subcortical regions. In addition to the above, studies indicate that patients showed a grey matter decrease in cerebellum and lateral ventricles volume.
Conclusion
The results suggest a decrease in grey matter in the years after the first episode of psychosis. Furthermore, the results of the studies showed consistency, regardless of the methods used in their analyses, as well as the time intervals between image collections.
INTRODUCTION
The first-episode psychosis (FEP) is the first manifestation of the characteristic symptoms, such as hallucinations or delusions, of schizophrenia spectrum disorders (SSD). These disorders involve a strong element of social dysfunction and severe cognitive impairments. The causes of these disorders remain largely unknown, but evidence indicates that it arises from changes in the development of the central nervous system [1,2].
Magnetic resonance imaging (MRI) is the most established and widely used approach for the investigation of human brain structure in vivo [3,4]. Different studies have shown that MRI is a technique with great potential in mental health research. Specifically, neuroimaging studies in FEP have shown neuroanatomical abnormalities, and they have observed reduced volume of grey matter (GM) and altered white matter (WM) integrity during the early stages of SSD [5,6]. Furthermore, abnormalities in GM have been replicated in different longitudinal studies [7-9]. Moreover, longitudinal clinical studies in patients with SSD have observed an increase in functional deterioration during the first years of follow-up after the onset of the disease [10]. This deterioration could be associated with the aforementioned cerebral structural changes. Therefore, we consider it appropriate and relevant to review studies of changes in brain morphology during the first years of evolution of the disease. In addition, this review will take into account studies that used different methodologies, such as Voxel-based morphometry (VBM) [3,11], Regions of interest (ROI) manual, automated or semi-automated technique [12], and Cortical Pattern Matching (CPM) technique [13]. This way, a global view of the bibliography in longitudinal MRI studies is given.
Our main goals with this systematic review are to determine possible progressive changes of the GM at the first stages of the disease, after a FEP, and to determine what regions are involved in these changes.
MATERIAL AND METHODS
In this review, we have included studies with a longitudinal analysis of GM in patients with FEP, compared with a group of healthy controls using MRI.
Data sources
A systematic review of the literature was carried out in compliance with the Preferred Reporting Items for Systematic Review and Meta-Analysis (PRISMA) [14], and through a search of scientific journals on PubMed. We have selected English-language articles published between the years 2003 and 2018. Specifically, MRI studies with a longitudinal design that had a relationship between GM volume and FEP, compared with control group.
The following categories were used for the search. First search (1): grey matter, first episode psychosis, neuroimaging, longitudinal. Second search (2): grey matter, first episode psychosis, neuroimaging, follow-up studies. Third search (3): (grey matter) AND (longitudinal OR progressive OR follow-up) AND (first episode psychosis OR schizophrenia) AND mri.
At the same time, we performed a search on the OVID MEDLINE database, and we did not find any articles related to the search criteria.
The selection in the PubMed database was conducted by two researchers (a physicist and a psychologist). We found 321 studies; of them, 34 repeated articles were excluded. From these 287 articles, 269 were excluded after reading the abstracts and/or the results. Next, 3 articles were excluded because they did not identify the relationship between decrease in GM over time and FEP using MRI, or include affective psychosis in the FEP groups. We considered that there were articles that reported a decrease of GM in FEP as such, 4 articles were included manually. A total of 19 articles were included in the systematic review (Figure 1).
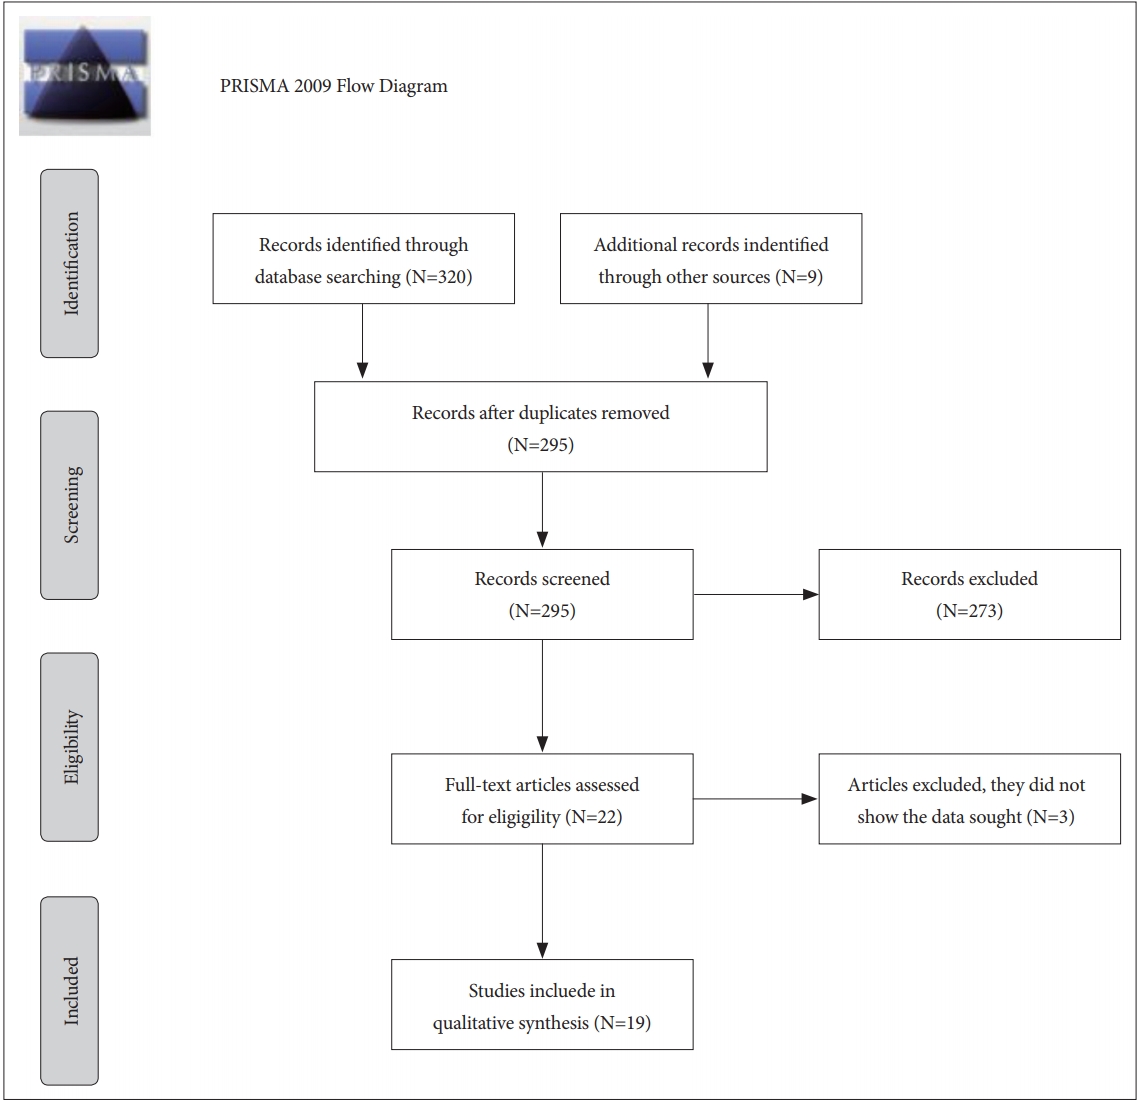
Flow diagram.
Database study selection
We have only included studies with samples of patients with diagnosis of FEP. We did not take into account schizoaffective, schizotypal, schizophreniform, depression, or bipolar disorder. Studies that included drugs effects on illness course have been excluded. Other studies that investigated childhood-onset schizophrenia, articles without longitudinal design or interval between scans equal to or less than one year, reviews, meta-analyses, and case studies, were also excluded.
Data extraction
The following data were extracted from the selected studies: Author, year of publication of the study, number of subjects, age of the patients at first scan, interval between the MRI scan (years/ on average), covariates; analyzed regions, image analysis method, and longitudinal findings (Tables 1, 2, and 3).

Voxel-based morphometry/cortical pattern matching

Region of interest

Image Processing Laboratory, University of Iowa Hospitals and Clinics, USA BRAINS2
Regarding the Tesla value of the MRI scanner, all of the MR images have been acquired with a 1.5-T scanner.
It is important to mention that the authors of the selected articles use different terms for First Episode Psychosis (FEP), including First Episode Schizophrenia (FES and FESZ). For heuristic reasons, we always use a single term, FEP.
This review focused on the relationship between FEP and progressive GM volume change. It was not our objective to research the relationship between this change and different treatments, clinical outcomes, cognitive and functional performance, or scores on different tests.
RESULTS
After reading methods and results, 19 articles were chosen. MRI longitudinal studies used VBM, ROI, and CPM techniques, to analyze the cerebral cortical GM and changes over time in a group of patients with FEP in comparison with a group of control subjects (Table 4).

Results
Voxel based morphometry
Various automated techniques have been developed in recent years, notably VBM. VBM is an automated technique used to search for possible differences in anatomic brain structure between groups, and most commonly, to examine GM. However, it can also be used to identify differences in the brain tissue types (e.g., grey matter, white matter, etc), density, and volume of brain matter, and it is possible to measure the entire brain.
Four articles included the longitudinal image analysis using VBM. In the study by Farrow et al. [15], they observed that 2 years after the first scan, patients with FEP showed decreased volumes of GM in the frontal cortex [right posterio-lateral frontal cortex-Broadmann Area (BA) 44, bilateral medial frontal gyrus/bilateral anterior cingulate gyrus-BA 11/32, bilateral pre-central gyrus-BA 6/4], temporal cortex (left inferior/middle temporal gyrus-BA 20/21), parietal cortex (left post-central gyrus), and right cerebellum. Likewise, a study published by Whitford et al. [16] details that the FEP group showed GM loss over 2.5 years of follow-up interval in the parietal and temporal lobes bilaterally. Mane et al. [17] found decreases in GM in FEP, compared with healthy individuals in the left superior temporal gyrus (STG), and right orbitofrontal gyrus between 1–4 year after first scan. They found that FEP patients showed an increase in bilateral lingual gyrus and right cuneus.
In the longitudinal study by Asami et al. [18], the results presented a progressive GM reduction in the frontal, temporal, and parietal lobes in FEP 1.5 year after the first scan. These regions included temporal regions [bilateral STG including Heschl gyrus (HG)], frontal regions (bilateral superior, middle and inferior frontal gyrus), orbifrontal cortex and precentral gyrus, parietal regions (bilateral postcentral gyrus and supramarginal gyrus), limbic regions (bilateral insula), anterior cingulate gyrus (ACG) (bilateral rostral and dorsal subregions and left subgenual subregion), posterior cingulate gyrus (PGC), and right cerebellum.
Region of interest
ROI analysis method is used in 14 studies, and all of them, except for the study by DeLisi and Hoff [19] showed a progressive decrease in GM volume in different regions over time in FEP patients.
ROI analysis in neuroimaging refers to selecting a specific area or brain region. This method can be used to extract those regions associated to a specific neurological disorder. This technique can be performed using automated or manual tracing of the different brain areas. But manually tracing ROI is time consuming, hard for a large sample study, and there is a lack of reproducibility in different laboratories.
Although ROI analysis is relatively accurate, developments in automated anatomical labeling offer individual anatomical images with a minimum of manual intervention.
ROI automated
In this review, we found a single study that uses automated ROI. DeLisi and Hoff [19] reported that there were no significant differences in total temporal lobe or STG volumes between FEP patients and healthy controls at any of two temporal points: after 5 and 10 years of follow-up.
ROI manual tracing
Firstly, in the study by Kasai et al. [20], although the groups did not differ significantly with respect to the amygdala-hippocampus complex, the FEP group showed a more significant decrease in GM volume in the left posterior STG than the healthy control group, after 1.5 years since the first scan. In an extension of the previous study [21], Kasai et al. [20] found that the FEP group presented a GM reduction in the left HG and left planum temporal (PT) after 1.5 years since the first scan. FEP patients showed a smaller GM volume in the left HG compared with the control group. Regarding to PT, patients presented a GM reduction in the left PT relative to controls.
Results of the study by Nakamura et al. [7] revealed reductions in neocortical grey matter (NCGM). FEP group showed a lower volume in temporal and frontal lobes, but did not differ in the parieto-occipital lobe, in comparison to the controls after 1.5 years since baseline. This study showed that groups differed in lateral ventricles (LV) volume changes. The results determined greater enlargement of total LV in FEP group compared with controls.
The study by Koo et al. [22] was found that the FEP group showed a progressive GM volume reduction in regions of the cingulate gyrus (CG), specifically in the bilateral posterior cingulate gyrus (PGC) and anterior cingulate gyrus (ACG) (subgenual, affective and cognitive) at time 2 compared with time 1 after the first scan (mean: 1.5 years). The study by Lee et al. [23] showed that the GM volume in bilateral insular cortex and temporal lobe, was significantly decreased after 1.5 years between the first and second scan in the FEP group compared with the control group.
This review included four studies by Takahashi and his team. Two studies were performed with different samples of patients and controls from Australia, and two studies with a sample from Japan. The first study by Takahashi et al. [24], with an Australian sample, showed that the FEP patients had greater GM reduction of the insular cortex bilaterally after 2 years of follow-up compared with controls.
In the second study with an Australian sample, carried out in 2009 [25], they found that the FEP patients showed significant GM loss in the left planum polare (PP) , left HG, PT, left rostral STG, and left caudal STG after 1.8 years (on average) since the first scan.
In the third study [8], GM of the STG subregions [planum polare (PP), HG, PT, rostral STG, and caudal STG] were manually traced. The results showed that the FEP patients had a greater STG reduction compared with controls after follow-up (mean: 2.7 years). Likewise, the FEP group showed greater GM loss of the left HG and bilateral caudal STG versus healthy controls. However, there were no significant differences between groups in the volume change of the whole grey matter. The fourth study by Takahashi et al. [26], carried out with the same sample as the third study, revealed that for the fusiform gyrus, the FEP group showed a greater GM decrease than the controls at time 2 compared with time 1 after first scan (mean: 2.7 years). However, it did not show a GM decrease in the middle and inferior temporal gyri.
In the research by Salisbury et al. [27], they observed that the FEP group showed an HG volume reduction in comparison with healthy controls after 1.5 years of follow-up. This study reported on the correlation between longitudinal GM reduction in HG and mismatch negativity (MMN), a biomarker of SSD.
BRAINS2
Included in the ROI technique, the software package BRAINS2 (Image Processing Laboratory, University of Iowa Hospitals and Clinics, USA), is a semi-automated technique which provides measurements of cortical gyrification, brain tissue compartments (GM, white matter, and cerebrospinal fluid), and specific brain substructures. For instance, it is possible to measure the surface area, left and right hemisphere differences, curvature indices of gyri and sulci, or cortical thickness.
Using BRAINS2, we have identified three studies. The article by Andreasen et al. [28], determined that patients with SSD had a greater loss than healthy controls on total cerebral GM, frontal, temporal and parietal GM volumes 2 years after the baseline.
A study by Roiz-Santianez et al. [9] found an overall GM loss in FEP patients and healthy controls over time. Patients and control subjects showed a similar pattern of brain changes. However, the caudate nucleus of healthy subjects showed a greater reduction than patients during the 3-year follow-up period.
Recently, in a new study with the same sample, Roiz-Santianez et al. [29] investigated measurement of cortical thickness. The results showed that total and frontal cortical thinning was less pronounced during the early course of the illness–3 year follow-up period–in patients compared with healthy subjects.
Cortical pattern matching
Only one study used the CPM technique. With this method, cortical anatomy can be compared with measure differences across subjects and across time. CPM involves creating a 3D geometric model of the cortical surface extracted from the MRI volume. Using this procedure, algorithms are applied for measuring cortical thickness, and detect GM abnormalities in patients with schizophrenia.
This study refers to the brain surface contraction related to psychosis [30]. The results showed a relationship between the contraction of the brain surface, and the progressive reduction of GM in patients with FEP. They found that in the FEP group, surface contraction occurred in the dorsal prefrontal and parietal regions over time. In the between-groups comparison, the FEP group showed significantly greater brain surface contraction in the right superior frontal gyrus and the left middle frontal gyri, and in the right pre-/postcentral gyri and adjacent parietal regions. These results were found 2 years after the first scan.
DISCUSSION
We have focused especially on brain structure evolution after the first years of the illness, selecting 19 studies of duration of more than 1 year between assessments, and using different methods of image analysis. Most of the results included in this review show a progressive reduction in cortical GM volume in FEP. However, GM reduction is not uniform in the whole brain. As such, numerous studies have investigated different regions involved in the course of SSD, which are discussed below.
Frontal regions
Seven articles showed GM reductions in frontal lobe areas. Specifically, changes in the frontal cortex [15] and right orbitofrontal gyrus [17] have been observed in patients with FEP. In the studies by Nakamura et al. [7] and Asami et al. [18], FEP patients showed a lower frontal GM volume than healthy controls. However, there is evidence that a subset of brain abnormalities may change over the course of the illness. Results of the research by Andreasen et al. [28] revealed significant results at different times in their research with a larger sample. This study has three time points after the first scan. The authors found that frontal GM in patients with schizophrenia differed significantly from healthy controls during the first inter-scan interval (2 years between baseline and second point); but not during the following intervals, 3 and 4 years after the baseline. These results showed a progressive decrease in GM only during the first years of schizophrenia. It is important to highlight that the data refer to the largest sample included in this review. The progression of GM changes may be influenced by the sample size.
Regarding cortical thickness, the study by Roiz-Santianez et al. [29] showed a significant cortical thinning in patients in total brain and frontal GM at baseline in studies with a larger sample. However, it also found a greater thinning over time in the control group. Specifically, total and frontal cortical thinning was less pronounced in patients compared with healthy subjects. Contrary to these results, others studies showed reduced cortical thickness in frontal regions in first-episode schizophrenia patients [31,32]. It is important to mention that cortical thickness has been related to cognitive dysfunction in FEP patients [33].
In the only study about brain surface contraction in early SSD [30], the authors found that surface contraction occurred in the dorsal prefrontal regions over time in FEP patients. These results suggest a significant correlation between brain surface contraction and GM decrease in the cortical surface, consistent with the results observed in previous studies [31]. Evidence suggests that GM reduction in the prefrontal cortex is related to impairments in cognition, conceptual thinking, verbal memory [6,34], and working memory [35]. Recently, studies suggested a prefrontal dysfunction as a cause of executive function deficit in SSD patients [36,37].
Parietal regions
In relation to the parietal lobes (PL), six studies investigated changes in GM in this region in FEP patients. In comparison with controls, five studies revealed that the FEP group showed differences in GM volume over time [15,16,18,28,30]. However, in the study by Nakamura et al. [7], FEP patients did not show a GM decrease in the parieto-occipital lobe. Parietal lobes are involved in neuropsychological functions which are affected in SSD patients, such as attentional and memory dysfunctions or impairments of motor control [38]. Studies of patients with SSD have found a decrease in GM volume in the PL and its correlation with cognitive performance in the early course of SSD [39,40], as well as its association with psychotic experiences [41].
Temporal and occipital regions
58% of the selected longitudinal studies have found a progressive reduction in brain volume in the early years of the disease in temporal regions [15,16,23,28], including GM reductions in STG [17,18,20], subregions HG and PT) [8,21,25,27]. The results showed that FEP patients have a greater decrease in GM in this region. However, in the study of DeLisi and Hoff [19] ten years after the first scan, the results showed no differences in STG volume in FEP patients, compared with control group. The study by Andreasen et al. [28] showed a GM reduction in the first years but not in the later years. This pattern may be affected due to the larger sample size. With respect to this, studies have determined that SSD patients show more severe impairment in attention, as well as in verbal and visual learning [42]. Therefore, morphological abnormalities of the STG related to SSD have been reported in numerous studies [25,43,44]. However, most recent research in this area showed conflicting results. The study by Schaufelberger et al. [45] revealed a GM increase in the left STG in FEP patients, suggesting a reversible course in the STG during the illness.
Related to the occipital lobe, in this review we found a study [17] which showed an increase in bilateral lingual gyrus and right cuneus in FEP patients, in contrast with the results suggesting a positive relationship between schizophrenia and impairment in visual function.
Subcortical structures
The subcortical regions have been examined in several studies, and we found controversial results. GM reductions of the cingulate and fusiform gyrus [22,26], were found in FEP. Interestingly, most of the results of this review determined that FEP patients did not show volume decreases in subcortical regions over the follow-up interval. In the study by Asami et al. [18], FEP patients showed a GM reduction in limbic regions, such as the bilateral insula. Kasai et al. [20] determined that the groups do not significantly differ as far as the amygdala-hippocampus volume is concerned. In particular, Roiz-Santianez et al. [9], with a larger sample than others studies, found that the caudate nucleus of control subjects showed a reduction compared with the FEP patients.
Regarding the insular lobe, in the study by Takahashi et al. [24], patients with FEP showed a bilateral GM reduction of the insular cortex. Likewise, in a recent study by Lee et al. [23], bilateral insular cortex and temporal lobe GM decreased over time in the early course of psychosis. The insular connection with the limbic system makes it an object of study in SSD. Also, there is evidence of the positive relationship between a GM decrease in this region with emotional and cognitive dysfunctions in patients with FEP [46] and severity of clinical symptoms [47].
Previous longitudinal studies suggest that these conflicting results can be influenced by treatment effects [48]. In this review, FEP patients have been exposed to different treatments. However, apart from treatment effects, there is evidence to support the reductions in these regions in SSD patients. Specifically, abnormalities in GM in frontal, temporal, and subcortical regions, such as the basal ganglia, thalamus, and hippocampal complex, have been associated with learning, motor, and emotional impairments in patients with SSD. Therefore, dysfunctions in limbic system have been connected to language processing impairment in SDD [49]. Furthermore, the limbic system is responsible for the response and memory of emotions, functions which are affected in patients with SSD [50,51].
Recently, in relation to the changes that occurred in the subcortical region, a meta-analysis by the ENIGMA consortium, with 2028 SSD patients and 2540 healthy controls, determined that patients with SSD had smaller hippocampus, amygdala, thalamus, and accumbens volumes than healthy controls [52].
Cerebellum
There are two studies showing a GM decrease in the cerebellum in FEP patients compared with healthy individuals [15,16]. Here, it is important to take into account the role of the cerebellum in motor, cognition, and affective functions [53,54]. Longitudinal studies in patients at risk of SSD observed that cerebellar regions show anatomical and functional alterations in the onset of illness [55]. Previous findings support that motor function and postural control [56,57], the modulation of affect and emotion [58], and cognition functions [59] are affected in the course of SSD. On the other hand, there is evidence for the relationship between cerebellar dysfunction and psychiatric symptoms [60]. One important author in this context is Andreasen, and her theory called “cognitive dysmetria,” which suggests a dysfunction in the integration of cortical-subcortical-cerebellar connection [61]. Specifically, the cognitive dysmetria hypothesis determined that this dysfunction involves cerebellar and subcortical circuits in alterations in the motor, cognitive, and social functions present in the patients with SSD [62].
Lateral ventricle volume
Related to LV, in this review, we found that in the study by Nakamura et al. [7], FEP patients showed greater enlargement in LV and smaller volume in temporal and frontal lobes than controls. Structural neuroimaging studies have investigated an association between SSD and abnormalities in brain morphology, such as ventricular enlargement [43,63,64]. Ventricular enlargement is one of the most common findings in studies focused on research into SSD, and numerous studies have suggested a ventricular enlargement in patients with FEP and SSD [65-67], and longitudinal studies revealed a progressive ventricular enlargement [68-70] related to progressive reduction of GM [71].
Strengths and limitations
An advantage of this review is that it collected information about global and regional GM volume changes during the first stages of illness, with the aim of obtaining comparable results. These findings enable us to recognize the areas involved in the disease and its relationship with it to achieve better early intervention in the course of the disease. We provide a global perspective of the research between FEP and progressive GM decrease. Furthermore, this review explores the different existing techniques applied to the field of psychiatry; specifically, in SSD. Despite these strengths, this study has several limitations. We did not focus on the relationship between GM changes and different treatments or effects of medication. We did not include the effects in the results of age, gender race, or ethnicity, during the follow-up interval. Finally, this review included studies that have a follow-up period that is longer than 1.5 years to observe progressive changes in the onset of illness. Articles with an interval between assessments equal or less than 1 year were not included.
CONCLUSION
In summary, the present review of longitudinal studies provides evidence that there is a relationship between the cortical reductions of GM reported in MRI studies and the early course of SSD. These findings indicate wide-spread decreases in grey matter through the brain. These results could be related to causes as medication, function or cognition. Longer follow-up studies in large cohorts are needed in order to shed more light in grey matter progression in the first years after the onset of illness and its clinical correlates. Future research will try to find out the implication that these results may have on the clinical evolution of the disease.