Normative Data for the Logical Memory Subtest of the Wechsler Memory Scale-IV in Middle-Aged and Elderly Korean People
Article information
 , Dahyun Yi,2, Haejung Joung1, Eun Hyun Seo2, Young Hwa Lee1, Min Soo Byun3, Jun Ho Lee1, So Yeon Jeon1, Jun-Young Lee4,5, Bo Kyung Sohn6, Dong Young Lee,1,3,5, KBASE Research Group*
Abstract
Objective
The purpose of this study is to identify the demographic variables that are affecting performances on the Logical Memory (LM) subtest included in the Korean version of the Wechsler Memory Scale (WMS)-IV and to provide normative data on the LM subtest for the middle-age and elderly Korean people.
Methods
The participants were 435 non-demented adults aging from 50 to 90 and with the educational level ranging from 0 to 21 years.
Results
Age and education were found to be significantly associated with performance on the LM subtest, while gender effect was not statistically significant. Therefore, we stratified the norm blocks by age and education. Age was divided into three groups: 50–59, 60–74, and 75–90 years. Education was stratified into three groups: 0–8 years, 9–12 years, and 13 years or more.
Conclusion
The normative data provided in the current study are expected to be useful in clinical and research settings to detect or define subtle changes in episodic memory in Korean adults and elderly, and can also be used for cross-cultural comparison of verbal episodic memory performance among elderly populations using different languages.
INTRODUCTION
The Logical Memory (LM) subtest is the most frequently administered subtest in the Wechsler Memory Scale, the 4th edition (WMS-IV) [1], which is designed to measure verbal episodic memory [2] The LM subtest is consisted of three parts: LM I (immediate recall), LM II (delayed recall), and LM Recognition (delayed recognition). In the LM I, subjects are required to immediately recall details of two short passages. In the LM II, subjects are asked to recall the passages after a 20 to 30-minute delay. In the LM Recognition, subjects are given yes or no questions regarding the passages learned earlier. The LM subtest is considered as a useful and effective measure of episodic memory as it addresses three processes involved in memory-encoding, storage and recall [3]. The narrative nature of the recall is also known to be sensitive in detecting cognitive decline in early dementia since prose recall depends upon a range of high-level cognitive functions such as episodic memory, conceptual organization, and schema formation [4]. The LM subtest is not only useful for distinguishing certain types of dementia such as Alzheimer’s disease (AD) dementia but is also known as a tool that can detect subtle memory changes in the individuals with mild cognitive impairment (MCI) [3,5-8]. In addition, the LM subtest can be used to discriminate between amnestic MCI and normal aging and to predict conversion to AD from MCI [9]. It is also used to distinguish AD dementia from non-AD dementia, such as dementia with Lewy bodies (DLB) and vascular dementia (VD) [10,11].
The LM subtest included in the Korean version of the WMS-IV (K-WMS-IV) was developed and standardized in 2012 [12]. Contrary to the original English version of the WMS-IV, which is consisted of an adult version with two full stories (A and B) and an older adults version with a shortened story A and the original story B, only the adult version with the full stories is available in the Korean version of the WMS-IV.
As in most other cognitive function tests, performance on the LM subtest was shown to be affected by demographic variables from the previous studies. For example. it was shown that the LM subtest score decreased in older and relatively less educated population [13-18]. However, the published normative data of the K-WMS-IV are limited as the data for older adults are unavailable, providing data for only the individuals with age between 16 and 69. Moreover, despite the importance of considering the effects of education, the published normative data of the K-WMS-IV do not directly incorporate the levels of education; instead, it only provides limited reference of cutoff points for standard scores derived for all the subtests included in the K-WMS-IV. Direct incorporation of the effects of education for development of the normative data is particularly important for the older adults in South Korea given that about 75.3 % of Korean elderly population in present days have less than 9 years of education [19].
Hence, we aimed to identify the demographic variables affecting the performances on the LM subtest of the K-WMS-IV and to provide normative data for the middle-aged and elderly Korean people.
METHODS
Study population
A total of 435 community dwelling healthy non-demented participants (243 females and 192 males; 50–90 years of age; and zero to 21 years of education) were included in this study. All subjects were participants of the Korean Brain Aging Study for the Early Diagnosis and Prediction of Alzheimer’s disease (KBASE), an ongoing prospective cohort study, which initiated in 2014 and was approved by Seoul National University Hospital Institutional Review Board (IRB: 1401-027-547). The details of the KBASE cohort are provided in a previous study [20]. Briefly, each participant was examined by a psychiatrist with advanced training in neuropsychiatry and dementia research according to the KBASE protocol based on the Korean version of Consortium to Establish a Registry for Alzheimer’s disease (CERAD) assessment battery [21] in order to establish a diagnosis. Reliable informants were also interviewed to acquire accurate information regarding cognitive and functional changes in addition to their medical history. A clinical review panel comprising several board-certified psychiatrists and clinical neuropsychologist with expertise in dementia research made clinical decisions including a dementia diagnosis for exclusion. This panel reviewed all available raw data resulting from the clinical evaluations.
All participants satisfied the entry criteria, which excluded dementia and other serious medical, psychiatric, and neurological disorders that could affect mental function. Psychiatrists diagnosed dementia using the criteria detailed in Diagnostic and Statistical Manual of Mental Disorders, 4th Edition, Text Revision (DSM-IV-TR) [22]. We excluded candidates with evidence of focal brain lesions on magnetic resonance image; the presence of severe behavioral or communication problems that would make a clinical examination difficult; absence of a reliable informant; and, inability to read Korean. All participants possessed adequate vision and hearing, although many wore glasses and some required hearing aids. Individuals with minor medical conditions (e.g., diabetes with no serious complications, essential hypertension, mild hearing loss, etc.) were included in the study.
Measurements
The LM subtest in the K-WMS-IV was equivalent to that of the original full standard English version of the LM in the WMS-IV [1,12]. The basic storyline is similar with the original version, but the names of person, city and streets were replaced with more suitable Korean substitutes [12]. The scoring guideline was similarly based on the guideline of the original English version of the LM subtest. Each part is based on two thematically independent stories (story A and story B). In the LM I, the two narrative stories (story A and story B) are verbally given and the examinee is required to immediately recall the stories as much as he/she can. In the LM II, free recall of two stories is elicited after a 20 to 30-minute delay. Each correct detail was awarded with one score point. The 30 recognition questions (either yes or no) about the two stories are given subsequently to assess the recognition ability.
- LM I Total (maximum score=50): LM I Story A (score range 0–25)+LM I Story B (score range 0–25)
- LM II Total (maximum score=50): LM II Story A (score range 0–25)+LM II Story B (score range 0–25)
- LM Recognition (maximum score=30): Story A (score range 0–15)+Story B (score range 0–15)
Three trained psychometrists administered the LM subtest according to the published administration manual. During the 20 to 30-minute delay, the participants were given tests of visuospatial skills and non-verbal memory.
Statistical analysis
Bivariate correlational analyses were performed to examine the associations between the demographic variables and the LM subtest scores. Age and education were entered as continuous variables and gender was coded as 0 or 1 for female and male, respectively. Hierarchical multiple linear regression analyses were used to assess the relative contribution of the variables.
A series of 3×3×2 analyses of variance (ANOVA) was performed to determine any main effects and interaction of age (50–59, 60–74, 75–90 years), education (0–8, 9–12, ≥13 years) and gender on the tests.
RESULTS
The correlations analyses between the demographic variables and the LM subtest scores showed that age and education were significantly correlated with the LM scores whereas gender was not (Table 1).

Correlations of age, education, and gender with the scores of the LM subtest
The relative effects of age, education and gender on the scores of the LM subtest were explored by using the regression analyses where each variable was entered separately. Age accounted for 15.0–20.7% of the variance, while education accounted for 9.8–14.2%. Gender accounted for less than 1%. When education was entered hierarchically after age, its effect was reduced slightly to a range between 5.9–9.4% (Table 2).

Hierarchical multiple linear regression of age and education on the Logical Memory subtest scores
Since performance on the LM subtest was affected by age and education and not by gender, it was decided to stratify the norms by these two variables (Figure 1). The scores were divided into 3 age groups and 3 education levels, based on the observation of the frequency distribution of the current data to ensure sufficient samples in each cell.
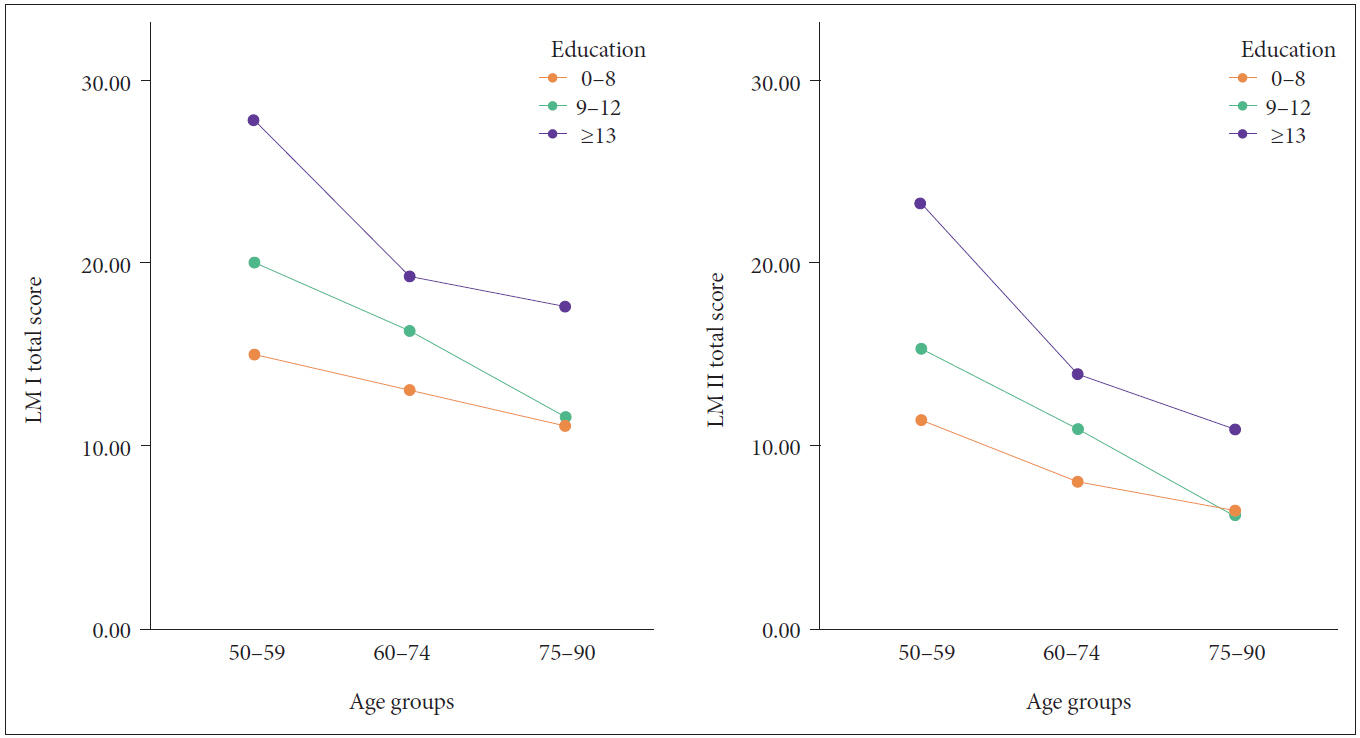
Performance on the LM I and LM II as a function of 3 age groups and 3 education levels. LM: Logical Memory.
Three-way ANOVA was also conducted to determine presence of interaction effects in addition to main effects among the demographic variables on the LM subtest scores. It was shown that age and education were found to have significant main effects on the all of the LM subtest scores; but, all LM scores were not significantly influenced by gender. There were no significant interactions between age, gender or education for all LM subtest scores. Scores on the LM subtest scores decreased with increasing age and fewer years of education. The effects of age was more pronounced on LM II Total than LM I Total, whereas the effects of education were more pronounced on LM I Total than LM II Total (LM I Total: Age: F(2, 434)=19.61, p<0.001; Education: F(2, 434)=35.45, p<0.001; Age×Education: F(4, 434)=2.29, p>0.05; LM II Total: Age: F(2, 434)=26.79, p<0.001; Education: F(2, 434)=27.70, p<0.001; Age×Education: F(4, 434)=2.39, p>0.05).
Normative data
Based on the above results on the effects of the demographic variables on the LM scores, the LM scores were stratified by age and education, and not by gender. As mentioned above, age was stratified into three groups (50–59, 60–74, and 75–90 years of age) and the educational groups were divided into three strata (0–8, 9–12, ≥13 years of education). Of note, given the fact that most of the participants in the 50–59 age-range were relatively highly educated resulting in insufficient number of samples in the young and less educated group, the results led to the decision to provide the normative data for the 50–59 age group with two education levels (i.e., 9–12 and≥13). All three levels of education were used for the normative data of the 60–74 and 75–90 age groups. The normative data of the LM subtest total scores by the demographic variables are shown in the forms of mean, standard deviation, median, 5th percentile, and 95th percentile (Table 3).

Statistical properties for age, education, gender, LM I Total, LM II Total, and LM Recognition for each normative group
DISCUSSION
The aim of the study was to examine the effect of age, education, and gender on the performances of non-demented older adults on the LM subtest and to provide normative data in a large and diverse population in Korea. It was shown that older age and low level of education was associated with poorer performances on the LM subtest. However, there was no significant influence of gender on the LM scores. The current results also suggest that age was indeed the demographic factor that accounted for the greatest amount of variance in the performances on the LM subtest, with education closely following age. Interestingly, it was found that age had greater effect on the delayed recall while education had greater effect on the immediate recall. Therefore, it is crucial to directly consider the level of education in addition to age when creating the normative data of the LM subtest. Because this study included subjects with diverse educational levels, ranging from 0 to 21 years, the current study was able to demonstrated the effects of education on the LM subtest scores much better than the previously published normative data for Korean adults.
In terms of the effects of education on the LM scores, our findings were consistent with the findings from the previous studies [13-17,23,24], which showed that poorer performances on the LM subtest were observed in less educated group. In Danish and Italian studies, there was a significant effect of education on performances on the LM [15,16]. In a Mexican-American study, the level of education was the strongest demographic predictor of the LM I and II performances [17]. A previous study that estimated the influence of education on the LM test in the Korean version of WMS-IV among adults aging between 16 and 69 showed that education was an important determinant for the LM subtest scores and its influence on the LM performance increased as participants got older [24]. Although a Japanese normative study of the LM for older adults reported that the LM I and not the LM II related to educational level [25], this may be due to small sample size (n=50) and relatively narrow range of educational level (6–18 years). The significant effect of age on the performances on the LM subtest found in this study is also in line with numerous previous reports [13–15,18,24,26,27]. In contrast to the effects of education and age, the effects of gender was not significant on any of the LM subtest scores, which is also consistent with the results of the previous studies conducted in other countries [15,17,25].
Taking the results of the analyses together, the normative data of the LM subtest were stratified by both age and education with three age groups and three educational groups. We were able to provide the first reliable normative reference of the LM subtest with adequate number of participants with diverse educational background in Korean adults aging from 50 to 90 years old. Since this study excluded individuals with dementia and other underlying severe major illnesses or psychiatric conditions that might affect cognitive function based on strict criteria, it is convinced that the normative data is enumerated by relatively healthy individuals.
The normative data not only provided mean and standard deviation (SD) but also median, 5th and 95th percentile values for easy clinical utility. Information of mean and SD would be useful to define MCI based on the calculation of z-scores [28]. The 5th percentile value may be useful in diagnosing dementia since it was suggested as cut-off value of neuropsychological tests for implying cognitive deficit according to the National Institute of Neurological and Communicative Diseases and Stroke/Alzheimer’s Disease and Related Disorders Association (NINCDS-ADRDA) criteria for AD [29].
Nevertheless, a couple of possible limitations need to be mentioned. First, the current study does not provide normative reference for the 50–59 age group with 0–8 years of education. Given that the individuals in this particular age group are generally highly educated in general Korean population in the present day, it can be presumed that this will not affect users much. However, given the notable disparity of educational attainment as well as socioeconomic background between the adults in their 50 s and the adults who are 65 and older, the normative references need to be updated more regularly as the young and highly educated group ages. Second, the current normative data were, unfortunately, based on the version with two full stories that parallels the adult version of the original English WMS-IV as the shortened older adult version was unavailable in Korean. Therefore, comparisons of the performances on the LM across nations may face some challenges and cautious approach is warranted.
In summary, the LM subtest scores were influenced by education and age but not by gender. The normative data provided in the current study will allow clinicians and researchers to better interpret the LM test scores and understand the levels of verbal episodic memory.
Acknowledgements
This study was supported by a grant from Ministry of Science and ICT, Republic of Korea (Grant No. NRF-2014M3C7A1046042).
Notes
The authors have no potential conflicts of interest to disclose.
Author Contributions
Conceptualization: Dong Young Lee, Dahyun Yi. Data curation: Yebin Ahn. Formal analysis: Yebin Ahn, Dahyun Yi. Funding acquisition: Dong Young Lee. Investigation: Haejung Joung, Eun Hyun Seo, Young Hwa Lee, Min Soo Byun, Jun Ho Lee, So Yeon Jeon, Jun-Young Lee, Bo Kyung Sohn. Methodology: Haejung Joung, Eun Hyun Seo, Young Hwa Lee, Min Soo Byun, Jun Ho Lee, So Yeon Jeon, Jun-Young Lee, Bo Kyung Sohn. Project administration: Haejung Joung, Eun Hyun Seo, Young Hwa Lee, Min Soo Byun, Jun Ho Lee, So Yeon Jeon, Jun-Young Lee, Bo Kyung Sohn. Resources: Haejung Joung, Eun Hyun Seo, Young Hwa Lee, Min Soo Byun, Jun Ho Lee, So Yeon Jeon, Jun-Young Lee, Bo Kyung Sohn. Supervision: Dong Young Lee, Dahyun Yi. Validation: Dong Young Lee, Dahyun Yi. Visualization: Yebin Ahn. Writing—original draft: Yebin Ahn, Eun Hyun Seo. Writing—review & editing: Dong Young Lee, Dahyun Yi.