Neural Mechanisms in Eating Behaviors: A Pilot fMRI Study of Emotional Processing
Article information

Abstract
Objective
Emotional processing dysfunction evident in eating disorders (ED) such as anorexia nervosa (AN) and bulimia nervosa (BN), is considered relevant to the development and maintenance of these disorders. The purpose of the current functional magnetic resonance imaging (fMRI) study was to pilot a comparison of the activity of the fronto-limbic and fronto-striatal brain areas during an emotion processing task in persons with ED.
Methods
24 women patients with ED were scanned, while showing emotionally stimulating (pleasant, unpleasant) and neutral images from the International Affective Picture System (IAPS).
Results
During the pleasant condition, significant differences in Dorsolateral Prefrontal Cortex (DLPFC) activations were found with AN participants presenting greater activation compared to BN and ED comorbid groups (EDc) and healthy controls also showing greater activation of this brain area compared to BN and EDc. Left putamen was less activated in EDc compared to both controls (C) and AN. During the unpleasant condition, AN participants showed hyperactivation of the Orbito-Frontal Cortex (OFC) when compared to EDc.
Conclusion
This study highlights the potential functional relevance of brain areas that have been associated with self-control. These findings should help advance understanding the neural substrate of ED, though they should be considered as preliminary and be cautiously interpreted.
INTRODUCTION
Recent studies in eating disorders (ED) have found evidence of emotional awareness and emotion processing alterations in ED [1-5]. However, the current literature is not sufficiently informative regarding the nature of emotional processing in ED to develop a model on which to base therapeutic interventions. Emotional processes currently identified in ED implicate amygdalo-cortical and cortico-striato-thalamo-cortical re-entrant circuits [6-10] in creating dysregulated appetitive behaviours (e.g., food restriction, vomiting) in ED [11].
Based upon current studies of emotional processing in ED, persons with anorexia nervosa (AN) may present with exaggerated cognitive control and seek to reduce negative emotions and anxiety symptoms by restricting food; while those with bulimia nervosa (BN) may have deficient cognitive control, thus increasing the instability and erratic responding to appetitive stimuli and obtaining a reduction of negative emotions with binge eating and purging [12,13]. Such impulsive eating behaviours are more frequently seen in EDs associated with borderline personality traits [14-18]. Based on this cognitive-control model, extremes of eating behaviour would emerge from an altered balance of reward and inhibitory processing [10]. Consequently this model for ED could be understood across an impulsive-compulsive spectrum: from obsessive disorders, with a greater tendency to harm avoidance and compulsive behaviours at the compulsive end (AN restrictive) in contrast to those with high impulsivity, with a tendency towards harm avoidance-AN binge-purging, BN and borderline personality disorder (BPD)- [10,19-22]. Regarding brain functioning, corticostriatal circuit dysfunction may be implicated in suppressing or inhibiting inappropriate behaviours that underpin impulsive and compulsive symptomatology in obsessive-compulsive disorders [22-24] and also in emotional processing and regulation processes [25-27], and therefore they may be of interest in the study of ED.
Neuroimaging techniques offer a window into the activity of neuronal circuits involved in emotional processing in ED [28-30]. These functional MRI (fMRI) studies in ED have used body images or food paradigms as aversive stimuli mainly [31-40]. However, the paradigms and methodologies used in these studies vary greatly, making it difficult to draw coherent conclusions. Moreover, compared to these previous paradigms, the use of general emotional stimuli may allow better understanding of emotional processing in general in EDs, since emotional processing is considered a core symptom related to eating behaviours (i.e., restricting, purging) and it might not be only a consequence of food or body shape. From this point of view the International Affective Picture System (IAPS) [41], which consist of a well-characterized collection of visual coloured images designed to evoke either neutral, positive or negative emotional states, seems a suitable tool. To our knowledge, although some studies have used IAPS to test the emotional reactivity of ED patients to social situations [42], no previous fMRI emotional processing studies in ED have focused on general, as opposed to disease-specific, emotional stimuli. fMRI studies in healthy persons have identified brain networks involved in emotion processing mechanisms, a number of them employing images from the IAPS [41]. In healthy individuals, viewing of emotional pictures is associated with activation in prefrontal cortex areas (dorsolateral, ventromedial and orbitofrontal) [43-46], amygdala-hippocampal regions [44,45] and basal ganglia [44], among others.
The purpose of the present study was to explore the general emotional processing in ED, through using a small subset of complex visual scenes (depicting happiness, fear, anger, or threat), derived from the IAPS as stimuli [41]. Based on the above previous studies, we hypothesized that AN patients may be able to inhibit appetite and exert extraordinary self-control because of exaggerated cortico-amygdalar and cortico-striatal circuit function (hyperactivation); whereas individuals with BN may be more vulnerable to overeating because they have less top down regulation, i.e., self-control, probably due to a lower activation of cortico-amygdalar and cortico-striatal circuits (hypoactivation) when presented with emotional eliciting cues (Figure 1). On the other hand, a high prevalence of borderline personality disorder has been reported in BN and purgative AN [16], which sometimes might complicate the differential diagnosis and have BPD-associated hypofunction of regions of prefrontal cortex [47]. A subgroup study of ED with BPD comorbidity was performed to differentiate from the other pure ED groups.

Diagram of impulsive-compulsive spectrum disorders. On the left: “compulsive end,” mainly represented by disorders where obsessions and compulsions are prominent (AN, OCD, Tourette Sd: Tourette’s Syndrome). On the right: “impulsive end,” where impulsivity plays a crucial role (e.g., BN, EDc, and BPD).[20] Tourette Sd: Tourette’s Syndrome, OCD: Obsessive Compulsive Disorder, ANr: restrictive Anorexia Nervosa, ANbp: binge purging type Anorexia Nervosa, BN: Bulimia Nervosa, EDc: Eating Disorder with comorbid with borderline personality disorder.
METHODS
Subjects
Twenty-four female patients diagnosed with either AN (n=8), BN (n=9), or eating disorder comorbid with borderline personality disorder, ED+BPD (EDc) (n=7) were recruited. Patients with EDc had comorbid diagnoses of BPD and BN. All of them were current outpatients at a major teaching Hospital in Madrid (Spain), were stable (had not had any hospitalization during the last year and were on regular ambulatory treatment), had similar sociodemographic characteristics and were receiving regular ambulatory treatment (all of them were receiving Cognitive Behavioural Therapy, and might be taking SSRI or benzodiazepines). None of them had been taking antipsychotics for the last 6 months.
Diagnoses were made by experienced psychiatrists (M.D.M; R.M.M.R) according to DSM-IV-TR criteria [48]; clinical diagnostic subtyping was made on the basis of current symptoms at the time of the study.
A control group of healthy females, C (n=19), were recruited by advertisement at University Complutense of Madrid and Hospital ClÍnico San Carlos, Madrid. They were of the same age range, education and socioeconomic level.
All patients and controls were interviewed by means of the Structured Clinical Interview for DSM-IV (SCID-I and II) [49] to evaluate Axis I and Axis II diagnosis, and to exclude comorbid Axis I mental disorders in the ED groups. Comprehensive assessments were undertaken to exclude any potential major medical disease such as a history of head trauma, neurological disease, substance use disorders or any other major medical illnesses. We also ensured that controls had no history of ED or any current of past Axis I or Axis II disorder.
Ethical approval for the study was obtained at Hospital ClÍnico San Carlos, Madrid Clinical Ethics Committee (E-07/121). Written informed consent was provided by all participants.
Impulsivity and bulimic eating behaviors were assessed using both self-report questionnaire measures: 1) impulsivity was assessed with the Barratt impulsiveness Scale (BIS) [50,51] a 30-item questionnaire describing common impulsive or non-impulsive (for reverse scored Ítems) behaviors and preferences. Items are scored on a 4-point scale: rarely/never=1, occasionally=2, often=3, almost always/always=4. The BIS is one of the most commonly administered self-report measures for the assessment of impulsiveness in both research and clinical settings. For the behavioural assessment of impulsivity, we focused on the general punctuation scale. 2) Bulimic behaviors were assessed with a self-rating scale, the Bulimic Investigatory Test, Edinburgh (BITE) for the detection and description of binge eating [52,53]. BITE is a 33-item self-report measure designed to identify individuals with symptoms of bulimia or binge eating. It consists of two subscales: the symptom scale (BITE-sas), which measures the degree of symptoms present, and the severity scale (BITE-ss), which provides an index of the severity of binging and purging behavior as defined by their frequency.
Procedures
Imaging acquisition
BOLD functional images were obtained for all participants on a 1.5T General Electric Sigma MRI scanner (GE, Milwaukee, WI, USA) [repetition time (TR)/echo time (TE)=3,000/50 ms, field of view (FOV)=22×22 cm, 64×64 pixel matrix, 20 axial slices per scan, slice thickness=5 mm, gap=1.5 mm].
A total of 204 whole brain volumes were acquired for each run. The first two scans were discarded from analysis to allow magnetic saturation effects. All scanning parameters were selected to optimize the quality of the BOLD signal while maintaining a sufficient number of slices to acquire whole-brain data. Stimuli were presented via a back-projection system.
Experimental paradigm
The paradigm consisted of two sequences of alternating blocks with experimental conditions that involved the presentation of “emotionally stimulating’’ versus neutral images from the IAPS (pleasant-neutral and unpleasant-neutral sequences). IAPS includes a standardized and well-characterized collection of visual coloured images designed to evoke either neutral, positive or negative emotional states [54]. Twenty unpleasant pictures selected from the IAPS, consisted of negative-emotionally evocative images, e.g., injured people, snakes or spiders; while other 20 pleasant pictures were selected from IAPS and consisted of positive-emotion evoking images, e.g., images of happy couples and family or nice landscapes. Finally 20 neutral-valenced pictures were selected to show daily-life objects such as chairs, books or tables.
Each sequence consisted of a total of 7 blocks (3 stimulating blocks interleaved into 4 neutral control blocks). Each experimental block consisted of 7 stimuli sequentially presented for 3 seconds. The order of the stimuli was counterbalanced across participants. The paradigm was repeated twice for each participant.
Subjects rested supine in the scanner while viewing the images and were instructed to keep their eyes open to watch all images and to allow themselves to “feel whatever emotion the slides produced.” During the rest condition, 30 seconds before the first image block and between each positive and negative image block, the patient was told to “relax” (Figure 2).

fMRI paradigms. Alternated blocks Neutral/Pleasant (N/ P), Neutral/Unpleasant (N/U). fMRI: functional magnetic resonance imaging, IAPS: the International Affective Picture System.
Image pre-processing and data analyses
We performed image processing and statistical analyses fMRI data using the FMRIB Software Library (F.S.L.) version 4.1.9 (FMRIB, Oxford, Oxfordshire, UK). Image pre-processing included motion correction, slice timing correction, normalization to the MNI 152 standard space, and spatial smoothing with a 10 mm full width at half maximum (FWHM). Voxel size after the reconstruction was 2×2×2 mm3.
Statistics
We analyzed the data using SPSS 15.0 (SPSS Inc., Chicago, IL, USA). Descriptive statistics were used to report the frequencies for the categorical variables and the mean value with the standard deviation (SD) for the continuous variables. Unpaired ANOVA and T-test were used to evaluate the differences among differente groups. To analyse the images, we performed planned three-stage statistical analyses:
1) In the first stage, we obtained the mean response for each subject to the pleasant and unpleasant paradigms. In a first level analysis, correlations between the BOLD response and emotional condition in each single session were examined at whole brain level. The emotional stimuli were modelled by a square waveform convolved with a gamma function plus temporal and dispersion derivatives. The contrasts of interest were pleasant versus neutral and unpleasant versus neutral. In a second level of analysis, results were accumulated across sessions to obtain the mean response for each subject using a FWE-corrected cluster extent threshold (pFWE=0.05) to correct for multiple comparisons.
2) The second stage involved planned within-group and between-group analyses. Specifically for between group analyses we analysed all ED groups combined compared to controls. We also analysed the subgroups as ED are recognised as phenotypically heterogeneous comprising AN, BN and comorbid with BPD groups.
• For each group, a t-test was defined in order to study the mean group effect, that is, if the group activated on average
• In order to find significant differences between groups, C group was compared with the whole eating disorder group (ED) and each subgroup (AN, BN, EDc) and also subgroups were compared between them. For each comparison, two t-tests were defined to find out, not only the existence of differences between groups, but also the direction of these differences.
3) Finally, on the third stage of analysis, we analysed different Regions of Interest (ROI). For each ROI, we report activations that surpass the uncorrected threshold (punc<0.001), and at the same time surpass the FWE-corrected cluster extent threshold (pFWE=0.05) to correct for multiple comparisons.
ROIs were defined using the “Harvard-Oxford Atlas” [55] and included the amygdala, striatum (caudate and putamen) and parts of prefrontal cortex (PFC) such as the dorsolateral prefrontal cortex (DLPFC), orbitofrontal cortex (OFC), medial prefrontal cortex (MPFC) and frontal pole (FP), areas involved in emotion processing and regulation [6,9,25].
RESULTS
Sociodemographic data are summarized in Table 1. There were no significant differences in mean age between the ED as a group compared to controls. Controls were significantly younger on average compared to the AN and EDc groups (C<AN, p=0.05). These differences (all patients and controls ranged between 20 and 40 years) were not considered significant for functional analysis and given the small sample they were not analysed as a covariate.
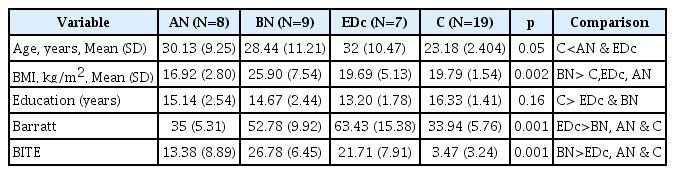
Demographic variables
On average, body mass index in BN was higher compared to all other three groups, though the greatest difference was found between AN and BN, as expected.
Education level was similar between eating disorder groups but participants in the healthy control group showed greater educational level compared to BN and EDc groups.
Pleasant paradigm, within group analysis
Group activation maps are shown in Table 2. All areas of emotional processing and regulation measured, cortical and subcortical (PFC, amygdala and striatum) were activated in the control group. Similar results were obtained for AN and BN groups excepting the regions: VMPFC and left putamen in AN, left putamen and caudate in BN. EDc did not show activation in the subcortical regions (amygdala, caudate and putamen) except for left caudate, although all prefrontal areas were activated in this group.

Pleasant paradigm
Unpleasant paradigm, within group analysis
Group activation differences are showed in Table 3.

Unpleasant paradigm
When comparing unpleasant-neutral images between subgroups we found that: control group showed more activation in all selected regions when exposed to unpleasant images compared to neutral ones, except for VMPFC and left putamen. Patients with AN mainly activated DLPFC, FP and left amygdala, while those with BN and EDc barely activated FP and DLPFC respectively.
Pleasant paradigm, between group analysis
When comparing the activation between patients as a whole group (all ED subtypes) and controls, no statistically significant differences were found in any of the brain areas selected in this study.
When doing the analysis by subgroups and by ROI, the following differences were found (Table 4 only showing those contrasts that became statistically significant):

Pleasant paradigm
- DLPFC was more activated in AN and C compared to BN and EDc. There was also a tendency towards greater activation of DLPFC in AN versus controls (x: 50.0, y: 34.0, z:12.0; p: 0.0015).
- Left putamen was more activated in control group compared to EDc and in AN compared to EDc.
- FP showed greater activation in AN compared to BN and EDc, as well as in controls compared to AN (C>AN>BN> EDc).
Activation maps of more representative results are shown below (Figures 3 and 4). Images from fMRI show brain activation (colored dots) overlaid on a transverse slice of the corresponding structural brain image (grayscale).
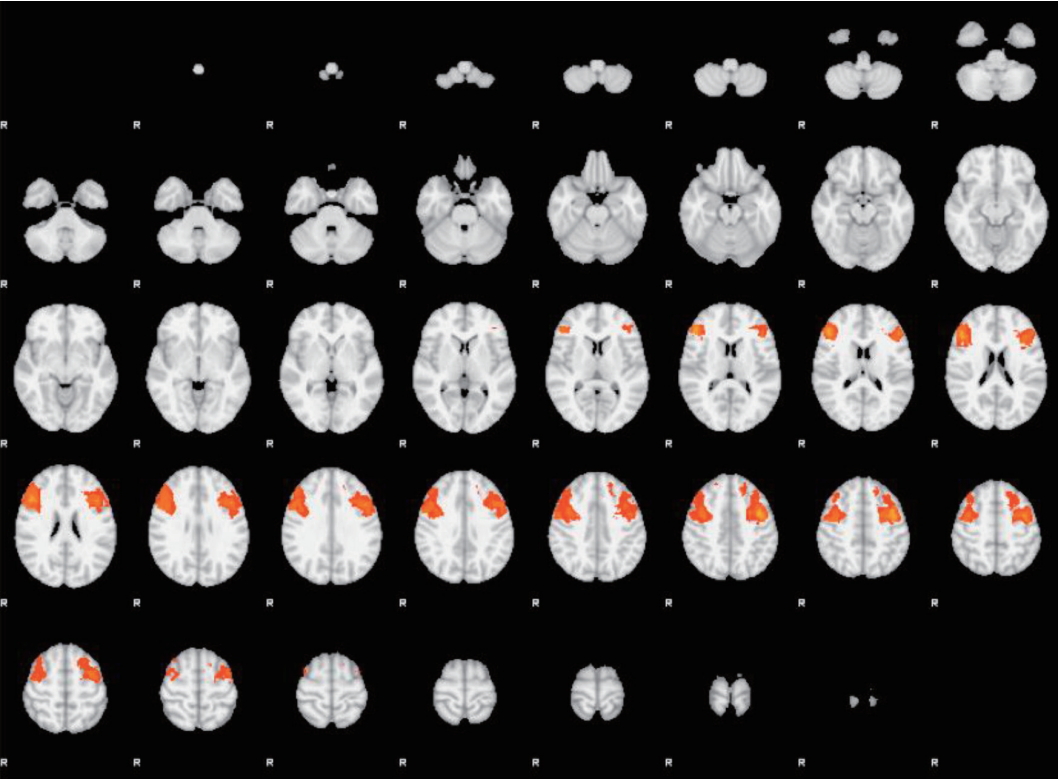
Pleasant stimuli. Dorsolateral Prefrontal Cortex (DLPFC), ROI-based analyses. AN and BN subgroups comparison (AN>BN). Transverse slice. ROI: regions of interest, AN: anorexia; BN: bulimia nervosa.

Unpleasant stimuli. Dorsolateral Prefrontal Cortex (DLPFC), ROI-based analyses. C and EDc subgroups comparison (C>EDc). Transverse slice. ROI: regions of interest, C: control, EDc: eating disorder comorbid.
Unpleasant paradigm, between group analysis
During unpleasant paradigm, no statistically significant differences in activation (in any of the brain areas selected) were found when comparing the ED group as a whole (including all ED subtypes) with controls.
On analysis the data by subgroups during the unpleasant paradigm, the following significant differences were found (Table 5): greater activation of FP when all patients as a group were compared to controls; greater activation in AN group when compared to EDc in Orbitofrontal cortex (OFC); greater activation of FP in AN, BN and EDc when compared to controls and BN when compared to AN.

Unpleasant paradigm
Activation maps of more representative results are shown below. Images from fMRI show brain activation (colored dots) overlaid on a transverse slice of the corresponding structural brain image (grayscale) (Figure 5).

Unpleasant stimuli. Orbitofrontal cortex (OFC), ROI-based analyses. AN and EDc subgroups comparison (AN>EDc). Transverse slice. AN: anorexia nervosa, EDc: eating disorder comorbid.
DISCUSSION
The purpose of the present study was to explore the general emotional processing response in ED, in order to develop hypotheses and directions for further research. We hypothesized that an increased emotional reactivity more characteristic of BN and EDc patients might be a consequence of their inability to adequately engage a reflective -executive system (prefrontal areas) and thus rely heavily upon more automatic response systems (amygdala and basal ganglia). We also hypothesized decreased emotional reactivity and over-control of emotions in AN would be a consequence of hyperactivation of prefrontal brain regions (dorsolateral and orbitofrontal), involved in reflective cortical processing and executive control.
To our knowledge, no previous functional neuroimaging studies have used general emotional stimuli (e.g., IAPS) as a paradigm for emotional processing in ED [56]. Pictures in IAPS identified as pleasant as well as unpleasant were experienced by participants as stimulating compared to neutral pictures, validating the emotional salience of our paradigm.
Within group analysis examined functional responses to emotionally stimulating stimuli (pleasant or unpleasant versus neutral) for each group of participants. Controls showed increased BOLD responses to both pleasant and unpleasant stimuli compared to neutral ones, in all selected brain regions that have been repeatedly shown to be relevant for emotional processing and regulation: PFC, amygdala and striatum [57-61]. In contrast, ED subgroups failed to show this default response in some of the selected brain areas (Table 2 and 3). The majority of patient groups showed activation at a cortical level (PFC), lacking subcortical activation (amygdala and striatum), especially during the unpleasant condition. Preliminarily, these results might indicate a difficulty in adequately engaging brain circuits involved in emotional processing in those with EDs.
There may be a number of explanations for a lack of functional activation of subcortical areas in ED groups in general emotional processing:
1) A deficit in the first stage of emotional recognition. However, this explanation contrasts with previous studies that found greater activation in subcortical structures such as amygdala in ED patients [36,56], which had used specific aversive stimuli (food or body silhouettes).
2) An excessive activation of PFC via “top-down” [60,62] regulation (cognitive control), that could lead to a relative deactivation of the amygdala and striatum, as it has been shown in previous studies where labelling a stimulus image (e.g., naming the expected affect), resulted in a reduction in amygdala activity [63,64].
3) Finally, a disconnection or desynchronization might exist between cortical structures (PFC) and subcortical regions, as has been seen in BPD patients [65].
The second phase of analysis included between group comparisons for each specific paradigm (pleasant-neutral and unpleasant- neutral). No differences were found when comparing all combined ED as a group versus controls whether during pleasant or unpleasant paradigm. Since ED include both subgroups of AN and BN and EDc (polar opposite groups of what we have hypothesized as the impulsive-compulsive continuum), we infer that it is possible the summation of hypo and hyper-activity from respective ED groups which yields an overall null difference.
Analysis by subgroups during the pleasant paradigm showed greater activation in AN in the DLPFC, frontal pole and left putamen compared to EDc, and a tendency towards greater activation of DLPFC in AN versus controls was also observed. However, these are acknowledged as exploratory findings due to the small subgroup sample size.
The DLPFC is part of the cognitive control network and has been associated with restriction of appetitive responses [66-68]. Differences found in the DLPFC between AN and EDc and BN and controls, may be tentatively interpreted in terms of a greater tendency to restrict emotions in AN -through “top-down” mechanisms of PFC inhibiting subcortical structures [12,69-71]. In partial support of our findings, in BN patients, a deficiency of activation of prefrontal brain regions during appetitive stimuli has been demonstrated [6,28,72,73]. However, a PET study indicated that regional cerebral blood flow (rCBF) normalized with long-term recovery in AN and BN [74].
Similar results were found in the Frontal Pole (FP) regions (greater activation during the pleasant paradigm in AN compared to BN and EDc but not compared to controls).
Taking into account that BN and EDc groups showed less activation in the DLPFC when compared to controls, we can therefore suggest there may be a gradient of activation in PFC regions (AN>C>BN>EDc).
Moreover, the EDc group showed less activation in left putamen compared to controls and AN, however caudate or amygdala differences did not reach significance compared to other studies [75]. The striatum (caudate and putamen) is involved in the activation of motor programs (some innate) but also in social-emotional expression, recognition [57,58,76-78], and withdrawal behaviours [79]. Those suffering comorbid BD and BPD have been characterized as showing a lack of emotional control intrinsic to both disorders, in turn related to dysfunction of cortico-striatal circuits [80,81]. Accordingly, the lower activation of putamen (as a component of corticostriatal circuitry) in these patients might result in an increased anticipatory response when facing emotional stimuli compared to other ED subgroups as well as controls and therefore, a more dysregulated pattern of eating behaviours.
During the unpleasant paradigm the group differences were detected in OFC functional activity. OFC is involved in representing the affective value of reinforcers, decision-making processes, expectation and processing of the negative valence of emotional stimuli. Patients with AN may display excessive control in the compulsive end of the impulsive-compulsive spectrum, while those with BPD have shown frontal dysfunctions, predisposing to lack of control, specifically a disconnection between PFC and limbic areas and reduced frontal inhibitory activity [65]. Therefore, the greater activation of OFC in AN compared to EDc, suggests that patients with AN have greater activity in the OFC as exertion of greater cognitive control when facing emotional stimuli. Similar activation results were found in previous studies in AN patients [31], however only during presentation of specific disease aversive stimuli (food and silhouettes) and not during general emotional stimuli [82] as found in this study. In another study using IAPS (emotional perception test in ED), an AN restrictive group showed increased fear when confronted with stimuli containing anger, that was attributed to introversion and conflict avoidance of patients with anorexia [56].
Overall, our results suggest that there are differential functional patterns emotional processing (e.g., DLPFC) across the groups in our study. Increased DLPFC activity for emotional processing in AN patients might be the basis of excessive top-down regulation: driving excessive emotional control, ruminations about weight, shape and an excessive ability to restrain appetite. Conversely, decreased activation in DLPFC regions to emotional stimuli in BN and EDc might be the basis of decreased control in eating behaviour and their emotions (Figure 1).
There appears to be differential processing of general emotional stimuli in subgroups of EDs on the basis of hyper or hypo-activity in regions mediating cortical emotional control (such as PFC). These preliminary pilot findings raise the possibility that, when processing emotional cues, persons with AN rely more upon reflective cortical processing and executive control compared to lesser involvement of such processing in those with EDc, BN and controls. These differences in emotional processing activity might thus influence eating behaviours. Since these results are regarded as exploratory this should be confirmed in future longitudinal studies.
Our functional emotional processing findings are potentially consistent with the compulsivity to impulsivity continuum model of ED, corresponding to compulsivity of control in AN and impulsivity of decreased control in BN and EDc.83 This model of ED also allows a conceptualisation for a bipolar spectrum of emotional processing of ED symptoms over the course of illness (Figure 1) and may potentially have important implications in their classification, treatment and prognosis.
Methodological limitations of this study, which limit generalizability, include: 1) small sample size which limits the power of the study to derive definitive findings, hence our the findings should be regarded as preliminary and exploratory pilot data to help inform future studies; 2) lack of longitudinal follow up in this cross-sectional study; 3) conceptual and methodological limitations when trying to study the different components of emotional processing and emotional responsiveness variability [77]; 4) methodological limitations due to fMRI characteristics (e.g., 1.5 tesla MRI against more frequently used 3 tesla MRI); 5) lack of data on severity of psychopathology and pharmacological treatment.
Against these limitations, the strengths of our study must be balanced: the exploratory conceptual advancement of studying general emotional responsiveness developing a hypothetical impulsivity-compulsivity continuum model of ED; distinction of an independent subgroup of EDc allowing a better control of the presence of borderline personality traits in the sample; a priori hypothesis-based stepwise fMRI analysis; and matching of healthy controls on relevant sociodemographic parameters.
In conclusion, differences in functional brain activity in prefrontal areas may help in the phenotypic differentiation of ED subtypes. Our findings provide preliminary exploratory support of a hypothesized pathophysiologic cognitive-control model of ED.
AN patients showed greater activation of areas involved in emotional control (DLPFC) compared to the rest of the groups. These results might be related to a tendency of those with AN to over-control emotions. The control group showed greater activation of DLPFC compared to BN, potentially consistent with the hypothesis of diametrically opposed mechanisms of emotional control among AN and BN groups (AN-over-control and BN-deficient control).
In comparison to other diagnostic subgroups, the ED comorbid group (EDc=ED+BPD) showed less activation in DLPFC and this might be related to lesser activation of reflective cortical processing areas mediated by the presence of borderline traits.
Overall, differences in activation of PFC areas in ED may potentially represent key functional bases in the general emotional responsiveness of these disorders with implications for their pathophysiologic phenomenology. However, we acknowledge this is a small exploratory pilot study, which will need replication in a larger sample size with investigation of additional regions of interest to see if the findings hold true.
Acknowledgements
JCLL self-funded travel costs as co-director for RMM-R’s PhD (Complutense University) thesis on which this research is based. Ms. Via is supported by an Endeavour Research Fellowship, provided by Australian government, the Department of Education (I.D. 3993_2014). The authors would like to thank all patients and volunteers for their participation in the study and staff at the Psychiatry and Radiology Department of Hospital ClÍnico San Carlos for their dedicated support.
Notes
The authors have no potential conflicts of interest to disclose.
Author Contributions
Conceptualization: Rosa M. Molina Ruiz, Marina Díaz-Marsá, Laura de Anta Tejado, Jose Luis Carrasco Perera. Data curation: Rosa M. Molina Ruiz, Marina Díaz-Marsá, Laura de Anta Tejado, Helena Trebbau López. Formal analysis: T. García-Saíz, M. Rincón Zamorano. Investigation: Rosa M. Molina Ruiz, Marina Díaz-Marsá, Laura de Anta Tejado, Jose Luis Carrasco Perera. Methodology: Rosa M. Molina Ruiz, Marina Díaz-Marsá, Laura de Anta Tejado, Jose Luis Carrasco Perera. Project administration: Rosa M. Molina Ruiz, Marina Díaz-Marsá, Laura de Anta Tejado, Jose Luis Carrasco Perera. Resources: Rosa M. Molina Ruiz, Marina Díaz-Marsá, Laura de Anta Tejado, Jose Luis Carrasco Perera. Software: T. García-Saíz, M. Rincón Zamorano. Supervision: E. Via Virgili, Marina Díaz-Marsá, Jose Luis Carrasco Perera, Jeffrey C.L. Looi. Validation: E. Via Virgili, Marina Díaz-Marsá, Jose Luis Carrasco Perera, Jeffrey C.L. Looi. Visualization: E. Via Virgili, Marina Díaz-Marsá, Jose Luis Carrasco Perera, Jeffrey C.L. Looi. Writing—original draft: Rosa M. Molina Ruiz. Writing—review & editing: Rosa M. Molina Ruiz, Helena Trebbua López, E. Via Virgili, Marina Díaz-Marsá, Jose Luis Carrasco Perera, Jeffrey C.L. Looi.