Shape and Volumetric Differences in the Corpus Callosum between Patients with Major Depressive Disorder and Healthy Controls
Article information

Abstract
Objective
This study aimed to investigate the morphometric differences in the corpus callosum between patients with major depressive disorder (MDD) and healthy controls and analyze their relationship to gray matter changes.
Methods
Twenty female MDD patients and 21 healthy controls (HCs) were included in the study. To identify the difference in the regional gray matter concentration (GMC), VBM was performed with T1 magnetic resonance imaging. The shape analysis of the corpus callosum was processed. Diffusion tensor imaging (DTI) fiber-tracking was performed to identify the regional tract pathways in the damaged corpus callosal areas.
Results
In the shape analysis, regional shape contractions in the rostrum and splenium were found in the MDD patients. VBM analysis showed a significantly lower white matter concentration in the genu and splenium, and a significantly lower GMC in the frontal, limbic, insular, and temporal regions of the MDD patients compared to the HCs. In DTI fiber-tracking, the fibers crossing the damaged areas of the genu, rostrum, and splenium were anatomically connected to the areas of lower GMC in MDD patients.
Conclusion
These findings support that major depressive disorder may be due to disturbances in multiple neuronal circuits, especially those associated with the corpus callosum.
INTRODUCTION
Major depressive disorder (MDD) is a psychiatric disorder characterized by the dysregulation of mood, cognition, and behavior [1,2]. Despite the high clinical prevalence and social impact of the disease, its pathogenesis has not yet been elucidated due to the diversity of clinical features and etiologic heterogeneity [3,4]. To identify the neurobiological mechanism of MDD, several magnetic resonance imaging (MRI) studies have tried to assess the structural brain alterations of patients with MDD [5-9]. In particular, voxel-based morphometry (VBM) has been applied to investigate subtle alterations in brain regions. VBM is a fully automated technique that is useful in analyzing morphological brain MRI data; it minimizes operational bias and accurately analyzes changes in the concentration or regional volume of brain tissues [10]. Previous VBM studies in MDD patients reported abnormalities in various regions, including the anterior cingulate cortex (ACC) [11-13], right middle and inferior frontal gyri, the orbital frontal cortex (OFC) [12], parahippocampal gyrus, and hippocampus [12], as well as widespread gray matter alterations [14-16]. Other VBM studies revealed subcortical structure changes and suggested that the connection between the cortical and subcortical areas was associated with the dysregulation of emotion processing in MDD patients [17-20]. However, limited studies have investigated the volumetric or shape alterations of the connection between the cortical and subcortical regions, including the corpus callosum.
The corpus callosum is a major neural pathway connecting two cerebral hemispheres and is involved in the integration of motor-sensory and cognitive functions [21]. This integrative function of the corpus callosum suggests that regional changes in this structure have a significant impact on the integrity of brain function. Recently, several studies have reported that the corpus callosum is one of the important structures related to the pathophysiology of MDD [22-25]. Despite the alterations in gray matter and corpus callosum reported in MDD patients, the anatomical relationship between these two changes has not been clearly reported. However, in studies analyzing multiple sclerosis patients, anatomical correspondence between white matter and gray matter damage was reported using VBM and tract-based spatial statistics. In addition, a significant correlation between corpus callosum atrophy and gray matter atrophy was also reported [26,27]. According to one in vitro study, an anatomical connection between the subregion of the corpus callosum and the regional cortical area was revealed [28]. Other studies reported that regional abnormalities of the cerebral cortex may trigger the atrophy of the corresponding subregions of the corpus callosum [29-31]. These findings suggest an anatomical link between the area of gray matter change and the location of changes in the corpus callosum in MDD patients.
Surface-based vertex analysis (SVA) allows a quantitative evaluation of brain structures by assessing the relative distances among corresponding surfaces and helps examine the shape changes within the subcortical and cortical areas [32]. Therefore, SVA analysis can be used to determine which subregions of the brain contribute most to the changes in brain volume and symptoms in psychiatric disorders, such as MDD [33]. Also, we can effectively analyze the shape changes of specific brain structures, including the corpus callosum using this technique [34].
In the present study, we hypothesized that there might be significant volumetric and morphometric differences in the corpus callosum between patients with depression and healthy controls (HCs). To test this hypothesis, we investigated the volumetric and morphometric differences between MDD patients and age-matched HCs using optimized VBM and SVA methods. Additionally, we investigated whether changes in corpus callosum and gray matter in MDD had an anatomical relationship to each other [35].
METHODS
Participants
Twenty female patients with MDD were recruited from the department of psychiatry. A board-certified psychiatrist diagnosed MDD based on the Structured Clinical Interview for DSM-IV-TR Axis I Disorders (SCID-I) in the Diagnostic and Statistical Manual of Mental Disorders, 4th Edition, Text Revision (DSM-IV-TR) [36]. The exclusion criteria were: 1) a history of Axis I or Axis II disorders within the last 6 months; 2) psychotic features; 3) major neurological illness, such as cerebrovascular disorder or epilepsy; 4) major medical illness, and 5) contraindications to MRI. The duration of the major depressive episodes was evaluated using a life-chart methodology in the interview. Twenty-one age-matched female healthy controls (HCs) were recruited from the community. The HCs received full psychiatric assessment by two psychiatrists for the detection of a history of Axis I or Axis II disorders. The exclusion criteria for the HC group were the same as the patient group. The Korean version of the 17-item Hamilton Depression Rating Scale (HAM-D 17) was performed to evaluate the severity of the depression of the participants on the day of MRI imaging [37,38]. Self-reported symptoms were also assessed by the Beck Depression Inventory (BDI) [39,40]. All patients were taking antidepressant medications without antipsychotics or mood stabilizers. The study protocol was approved by the Institutional Review Board of the hospital, and all methods in this study were carried out following the approved guidelines and the Declaration of Helsinki. All participants provided written informed consent to participate in the study after receiving a full explanation and understanding of the study.
MRI acquisition
All the participants were scanned with a 1.5-T Philips Gyroscan MRI scanner (Philips Medical Systems, Best, The Netherlands). Pilot images of the fast field echo T1 MRIs were acquired for consistent head positioning of the subjects with slice thickness (ST)=10 millimeters (mm); gap=10 mm; repetition time (TR)=15 milliseconds (ms); echo time (TE)=5.2 ms; matrix=256×256; and field of view (FOV)=250×250 mm, with three slices in each orientation and a flip angle (FA) of 20°. Guided by the pilot images, coronal 3D T1-weighted turbo field echo (TFE) MRIs were acquired with the following parameters: ST=1.3 mm, no gap, number of slices=160 slices, TR=10 ms, TE=4.3 ms, number of signal averages=1, matrix= 256×256, FOV=220×220 mm, and FA=8°. Based on the long axis of the anterior commissure to the posterior commissure from the midsagittal pilot, coronal slices perpendicular to the long axis were obtained.
For fiber tractography, one healthy control was enrolled for diffusion tensor imaging (DTI). MRI was performed using a Siemens MAGNETOM Prisma 3T MRI scanner (Siemens Healthineers, Erlangen, Germany) with a 64-channel head coil with the following parameters for the anatomical images: 3D-MPRAGE sequence with sagittal slices, TR/TE=2,300/2.26 ms, inversion time (T1)=900 ms, FA=8°, FOV=256×256×192 mm, slice thickness=0.5 mm, and voxel size=isotropic 0.5 mm3. For the DTI, the parameters were: multiband diffusion-weighted echo-planar imaging with axial slices, TR/TE= 2,137/48 ms, FA=90°, FOV=224×224×162 mm, slice thickness=2.0 mm, voxel size=1.0×1.0×2.0 mm3, and 128 gradient directions (b-value=1,000 s/mm2) with the first two and last 31 b0 images.
Voxel-based morphometry
Using SPM12 (Wellcome Department of Cognitive Neurology, Institute of Neurology, University College London) implemented in MATLAB (MathWorks, Natick, MA, USA), we performed optimized voxel-based morphometry to investigate the abnormalities in gray/white matter concentrations or regional volume changes [10]. All MR images of the normal controls and MDD patients were spatially normalized to a standard T1 template to create customized templates and prior images of gray matter, white matter, and cerebrospinal fluid (CSF). Segmentation from the normalized images into gray matter, white matter, and CSF was performed, and the segmented images were sub-sampled into a 2 mm3 voxel cube. The Hidden Markov random field (HMRF) model was used in all segmentation processes to eliminate separated voxels of one tissue class, not likely to be the part of this tissue type [41]. The spatially normalized images (raw images, segmented gray matter, white matter, and CSF images) were averaged and saved as customized images of the T1 template, gray matter, white matter, or CSF prior images. Lastly, the customized images were smoothed using an isotropic Gaussian kernel with 8 mm fullwidth at half-maximum (FWHM).
The raw T1 images of all participants were segmented into three partitions (gray matter, white matter, and CSF) automatically in the native space, and the gray and white matter volumes from the images were estimated. The parameters of spatial normalization were estimated by matching individual gray matter with its gray matter template. Spatially normalized images of the original images were generated after the estimation. We segmented the spatially normalized images by the HMRF operation and their prior images (gray, white matter, and CSF partitions). The unmodulated images were smoothed using a 12 mm full width at half maximum (FWHM) isotropic Gaussian kernel (IGK). Unmodulated VBM is indicative of gray matter or white matter concentration differences. We utilized the Montreal Neurological Institute (MNI) coordinate system to define the coordinates and named the cluster regions according to the atlas of Henri M. Duvernoy [42]. We used the normalized T1 MRI of a normal control as the template in the figures. We also showed all of the images in the neurological views (the right of the image is the right hemisphere of the brain).
Shape analysis of the corpus callosum
The T1 MRIs were up-sampled to 0.86 mm isotropic voxels and located to the X, Y, and Z axes at the level of the interhemispheric fissure to acquire exact midsagittal MR images. The reconstructed sagittal images were rotated parallel to the anterior-posterior commissure line. The reconstructed midsagittal MR images were snapped and stored as two-dimensional images. The outline of the corpus callosum was traced manually using ITKSNAP (www.itksnap.org) [43]. For consistent measurements, a tracing line was drawn on the voxels of the mean intensity between the CSF and the corpus callosum.
Shape analysis was processed using the spherical harmonic basis function-point distribution model (SPHARM–PDM), based on a uniform icosahedron-subdivision of the spherical parameterization [33]. This boundary shape analysis method is useful for the expression of shape deformation [44,45]. To reduce the file size, cropped images of the corpus callosum from the segmented binary images were saved as new files. These cropped images were re-sampled from the voxel size of 0.86×0.86×1.30 mm to 0.5 mm isotropic voxels. For SPHARM computation, the subdivision level was set to 10, and the cutoff degree was set to 12. The correspondence across all surfaces was computed by the alignment of the first order ellipsoids of all the parameterizations. The SPHARM-PDMs of all corpus callosum were computed.
Before the shape analysis, an averaged corpus callosum template was created using the corpus callosum images of all subjects, and the average template was computed by averaging the 3D coordinates of the corresponding surface points throughout the groups [45]. All triangulated meshes of the corpus callosum were aligned spatially to the template with a rigid transform [33,44,45].
DTI fiber-tracking
We converted the DTI data from DICOM into a NIFTI format by the dcm2nii function in MRIcron (https://www.nitrc.org/projects/mricron), and b-values and b-vector files of all the participants were generated. The eddy currents and head motion artifacts were corrected using the FMRIB Software Library (FSL) [46]. A DTI data set (b-value, b-vector, and raw image files) was reconstructed using a deterministic diffusion fiber-tracking algorithm [47] in DSI Studio software (https://dsi-studio.labsolver.org). The parameters for fiber tractography were minimum FA=0.15, maximum angle=60°, and minimum/maximum length=50/300 mm. The maximum number of fiber-tracking was set to 100,000 streamlines.
To identify the regional tract pathways of the corpus callosum, the damaged areas of the genu, splenium, and rostrum, which corresponded to the VBM and shape analyses results, were manually traced in the mid-sagittal images of the FA map.
Statistical analyses
We performed statistical analyses with IBM SPSS Statistics version 24.0 for Windows (IBM Corp., Armonk, NY, USA). Comparisons of age, BDI, and Hamilton Rating Scale for Depression (HDRS) between the controls and patients groups were performed by an independent t-test (two-tailed). In our study, p<0.05 was considered statistically significant. For VBM analyses, we performed an analysis of covariance (ANCOVA) with the confounder of age to analyze the concentration of the unmodulated gray and white matter images. A false discovery rate (FDR) correction at the p<0.05 level was used to correct for multiple comparisons [48]. The clusters were excepted when their cluster size was fewer than 200 voxels (kE<200 voxels).
For the statistical analysis of the shape results, the PDM consisted of coordinates of the corresponding 1,002 points (scaled distances from the template with sign). With the scaled distances of 1,002 corresponding points, the differences between the surfaces in the two groups were tested using Hotelling’s T-squared test with an age and intracranial volume (ICV) correction. As a result, significance maps of FDR with corrected p<0.05 values for all of the corresponding 1,002 points were created.
RESULTS
Characteristics of the participants
Table 1 shows the clinical and demographical characteristics of the participants in the present study. The patients had a mean (±SD) age of 42.5 (±13.95) years and the HCs had a mean age of 42.3 (±10.24) years. In the MDD patients, the mean age of the first depressive episode was 31.8 (±13.10) years, the mean number of lifetime depressive episodes was 7.1 (±9.12), and the mean duration of illness was 9.5 (±11.33) years. The MDD patients showed significantly higher BDI scores (MDD vs. HCs; 29.6±13.88 vs. 4.8±3.56, p<0.0001) and HAM-D 17 scores (MDD vs. HCs; 21.7±8.67 vs. 1.0±1.23, p<0.0001) compared to the HCs.

Clinical variables of the study participants
Voxel-based morphometry & shape analysis
There were no statistically significant differences in the ICV between the patients with MDD and the HCs (MDD vs. HCs; 1393.6±170.84 cm3 vs. 1395.9±120.48 cm3, p=0.96). The WMC in the MDD patients was lower in the genu and splenium of the corpus callosum than in the HCs in the VBM analysis (FDR p<0.05) (Figure 1A). The GMC in the MDD patients was lower in the frontal lobe (mid-frontal gyri and gyri rectus), limbic lobe (amygdalae, hippocampi, parahippocampal gyri, cingulate gyri, hypothalamic nuclei, and thalami), short and long insular gyri, and the superior/middle temporal gyri (Table 2, Figure 1C) than in the HCs in the VBM analysis. We did not find any significantly higher WMC or GMC in patients with MDD.
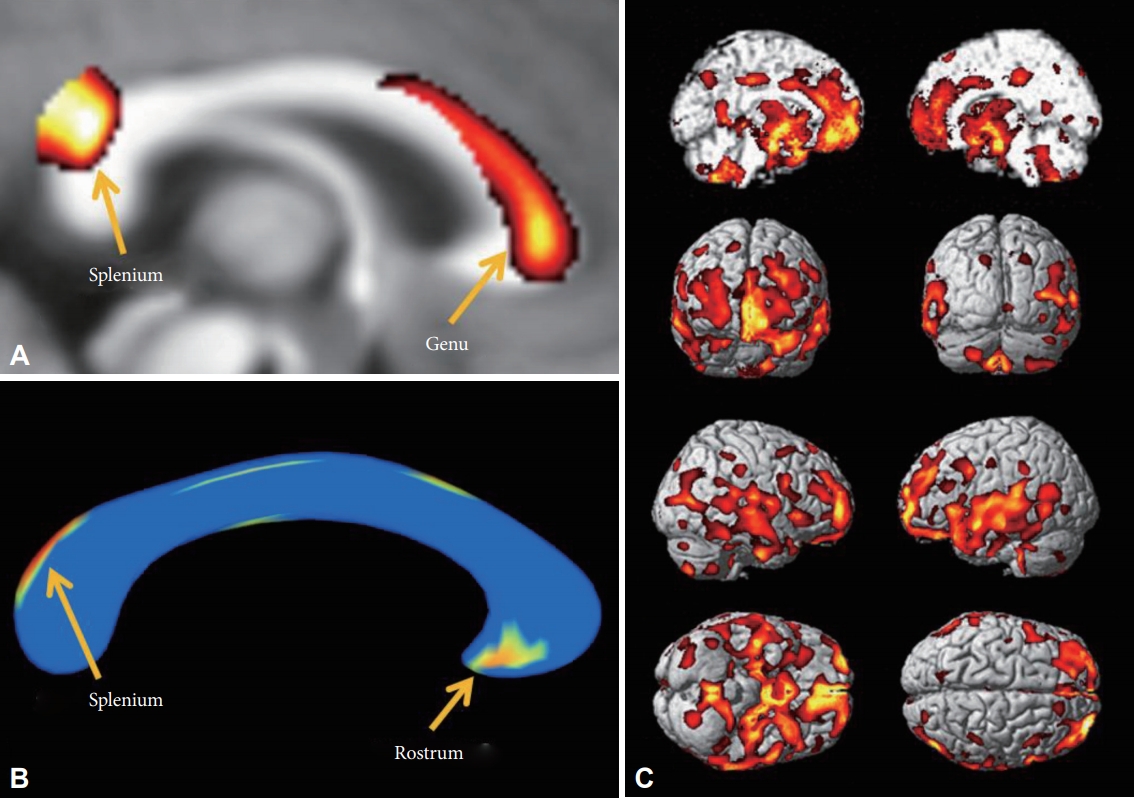
Decreased white matter concentration (WMC) and shape contractions of the corpus callosum in MDD patients. A: In VBM analysis, the WMC in the corpus callosum of MDD patients was decreased in the genu and splenium. B: In the shape analysis, regional shape contractions were found in the rostrum and splenium of the corpus callosum of MDD patients. C: In the VBM analysis, decreased GMC was found in the medial prefrontal, prefrontal, orbitofrontal, cingulate gyri, insular cortices, temporal cortices, and mesial temporal lobes of patients with MDD. The statistical levels were set to a false discovery rate (FDR) correction at the p<0.05 level.

Decreased gray matter concentration in patients with major depressive disorder
In the shape analysis, regional shape contractions were found in the rostrum and upper area of the splenium of the corpus callosum in the MDD patients (FDR p<0.05) (Figure 1B). This finding was partially concordant with the areas of lower WMC in MDD patients in the VBM analysis.
DTI fiber-tracking
We experimentally analyzed one HC to track the fibers of the corpus callosum in this study. The fibers passing through the lower WMC area of the genu (Figure 1A) reached bilaterally to the medial and lateral prefrontal cortices (Figure 2A, red), fibers passing through the contracted area of the rostrum (Figure 1B) reached the limbic orbitofrontal cortices and temporal pole corresponding to the limbic cortex (Figure 2B, orange), and the fibers crossing the contracted area of the splenium were connected to the superior/middle temporal gyri and insular gyri (Figure 2C, green). The fibers crossing damaged corpus callosal areas (Figure 1A and B) were anatomically connected to the areas of lower GMC in MDD patients (Figure 1C).
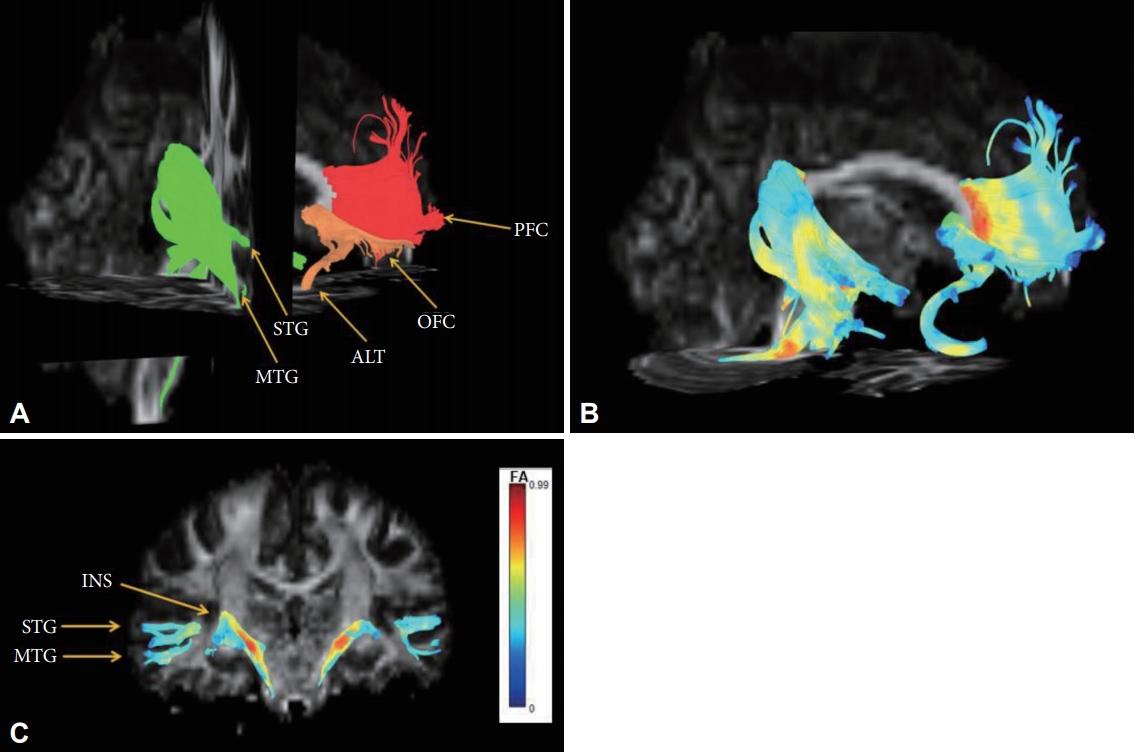
Reconstructed fibers passing through shape-contracted subregions of the corpus callosum. (A) The fibers passing through the decreased WMC area of the genu reached bilaterally to the prefrontal cortices (red), the fibers passing through the contracted area of the rostrum reached the limbic orbitofrontal cortices and temporal pole corresponding to the limbic cortex (orange), and the fibers crossing the contracted area of the splenium connected to the superior/middle temporal gyri and insular gyri (green). (B) The color of the reconstructed fibers represents the fractional anisotropy (FA) values. (C) The color bar represents fractional anisotropy (FA) values.
DISCUSSION
This study presents significant shape contraction in the rostrum and splenium regions of the corpus callosum, as well as significantly lower WMC in the genu and splenium of the corpus callosum of patients with MDD compared to HCs. The present study also showed significantly lower GMC in various brain regions, including the mid-frontal, temporal, cingulate, insular, amygdala, hippocampal, hypothalamic, and thalamic regions in patients with MDD compared to HCs. Additionally, DTI fiber-tracking analysis revealed that the fibers crossing the damaged corpus callosal areas of MDD patients were anatomically associated with the areas of lower GMC in the VBM analysis. Our results revealed altered connectivity between the rostrum, genu, and splenium of the corpus callosum and the associated brain regions, including the frontal lobe, limbic, and other related areas in the MDD patients.
The major finding of this study was the contraction of the regional shape in the rostrum and splenium regions of the corpus callosum in MDD patients compared to HCs. These findings are consistent with previous MRI findings that found smaller corpus callosum volumes in patients with MDD or dysthymia compared to HCs [49-52]. These studies showed that medication-naïve early-onset dysthymic women [49] or adolescents and adults with early-onset (≤18 years) MDD [51] had decreased corpus callosum genu volumes compared to age and sex-matched HCs. When investigating elderly patients (mean age >60 years old), Ballmaier et al. [52] found that callosal thinning was restricted to the genu in the early-onset (≤60 years) patients, whereas the patients with late-onset depression showed significant callosal thinning in both the genu and the splenium compared to the HCs. More recently, Dalby et al. [53] found that subjects with late-onset (after the age of 50 years) MDD displayed significantly higher white matter lesion density in the left superior longitudinal fasciculus and the right frontal projections of the corpus callosum. Consistent with these findings, we found extensive affected lesions in the corpus callosum including the rostrum and splenium, although not in the genu, in middle-aged female MDD patients with recurrent episodes (7.1±9.12) and relatively long duration of illness (9.5 ±11.33 years).
Our study showed significantly lower WMC in the genu and splenium of the corpus callosum in MDD patients via VBM analysis. Consistent with our results, several DTI studies reported lower values of white matter integrity, such as functional anisotropy (FA) values of the corpus callosum, in patients with MDD [24,35,54-60]. Similar to our results, previous studies showed that middle-aged MDD patients taking medication had significantly decreased FA values in the posterior body [57], genu [58], and splenium [54] of the corpus callosum compared to HCs. Regarding medication-naïve subjects, similar results of reduced FA values of the genu [56], and the genu and the body [24] of the corpus callosum in middle-aged patients, and decreased FA values of the genu of the corpus callosum in subjects with MDD in their late twenties have been reported [55]. Recently, studies have been conducted on the role of the splenium in depression, and reductions in the axonal myelin of the splenium in MDD patients was reported [61]. Also, there have been reports of emotional dysregulation in splenium agenesis [62]. Regarding the chronicity and recurrent episodes of our participants, chronic and recurrent deteriorations in the whitematter integrity of the corpus callosum might be reflected in WMC reductions in both the genu and splenium of the corpus callosum.
Consistent with numerous previous brain imaging findings, the present study also found significantly lower GMC in various brain regions, including the mid-frontal [5,63], temporal [63], cingulate [11-13,63], insular [63], amygdala [64-68], hippocampal [19,69,70], hypothalamic, and thalamic [71] regions in patients with MDD compared to HCs. Our study showed abnormalities of various components (amygdala, cingulate gyrus, and insular cortex) that constitute the limbic system as well as the prefrontal cortex (PFC) of chronic MDD patients. Among them, the amygdala is known as one of the key structures involved in emotion and drive in the limbic system. The cingulate gyrus is above the corpus callosum and constitutes the limbic system. A previous study reported that perigenual anterior cingulate morphology (pACC) was associated with low perceived social status [72] and sadness and pregenual ACC (pACC). The insular cortex is also known to be involved in the production of emotion [73]. Our study showed similar results to the anatomical location reported in previous studies, suggesting that several structures are involved in the pathophysiology of MDD.
We also demonstrated a possible connection between corpus callosal areas and the associated cortical areas via DTI analysis of one healthy subject. Using DTI analysis, our results showed that the fibers passing through the genu reached the prefrontal cortex and the fibers passing through the rostrum reached the limbic OFC and temporal pole. Also, this study showed that fibers passing through the splenium reached the temporal and insular gyrus. A possible explanation for this might be that the areas of lower GMC and the areas of lower WMC or regional contraction in the corpus callosum are anatomically correlated, although a causal relationship could not be determined due to the cross-sectional design. According to previous studies, atrophy of the corpus callosum is mainly caused by axonal degeneration due to damage to cortical neurons [74,75] and the severity of atrophy may be aggravated by cytoskeletal damage in the cerebral white matter [76]. This mechanism of corpus callosum atrophy supports the presence of an anatomical link between the broad-range gray matter changes and morphologic changes in the corpus callosum in our study. Furthermore, a number of studies have been conducted to examine the changes in neuronal circuits associated with the corpus callosum in patients with depression. A previous positron emission tomography (PET) study revealed an association between depression and decreased activity in the ventral prefrontal cortex and the corpus callosum [77]. Similarly, a meta-analysis of DTI studies performed on MDD patients found that the FA values of the right frontal white matter and the left frontal white matter were decreased in MDD patients and that the main fibers passing through this region were interhemispheric fibers crossing the genu and body of the corpus callosum [60]. Previous MRI studies found that various cortical regions, such as the prefrontal, orbitofrontal and cingulate areas, and their connections with subcortical areas were associated with emotion and cognitive dysregulation in MDD patients [11,17-20,78]. Cortico-striatal-pallidal-thalamic (CSPT) brain circuits have been considered to be associated with motor, cognitive, and emotion regulation processes, and related to MDD [79-82]. Although more studies are needed to explain the association between the subregions of the corpus callosum and its affected areas, this study indicated a possible association between corpus callosal connectivity and cortical areas. Our study suggests that the pathophysiology of MDD is related to alterations in corticolimbic connectivity by showing the significant differences in gray matter concentration across the limbic cortex, hippocampal formation, amygdala, and diencephalon that comprise the limbic system.
The advantage of our study is that we investigated the structural difference between the patients with relatively chronic MDD and HCs using a variety of analytical techniques. Although VBM can evaluate both gray and white matter, most VBM studies have mainly analyzed gray matter, and the white matter has been analyzed by other methods known to be more accurate (diffusion tensor imaging, and shape analysis) [83]. The corpus callosum was analyzed by shape analysis and VBM, and the cortical and subcortical differences of the whole brain were analyzed by VBM. Furthermore, a fiber-tracking technique was used to analyze the relationship between the results of the shape analysis and VBM analysis. We could evaluate the MDD pathophysiology not only from the viewpoint of regional brain abnormalities but also from the viewpoint of brain connectivity by comparing the results of each analysis method using a multimodal technique. In addition, we could confirm that the size difference in the subregion was dominant in the rostrum, unlike the genu, which showed a significant difference in white matter concentration, by both techniques. Finally, we tracked the fiber through each subregion of the corpus callosum and confirmed the association between this subregion and the cortical area with reduced GMC.
This study had several limitations and the results should be interpreted cautiously. First, due to the small number of enrolled patients, we could not evaluate differences in the morphometric and volumetric parameters between the subtypes of MDD (e.g., melancholic vs. atypical or familial vs. non-familial [22]). To overcome the small sample size, we recruited agematched female subjects. Second, due to the cross-sectional study design, we could not determine the causal relationship between volumetric or morphometric decreases and MDD. Third, all of the patients in our study took antidepressant medications, and this medication itself may have been a confounding factor affecting the results of the study. Fourth, due to the lack of detailed information about the patients’ medications, we could not evaluate the effect of medication dosage or the length of pharmacological treatment on the morphological differences in this study. For medication, we evaluated the types of pharmacological treatments that were prescribed for all subjects. However, the treatment duration and dosage were not investigated in this study. Fifth, as all patients were women, these data must be interpreted with caution when generalizing to men. There have been biologically based analyses of why women have a higher incidence and morbidity risk of depressive disorders than men [84,85]. Further studies are needed to determine whether the neuroanatomical results we observed in women are similar in males. Lastly, since we only evaluated the connectivity between the corpus callosum and the affected cortical areas in one normal control, our results cannot be generalized to the general population. For that reason, future research with more patients is needed to explain the association between the subregions of the corpus callosum and its affected areas.
The present findings revealed regional shape contraction of the corpus callosum and that lower GMC of the PFC and limbic system in patients with MDD compared to HCs may be correlated with the pathophysiology of chronic depression. In particular, lower WMC of the genu and splenium and lower size of the rostrum and splenium in the patients with MDD provide an understanding of depression as a disorder of multiple neuronal circuits, including interhemispheric connectivity of the frontal and temporal lobes.
Acknowledgements
This work was supported by the National Research Foundation of Korea (NRF) funded by the Korean government (MSIP) (No. 2017R1D1A1B030 30280), the National Research Foundation of Korea (NRF) funded by the Korean government (MSIP) (No. 2017M3C7A1079696), ), a National Research Foundation of Korea (NRF) grant funded by the Korean government (MSIT) (No. 2020R111A1A01067132), and a National Research Foundation of Korea (NRF) grant funded by the Korean government (MSIT) (No. 2020R1C1C1003394). This research was also supported by a grant from the Korea University Anam Hospital, Seoul, Republic of Korea (Grant No. K1922891).
Notes
The authors have no potential conflicts of interest to disclose.
Author Contributions
Conceptualization: Woo-Suk Tae. Data curation: Sekwang Lee. Formal analysis: Woo-Suk Tae. Funding acquisition: Kwan Woo Choi and Woo-Suk Tae. Investigation: all authors. Methodology: all authors. Project administration: Woo-Suk Tae and Kwan Woo Choi. Resources: all authors. Software: Sekwang Lee and Woo-Suk Tae. Supervision: Woo-Suk Tae and Sung-Bom Pyun. Validation: Woo-Suk Tae. Visualization: Woo-Suk Tae. Writing—original draft: Sekwang Lee. Writing—review & editing: all authors.