Applying Artificial Intelligence for Diagnostic Classification of Korean Autism Spectrum Disorder
Article information

Abstract
Objective
The primary objective of this study was to predict subgroups of autism spectrum disorder (ASD) based on the Diagnostic Statistical Manual for Mental Disorders-IV Text Revision (DSM-IV-TR) by machine learning (ML). The secondary objective was to set up a ranking of Autism Diagnostic Interview-Revised (ADI-R) diagnostic algorithm items based on ML, and to confirm whether ML can sufficiently predict the diagnosis with these minimum items.
Methods
In the first experiment, a multiclass decision forest algorithm was applied, and the diagnostic algorithm score value of 1,269 Korean ADI-R test data was used for prediction. In the second experiment, we used 539 Korean ADI-R case data (over 48 months with verbal language) to apply mutual information to rank items used in the ADI diagnostic algorithm.
Results
In the first experiment, the results of predicting in the case of pervasive developmental disorder not otherwise specified as “ASD” were almost three times higher than predicting it as “No diagnosis.” In the second experiment, the top 10 ranking items of ADI-R were mainly related to the quality abnormality of communication.
Conclusion
In conclusion, we verified the applicability of ML in diagnosis and found that the application of artificial intelligence for rapid diagnosis or screening of ASD patients may be useful.
INTRODUCTION
The application of artificial intelligence (AI) enables fast and diverse access to a large amount of information. In addition, there are aspects that allow us to look at problems from various perspectives based on interpretation methods. To this end, machine learning (ML), as a subfield of AI, is commonly used [1]. Detection and diagnosis of diseases at an early stage is one of the key interests in ML for medical science and it may support a final diagnosis by a specialist that might be quickly made on the basis of appropriate grounds. For example, Watson for Oncology and Watson Genomics by IBM Watson Health has the goal of advancement in precision medicine by integrating cognitive computing and genome tumor sequencing and clinical data in a maximum of 20 min (https://www.ibm.com/watson/kr-ko/health/oncology-and-genomics/genomics/) [2]. Attempts using ML have been performed to achieve outcomes for diagnosis and treatment in multidisciplinary medical fields.
Autism spectrum disorder (ASD) is a neurodevelopmental disorder characterized by limited social communication and social relationships, repetitive behavior and restricted interest [3]. As it is a psychiatric condition with complex behavioral phenotypes, the diagnostic process often requires comprehensive history taking and direct observation because there is no definite biomarker, and the highest level of professional expertise is needed for proper diagnosis. Representative diagnostic instruments for ASD include the autism diagnostic observation schedule (ADOS) and autism diagnostic interview-revised (ADI-R) [4] questionnaire. ADI-R is a semi-structured interview developed by Lord et al. [5] in 1994 for mutually complementary use with the ADOS. This instrument is used in the diagnosis of ASD through the process of interviewing parents or caregivers of children. ADI-R is designed to comprehensively describe and evaluate the aspects of development and behavior of children from infancy to present time using the following questions: a total of 93 items in 3 domains, including communication, social interaction, and restrictions of behavior and interest, as included in the standards for diagnosis of autistic disorder. The extent of severity of ASD-related behavior for each item is coded on a scale of 0–3, which is then applied to the diagnostic algorithm to determine whether it corresponds to the cutoff for diagnosis of autism [5]. ADI-R is composed to assign scores to each item on the basis of contents of the interview and questionnaire, and to determine the diagnostic category in accordance with the diagnosis algorithm. Although this is an essential instrument for diagnosis, it requires more than 2 hours for completion by each individual. Accordingly, some of the diversely collected phenotype data remains unused [6]. Required specialist training and the prolonged time of the ADI-R diagnostic process act as bottlenecks in clinical settings.
To overcome administrator bias during assessments, many have attempted to use AI technology to create a more concise algorithm for ASD diagnosis [7]. Several studies have attempted to classify items from assessment of ASD diagnostic instruments that are most predictive of the diagnosis to make the process less time-consuming. Wall et al. [8] applied 16 ML algorithms with data in multiple ASD data repositories, including the Autism Genetic Resource Exchange (AGRE) and Autism Consortium (AC), and they suggested that ML enables the classification of autism and non-autism with 100% accuracy using tree algorithms such as ADTree. Furthermore, the same group also suggested a few important ADI-R diagnostic items by applying the ADTree algorithm with datasets including multiple ASD population data [8,9]. However, considering ethnic or sociocultural differences, it is not known whether these results could be replicable after applying to other populations, including Koreans.
In this study, we apply a machine learning algorithm using the Korean ADI-R diagnostic algorithm dataset. The purpose of this research was to examine the following questions: 1) whether the diagnostic algorithm domain scores of in ADI-R can predict the results of diagnosis of autism spectrum disorder. We used the data classified based on the diagnostic criteria of Diagnostic and Statistical Manual (DSM)-IV, to examine whether ML distinguishes even the pervasive developmental disorder not otherwise specified (PDD-NOS) category based on the ASD group and 2) whether machine learning can suggest the minimum and reliable items from the ADI-R diagnostic algorithm for Korean ASD diagnosis by the rankings related algorithm.
METHODS
Subjects and data
In this study, we use the coding data and scores for ADI-R diagnostic algorithm item of 1,269 anonymous patients with ASD and their unaffected siblings, collected at the Bundang Seoul National University Hospital for the first experiment. Each subject was given clinical best estimate diagnosis by two board certified child psychiatrists, based on ADI-R, Autism Diagnostic Observation Schedule (ADOS) and clinical interviews. For the first experiment set, the total scores of each domain in diagnostic algorithm in ADI-R (namely, “A: Qualitative abnormalities in reciprocal social interaction,” “B. Qualitative abnormalities in communication,” “C. Restricted, repetitive, and stereotyped patterns of behavior” and “D. Abnormality of Development Evident at or Before 36 Months”) which suggested the cut-off value for diagnosis were used. Cases for which the scores in any one of these domains did not exceed the ASD cutoff are categorized as PDD-NOS. If the subject did not meet any criteria, she/he was assigned to “No Diagnosis” group.
In the second experiment set, we selected 539 cases, older than 48 months with verbal language out of first dataset, to apply mutual information to rank 78 items in the total ADI-R diagnostic algorithm dataset. It is used not only the score for “current” but also the score for “ever” or “most abnormal between 4.0–5.0 years of age” of each item in the domains. The item “86. Age When Abnormality First Evident” and “87. Interviewer’s Judgement on Age When Abnormalities First Manifest” in D domain were not used in this study because those two are summary items having different scoring system with other items. In this second set, coding value 991–999 (not specified) were treated as missing values, and 7, 8 and 9 (not typical/not available/not known) were also used. Supplementary Table 1 (in the online-only Data Supplement) shows the basic characteristics of the first dataset used for learning. The use of data for this study was approved by the Institutional Bioethics Committee of Bundang Seoul National University Hospital (IRB No. B-1803-459-103).
Multiclass decision forest
Multiclass decision forest is an ensemble model that rapidly builds a multitude of decision trees. The biggest feature of decision forest is that the trees have different characteristics due to randomness. As the prediction model learns through multiple trees, it is possible to expect generalization of the prediction results. In addition, robust prediction results can be expected for data containing noise [10]. The representative parameter of Decision Tree is Number of tree, which is a parameter that defines the number of times the prediction model is trained. In the case of Decision Forest, it can be observed increased accuracy of the prediction model as the number of tree increasing, but it does not increase more than a certain value [11]. The accuracy does not increase more than a certain value, it is important to find the minimum number of tree parameter values with maximum accuracy. Ensemble learning can solve machine learning problems by generating and combining multiple prediction models [12]. Research on decision forests has started in early 1990s, but it only started gaining attention in mid1990s [13]. Decision forests are used in various fields, including medicine, engineering, and information retrieval [14]. Various types of decision forest methods exist, including bootstrap aggregating (bagging) and adaptive boosting (AdaBoost) as representative methods [15]. Bagging is a simple and effective method for generating an ensemble model in decision forests. Each decision tree in the forest is trained on a data subset taken as a replacement of the original training dataset. All trees are trained using the same learning algorithm. The final prediction for untrained data is determined by a majority vote on the predicted results of the individual trees. The advantage of bagging is that it can be easily implemented in a parallel model by training several ensemble classifiers [16]. Boosting is a way to improve the performance of weak learners. AdaBoost is the most popular boosting algorithm [17]. The main idea of AdaBoost is to assign higher weights to samples that were misclassified during the previous iteration of the training. Specifically, weights of correctly classified samples are decreased, and weights of misclassified samples are increased. As a result, the classifier focuses on “difficult” samples. This iterative learning procedure provides a series of decision trees that complement one another [18].
Mutual information
Feature Selection is a method for efficiently learning various machine learning and data mining. It is a method to select the feature that best represents the dataset among high-dimensional datasets. Information Gain is one of the feature selection methods, Information Theoretical based method [19]. Information gain is also called Mutual Information Maximization (MIM). A formula for calculating the information gain is following equation.
Information Gain measures how much information a feature gives us about the class. Value(A) means feature. The larger the information gain value, the more likely the feature is describing the label [20]. Entropy value is between 0 to 1. Also Pr(X=1) value is between 0 to 1. Entropy is impurity and purity in an arbitrary collection of examples.
The above equation is a formula for calculating the entropy. Pi is the ratio of the set S of binary data sets belonging to class i.2.4.
The experiments were conducted using Microsoft Azure Machine Learning Studio (https://studio.azureml.net). To apply machine learning, this study used a classification algorithm—specifically, a multiclass decision forest at the first data setting. Bagging, which is one of the techniques of multiclass decision forest, was applied as a resampling method [21]. In addition, to select important diagnostic items from the second data set, we used a Mutual Information. To evaluate, Multiclass decision forest was also applied to the selected 5 diagnostic items. In all experiment sets, and the ratio of learning and test data was 90:10 and Number of trees for training was set at 1, 2, 4, and 8 [22].
RESULTS
Supplementary Figure 1 (in the online-only Data Supplement) shows the results of the tree that illustrates the results of learning on the data of the ADI-R diagnostic algorithm first dataset. Figure 1 shows the accuracy of classification for the set of 127 patients used for verification of the prediction model. Although the rate of positive prediction of ASD reduced from 98.5% to 97.0% as the number of trees increased from 1 to 4, the rate of negative prediction increased from 94.9% to 97.4%. In the case of PDD-NOS, the lowest prediction rate of 71.4% was observed when the number of trees was 2, and the prediction rate was the same at 81.0% when the number of trees was 4 or 8. Supplementary Table 2 (in the online-only Data Supplement) shows the accuracy, precision, and recall of predictive models that have learned four trees in the 1st set. The average accuracy was 96.3%, macro-averaged precision was 92.7%, and macro-averaged recall was 91.8%.
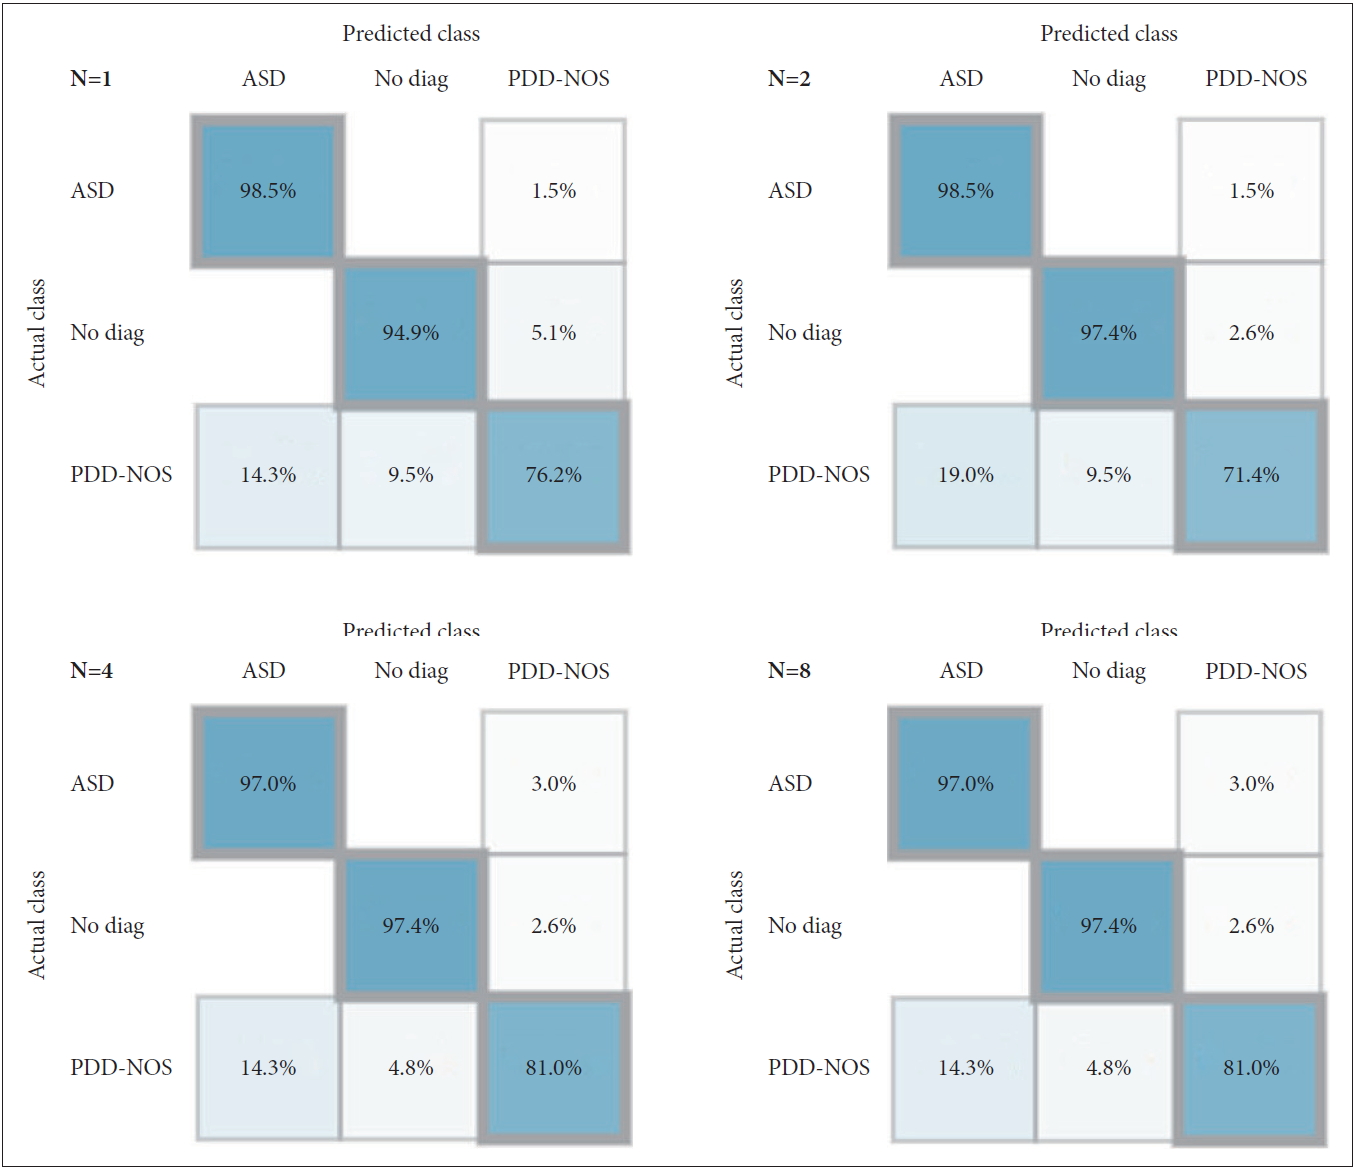
Confusion Matrix of the predictive model (number of tree 1, 2, 4, and 8) for 127 new patients (10% the test bed) in the first experimental set. ASD: autism spectrum disorder, PDD-NOS: pervasive developmental disorder not otherwise specified.
The top-ranking ADI-R interview items in the diagnostic algorithm are selected by AI in the second data setting (Table 1). In the top 10 items, 7 items were included in the communication domain and 3 items were included in the Reciprocal Social Interaction domain. As a result of applying properties from 1st to 5th using 10% test beds, the accuracy of “No diagnosis” was 100% (specificity) and “ASD” was 97.6% (sensitivity). Misclassification from ASD to no diagnosis was 2.4%. As a result of applying Top 5, the four confusion matrices were the same from the number of trees 1 to 8 (Figure 2). Supplementary Table 2 (in the online-only Data Supplement) also shows the accuracy, precision, recall and Youden index of predictive models that have learned four trees in the 2nd set. The average accuracy was 98.14%, macro-averaged precision was 96.42%, and macro-averaged recall was 98.78%.

Top 10 ranked items of ADI-R diagnostic algorithm
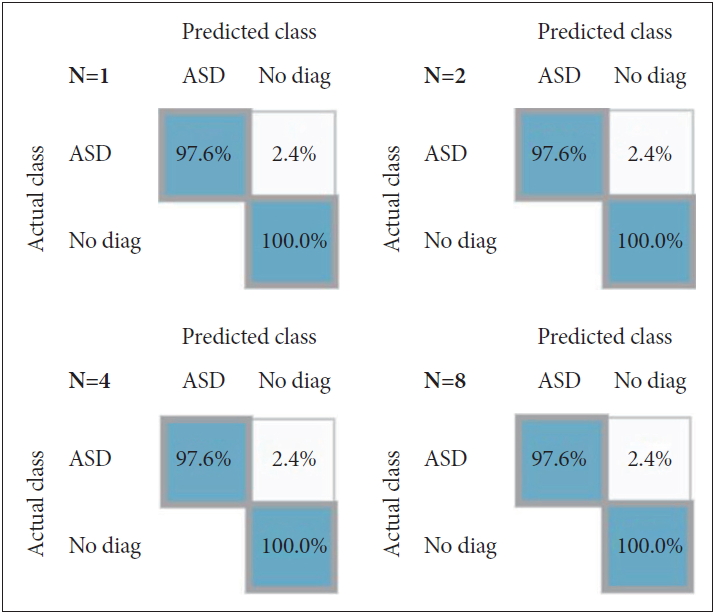
Confusion Matrix of the predictive model (number of tree 1, 2, 4, and 8) for 54 new patients (10% the test bed) with top 5 ranked attributes in the second experimental set. ASD: autism spectrum disorder.
DISCUSSION
Several studies have reported the application of machine learning to ASD diagnosis. Wall et al. [8] summarized 29 items of Module 1 of the ADOS Data Set, provided by the AGRE and AC, as 8 items by applying the ADTree algorithm. A total of 1,000 training steps were executed, with the reported distinction between “Autism” and “Non-Autism.” Duda et al. [23] tested and evaluated the performance of this algorithm by simultaneously applying the observation-based classifier (OBC) algorithm simultaneously. Although previous studies only distinguished between “Autism” and “Non-Autism,” the first part of this study took a step further to predict the subgroup of PDD-NOS in the DSM-IV-TR diagnostic system. The results of this analysis show that machine learning can predict the boundary between ASD and PDD-NOS relatively accurately. As a result of learning data in this study, only 2.6% of cases of normal children were predicted to have PDD-NOS. In addition, in the case of PDD-NOS, the results of predicting it as ASD were almost 3 times higher than those being predicted as “No diagnosis.” Moreover, while the previous studies used datasets with diversified cultural and racial backgrounds, this study only used the data collected from Korean population for the learning process and made a verification for the same population sample. Therefore, it was determined that it was possible to achieve an accuracy, precision, and recall of greater than 90%.
In the second set of this study, all 10 highly ranked ADI-R diagnostic algorithm items were classified only in the Reciprocal Social Interaction and Communication domain. In addition, repetitive behavior and restricted interest domain and stereotyped, repetitive, or idiosyncratic speech subdomains, that are related to repetitive and stereotypical behavior and speech, were not included. Because we used data that are selected from patients over four years old with oral communication, it can be possible that “Reciprocal conversation” item was mainly selected which is used for only persons with oral communication. In a previous statistical analysis study with a Korean ASD population. Jin et al. [24] reported the factor analysis results of 380 Korean ADI-R diagnostic algorithm data and suggested that 16 items may be useful for classification of ASD using a decision tree model. It was reported that a factor (factor 3) including top ranked item (“Reciprocal conversation”) had over 90% sensitivity and 5 items from the top 10 items in this study were included in 16 items that were previously suggested by Jin et al. [24] This could be considered since we did not use the score data (0, 1, 2) of the diagnostic algorithm but the coding value data (0, 1, 2, 3, 7, 8, 9) of each item for the second analysis set, and it gave us more variables for machine learning in this study. In addition, although they used 42 items including domain D (“D. Abnormality of Development Evident at or Before 36 Months”), it did not use items 86 and 87 in domain D in this study.
In another study using AI, Dennis P. Wall summarized 93 items of the ADI-R Data Set, provided by AGRE, Simons Simplex Collection, and AC, as 7 items by applying the ADTree algorithm. ADTree is an algorithm for which the boosting technique of ensemble learning is applied, and it is possible to train an optimized prediction model through the prescribed quantity of learning [25]. Similar to other research, a total of 1,000 training steps were executed, and a distinction between “Autism” and “Non-Autism” was made [9]. In the selected 7 items, “Reciprocal conversation,” “Imaginative play,” “Imaginative play with peers” and “Group play with peers” items were used also in this study as top 5 ranked items. “Comprehension of simple language; answer most abnormal between 4 and 5” is not included in the diagnostic algorithm items and “Age when abnormality first evident” in the domain D was not used in this study. “Direct gaze” item, which was selected in the previous study, was not ranked and “Imitative Social Play” was a new ranked item in this study. Most items were shared with each other between studies, and the differences might be induced by genetic and socio-cultural environmental differences in the study population.
Although it may be induced by the relatively small sample size (n=54) in the 10% test bed, the result with 100% specificity and over 97% sensitivity suggested the possibility of improving the huge ADI-R assay, which requires long time and large efforts by physicians, patients, and caregivers to be simple and effective. In addition, owing to the fact that the confusion matrix after applying the Ranked data were formed identically even after additional learning occurs (Figure 2), it can be determined that the ASD can be sufficiently diagnosed with the ranked attributes without much learning. It can be estimated that the attribute ranked by mutual information is somewhat important for Korean ASD diagnosis. Although, it is not always necessary to reduce diagnostic items because a large amount of information is needed for accurate disease diagnosis, it can be useful for the development of screening tools for populations. Furthermore, the application of AI with more clinical and biological information, such as other diagnostic tools, facial expression, and genetic data for rapid and accurate diagnosis or screening of ASD patients seems to be useful.
Though, the use of previous guidelines (DSM-IV) and family data could be a limitation in the application of decision support for diagnosis, this study showed the possibility of reducing time for diagnosis and suggested the top-ranked items for diagnosis of ASD in a Korean population. As such, AI in medical science may provide for a quick diagnosis, and the final diagnosis can then be arrived at on the basis of appropriate grounds and the specialist’s decision.
Supplementary Materials
The online-only Data Supplement is available with this article at https://doi.org/10.30773/pi.2020.0211.
Acknowledgements
This work was supported by the National Research Foundation of Korea (NRF) grant (NRF-2017R1D1A3B03033533 and NRF-2020R1A2C1009499) and Institute of Information & Communications Technology Planning & Evaluation (IITP) grant (2019-0-00330) funded by the Korea government (MSIT).
Notes
The authors have no potential conflicts of interest to disclose.
Author Contributions
Conceptualization: Soon Ae Kim. Data curation: Min Soo Kang. Formal analysis: Eun Soo Choi. Funding acquisition: Soon Ae Kim. Investigation: Eun Soo Choi. Methodology: Eun Soo Choi. Project administration: Soon Ae Kim. Resources: Min Soo Kang. Software: Min Soo Kang. Supervision: Soon Ae Kim. Validation: Hee Jeong You. Visualization: Eun Soo Choi. Writing—original draft: Eun Soo Choi, Soon Ae Kim. Writing—review & editing: Hee Jeong Yoo, Min Soo Kang.