Clinical and Psychological Characteristics of Young Men with Military Adaptation Issues Referred for a Psychiatric Evaluation in South Korea: Latent Profile Analysis of Minnesota Multiphasic Personality Inventory-2 and Temperament and Character Inventory
Article information
Abstract
Objective
To investigate clinical and psychological characteristics of young men referred for a psychiatric evaluation due to expected unsuitability for military service and identify their heterogeneous subgroups based on the profiles of MMPI-2 and TCI.
Methods
We conducted a latent profile analysis of 348 men using MMPI-2 and TCI and then a comparative analysis of four latent classes in relation to sociodemographic, clinical, and IQ variables.
Results
We identified four classes with distinct clinical and psychological features: Class 1 (nonclinical: n=68), Class 2 (internalized: n=129), Class 3 (externalized: n=60), Class 4 (confused: n=91). Class 1 showed no significant psychiatric symptoms and relatively adaptive temperament and characteristics. Class 2 showed relatively higher harm avoidance and introverted traits indicating vulnerability to internalizing disorder. Class 3 was related to higher novelty seeking, impulsivity, and bipolarity. Class 4 showed the most severe clinical symptoms including psychotic experiences with extremely unstable temperament and immature personality. In total, 50–70% participants reported clinically significant depression, anxiety, and suicidal idea. Participants showed lower processing speed index (M=85.9, SD=16.6) than the general population.
Conclusion
The results suggest that clinical conceptualization and therapeutic intervention considering distinctive features of young men with adaptive problems related to military service are needed.
INTRODUCTION
South Korea has adopted a mandatory military service system. Therefore, unless there is a special reason for exemption, all Korean men over the age of 18 years are duty-bound to enroll in military service. Military service is an important issue affecting an individual’s life and the nation as a whole. It is no exaggeration to say that military duty is one of the most predominant influence on the life of Korean men in their 20s. Challenging environments with limited autonomy and the separation from previous social support systems can lead to various problems with adaptation [1-3]. As the grievances and social impact of men in relation to the military service are high, it is important to understand the psychological characteristics and mental health of young people who are expected to have difficulty in adapting to the military service, and provide directions for intervention.
According to the Military Manpower Administration (MMA) report in 2017, about 93% (n=101,759) of enlisted people aged between 20 and 22 years are enrolling themselves for military service [4]. The early 20s is the beginning of adulthood, marked by a period of confusion and instability. In addition, early adulthood is a biologically vulnerable period for onset of major mental disorders [5,6]. However, unlike other physical illnesses, mental illness is likely to be discovered just before joining the military or immediately after enrollment, due to its implicit nature. About 42.5% of disqualifications of people through military screening tests performed by the MMA were found to be due to neuropsychiatric problems in 2017. About 55.2% returned home after joining the military due to psychiatric problems, and this proportion is increasing annually [4].
Military service itself can act as a significant stressor. Especially, the young generation is habituated to individualism and has a relatively high level of education and rich living conditions; often, their personal values are likely to conflict with military values represented by a hierarchical structure [2,7]. As a result, as young Korean men are under substantial pressure about military service, their animosity regarding the issue is increasing. This is particularly true for those who experience uncertainty regarding military life before joining service, based on others’ negative experiences with the military, media reports, own fear of disconnection from society, worries about future plans, and environmental changes [2,7,8].
According to the stress-vulnerability model, the interaction of biologically predisposed vulnerability and environmental stress can cause the onset and the exacerbation of various mental disorders [9]. Therefore, a systematic evaluation and multifaceted understanding of mental health of young men prior to their military enlistment is essential. Previous studies, however, focus primarily on soldiers in the military service, in trying to preventing extreme behaviors such as suicide, gunshot accidents, and desertion from the army [1,3,10-14]. However, there is little research on mental health and psychological features of young men prior to their enrolment in military service, and psychiatric evaluation for them tends to be used only as a tool for screening, rather than understanding and improving their individual lives.
This study included young men who were referred for psychiatric evaluation because they had or were expected to have difficulty in adapting to military life for some psychiatric reasons. The present study used Latent Profile Analysis (LPA) to organize respondents into subgroups with similar psychiatric symptoms and personality patterns based on profiles of Minnesota Multiphasic Personality Inventory-2 (MMPI-2) and Temperament and Character Inventory (TCI). LPA is a classification method that estimates latent classes (i.e., subgroups with distinctive features) of participants based on their responses on continuous variables [15]. LPA is one of the person-centered statistical approaches that is different from the variable-centered approach. Variable-centered analyses with more than three interacting variables are difficult to interpret and may be less suitable for making inferences about individuals because the results are at the level of the variable, not the person. On the other hand, person-centered approach enables inferences regarding the distinctive nature of individuals based on shared characteristics of multiple variables within homogeneous subtypes. We used the MMPI-2 and TCI, which are the most widely used psychological assessment for personality and psychopathology as the predicting variables for latent profile analysis. The MMPI-2 and TCI are multiscale inventories and not only the elevation of a single scale but also the overall configuration and interaction of scales are important factors in predicting personality, behaviors and mental health characteristics. Both inventories were therefore considered suitable for LPA [16,17].
This study aimed to provide an in-depth understanding of young men referred for a psychiatric evaluation for military service-related adaptation issues and promote development of clinical intervention strategies by integrating characteristics including demographic, psychiatric symptom, temperament, and personality.
METHODS
Participants and data collection
The participants were those referred for a psychiatric evaluation due to the possibility of their unsuitability to military service. They visited a medical center based on their referral. This study included inpatients and outpatients who met the following criteria: 1) those referred for a psychiatric evaluation by the MMA due to lack of suitability for military service, 2) those referred for a psychiatric evaluation for complaints of psychiatric symptoms during military life, or 3) those who came to the department with psychiatric problems and were scheduled for military service Persons with general communication difficulties or who had previously been diagnosed with intellectual disability were excluded.
This study was conducted retrospectively and data were collected from the results of a psychological evaluation administered from April 2015 to February 2019. Psychologists with a master’s degree conducted full-battery psychological evaluation under the supervision of licensed clinical psychologists. Sociodemographic and behavioral data were obtained through chart review. The chart review was conducted by a researcher from March to May 2019, with final coding completed based on an agreement between two clinical psychologists and a psychiatrist. Initially, 389 participants were enrolled in the study; however, data of 41 respondents who did not meet the inclusion criteria or including incomplete questionnaires were excluded from the analysis. Therefore, the analysis ultimately included the data of 348 participants.
Assessment using the Minnesota Multiphasic Personality Inventory-2
MMPI was developed to diagnose psychiatric patients into different categories of psychiatric disease and MMPI-2 was introduced at the end of the 1980s [18-20]. MMPI-2 operates with a T-value of 65+, indicating an elevated score [21]. This cutoff score indicates distinct psychological problems or pathology. Four validity scales (F, L, K, and S) and ten clinical scales were used for LPA in this study. The Reconstructed Clinical (RC) scales, Personality Psychopathology Five scales, and Content scales were used for comparative analysis between latent profiles.
Assessment using the Temperament and Character Inventory-Revised Short
The TCI was developed for explaining, diagnosing, and predicting the development of personality disorder [22,23]. It consists of four temperament dimensions and three character dimensions. Temperament is related to each major neurotransmitter system. Novelty Seeking expresses the activation level of exploratory activities mediated by dopamine. Harm Avoidance reflects the effectiveness of the behavioral inhibition system mediated by serotonin. Reward Dependence reflects the preservation of reward-dependent behaviors and is mainly correlated with norepinephrine. Persistence expresses the preservation of a behavior as resistance to frustration mediated by glutamate. Character dimensions reflect the maturity of the personality. Self-Directedness expresses self-concepts about oneself, and autonomy, which is the ability of directing one’s own life according to personal goals and values. Cooperativeness, dealing with concepts about others and the ability to cooperate and connect with others. Self-Transcendence, expressing the relation between the self and the external world as a whole, includes nature, universal complex, and supreme spiritual entity and the ability to think creatively and appreciate art or nature. The range of T-scores are as follows: low: T<45, medium: 45≤T≤55, and high: 55<T.
Assessment using the Zung Self-Rating Depression Scale
The Zung Self-Rating Depression Scale is a 20-item scale developed to assess the severity of depression symptoms [24,25]. The clinical cutoff scores are as follows—normal: 20–49, mild: 50–59, moderate: 60–69, and severe: 70–79.
Assessment using the Beck Scale for Suicide Ideation Beck
The Beck Scale for Suicide Ideation, which is a 19-item scale developed to assess the severity of suicidal ideation and intention, was used to measure suicidal ideation [26]. Shin [27] translated the scale into Korean and modified it for use as a self-report questionnaire. The clinical cutoff scores are as follows—normal: 0–8, mild: 9–11, moderate: 12–14, and severe: 15–38.
Assessment using the State-Trait Anxiety Inventory
The State-Trait Anxiety Inventory (STAI) was developed to assess two dimensions of anxiety [28,29]. It consists of two questionnaires of 20 items each. The first questionnaire measures state anxiety (how one feels at the moment) and the second measures trait anxiety (how one generally feels). The clinical cutoff scores on state anxiety are as follows—mild: 54–58, moderate: 59–63, and severe: 64–80.
Assessment using the Korean version of the Mood Disorder Questionnaire [30,31]
The Mood Disorder Questionnaire (MDQ) is a self-report screening instrument for bipolar spectrum disorder [30,31]. It is divided into three sections. The first includes 13 yes/no items reflecting manic or hypomanic symptoms derived from both Diagnostic and Statistical Manual (DSM-IV) criteria and clinical experience. The second asks whether several symptoms have been experienced during the same period of time. The third part examines psychosocial impairment caused by the symptoms. In the original validation study of the MDQ, for a positive screening of bipolar spectrum disorder, seven or more positive symptoms needed to be reported, with clustering within the same time period and moderate to severe problems. In this study, only the first criterion (7 or more positive symptoms) was considered for analysis.
Assessment using the Korean Wechsler Adult Intelligence Scale-IV
The Wechsler Adult Intelligence Scale-Fourth Edition (WAIS-IV) is an individually administered clinical instrument designed to assess intellectual abilities in adolescents and adults [32,33]. Five indices including Full Scale Intelligent Quotient, Verbal Comprehension Index, Perceptual Reasoning Index, Working Memory Index, and Processing Speed Index were calculated. The mean score of the five indices is 100, and the standard deviation is 15.
Assessment using the Korean Malingering Diagnostic Test
The Korean Malingering Diagnostic Test (KMDT) is a compulsory selective test to assess the probability of malingering [34]. The probability of malingering can be estimated based on whether the patient deliberately chooses the wrong answer because the test is so easy that most respondents are expected to get a perfect score. The cut-off scores on the test results are as follows—no malingering: 31–36, probable malingering: 13–30, definite malingering: 0–12.
Statistical analysis
The data were analyzed using SPSS 25.0 (IBM Corp., Armonk, NY, USA) and R (The R Foundation for Statistical Computing, Vienna, Austria). LPA was conducted using the Tidy LPA package in R [35]. Indicator variables of the LPA included the T-scores of the four validity scales (F, L, K, and S), 10 clinical scales of MMPI-2, and seven subscales (NS, HA, RD, P, SD, C, and ST) of TCI-RS. Determination of the number of clusters was based on minimization of the Bayesian Information Criteria (BIC), and the Akaike Information Criteria (AIC) parsimony indices, as well as minimization of cross-classification probabilities. The statistical significance of the bootstrapped likelihood ratio test (BLRT) was also considered in the selection of the number of classes. The BLRT uses a bootstrap resampling method to approximate the p-value of the generalized likelihood ratio test when comparing the K0-class mixture model with the K–1-class mixture model. For BLRT, a small probability value (e.g., p<0.05) indicates that the K0-class model provides a significantly better fit to the observed data than the K–1-class. Relative entropy (REN) was used to assess the assignment of cluster membership. The possible range of REN is 0 to 1, and the closer it is to 1, the better is the accuracy of classification.
Comparisons between latent profiles on continuous variables were carried out with analysis of variance. Post-hoc comparisons were conducted using Bonferroni post-test. The χ2 test was conducted to compare of latent profiles on categorical variables. The Bonferroni correction was applied to the interpretation of results of comparative analysis.
Ethics statement
The present study protocol was reviewed and approved by the Institutional Review Board of SMG-S NU Boramae Medical Center (Reg. No. 20-2019-13).
RESULTS
Demographic and clinical characteristics of the sample
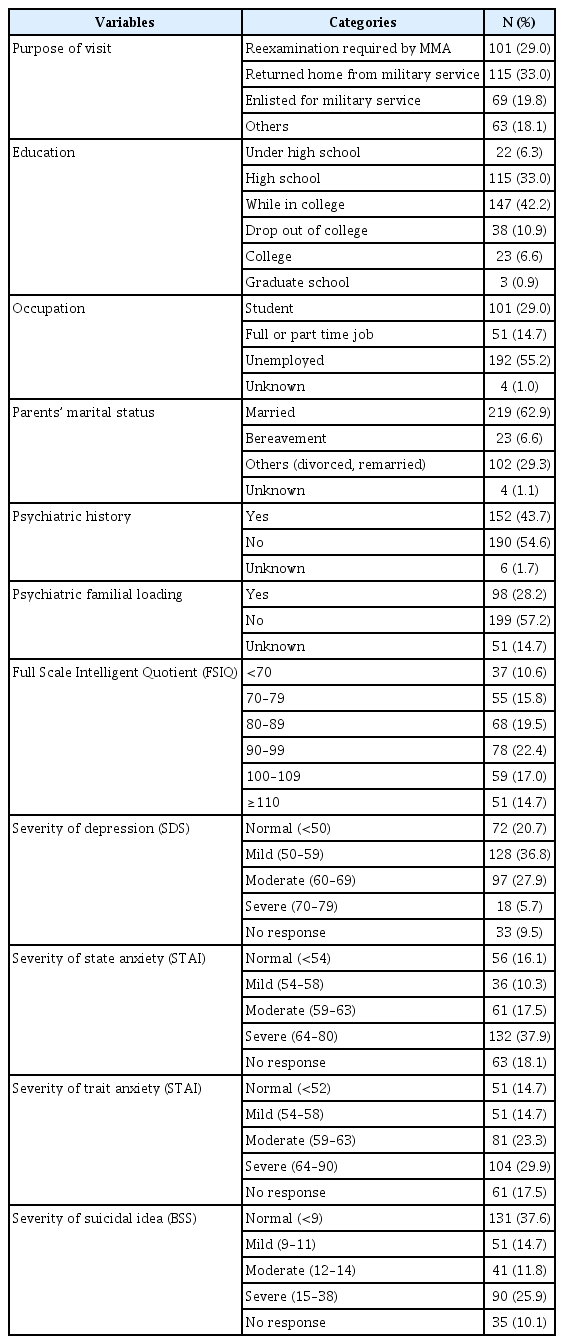
Table 1 shows the participants’ general characteristics. The sample consisted of 348 participants. Their mean age was 21.6 years (standard deviation=2.4), ranging from 19 to 32 years, and about 80% (n=277) participants were aged under 25 years. The mean IQ was 91.3 (standard deviation=17.6), ranging from 46 to 134. About 55% (n=192) of the participants were unemployed, which seems to indicate that most participants had stopped studying or working ahead of their military service enrollment. About 44% (n=152) of the total sample had a psychiatric history, which means they visited a psychiatric institution more than once in the past. About 28% (n=98) of the participants had a familial loading of psychiatric illness. The proportions of participants who exhibited clinically significant range of depression, anxiety, and suicidal ideation were about 50–70%.
Latent profile analysis
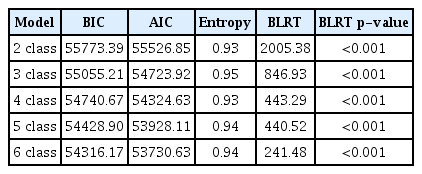
A series of 2 to 6 class solutions were estimated based on the MMPI-2 and TCI-R subscale scores. Table 2 presents the BIC, AIC, entropy, and BLRT values across 2–6 solutions. For BLRT, all results were significant from the two-class model to the six-class model. The best fitting model corresponded to the six-class model, which showed the lowest value of BIC and AIC. However, as we wanted a parsimonious and clinically meaningful model and because the BIC and AIC values after the four models decreased only in relatively small amounts, we decided to retain the four-class solution. The REN was 0.93, higher than the 0.80 proposed by Clark for good classification accuracy.
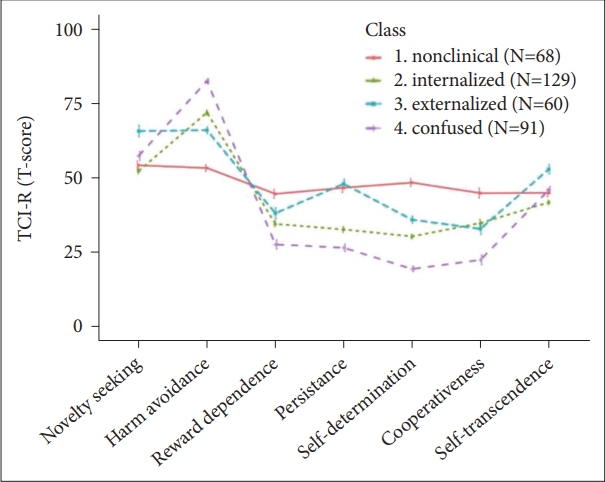
Figures 1 and 2 depict the profile of four classes on MMPI-2 and TCI, respectively. Detailed mean T-scores of indicators are shown in Table 3. About 19.5% (n=68) of the total sample belonged to Class 1. They tended to show the highest scores on the L, K, and S scales reflecting ego-strength, and the lowest scores on the F reflecting deviated experience and confusion among the four classes. All clinical scales were within the normal range (60<T), indicating no apparent psychiatric symptoms. In addition, they showed approximately medium range (45≤T≤55) on all seven dimensions of temperament and characteristics. Thus, Class 1 was named the “nonclinical class.”
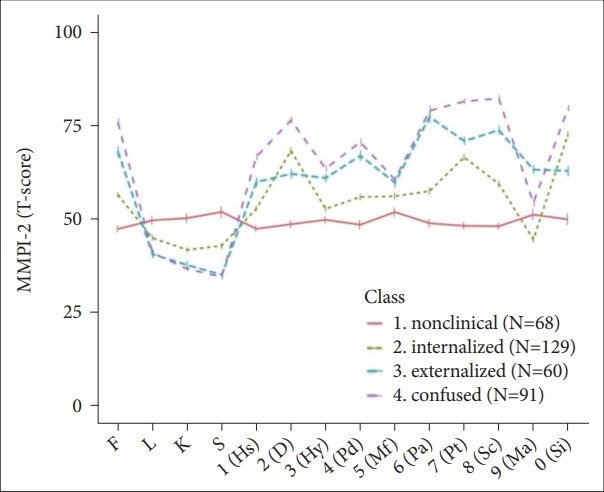
MMPI-2 profile of four latent classes. MMPI-2: Minnesota Multiphasic Personality Inventory-2, F: InFrequency, L: lie, K: C(K)orrection, S: superative self-presentation, Hs: hypochondriasis, D: depression, Hy: hysteria, Pd: psychopathic deviate, Mf: masculinity-feminity, Pa: paranoia, Pt: psychasthenia, Sc: schizophrenia, Ma: hypomania, Si: social introversion.
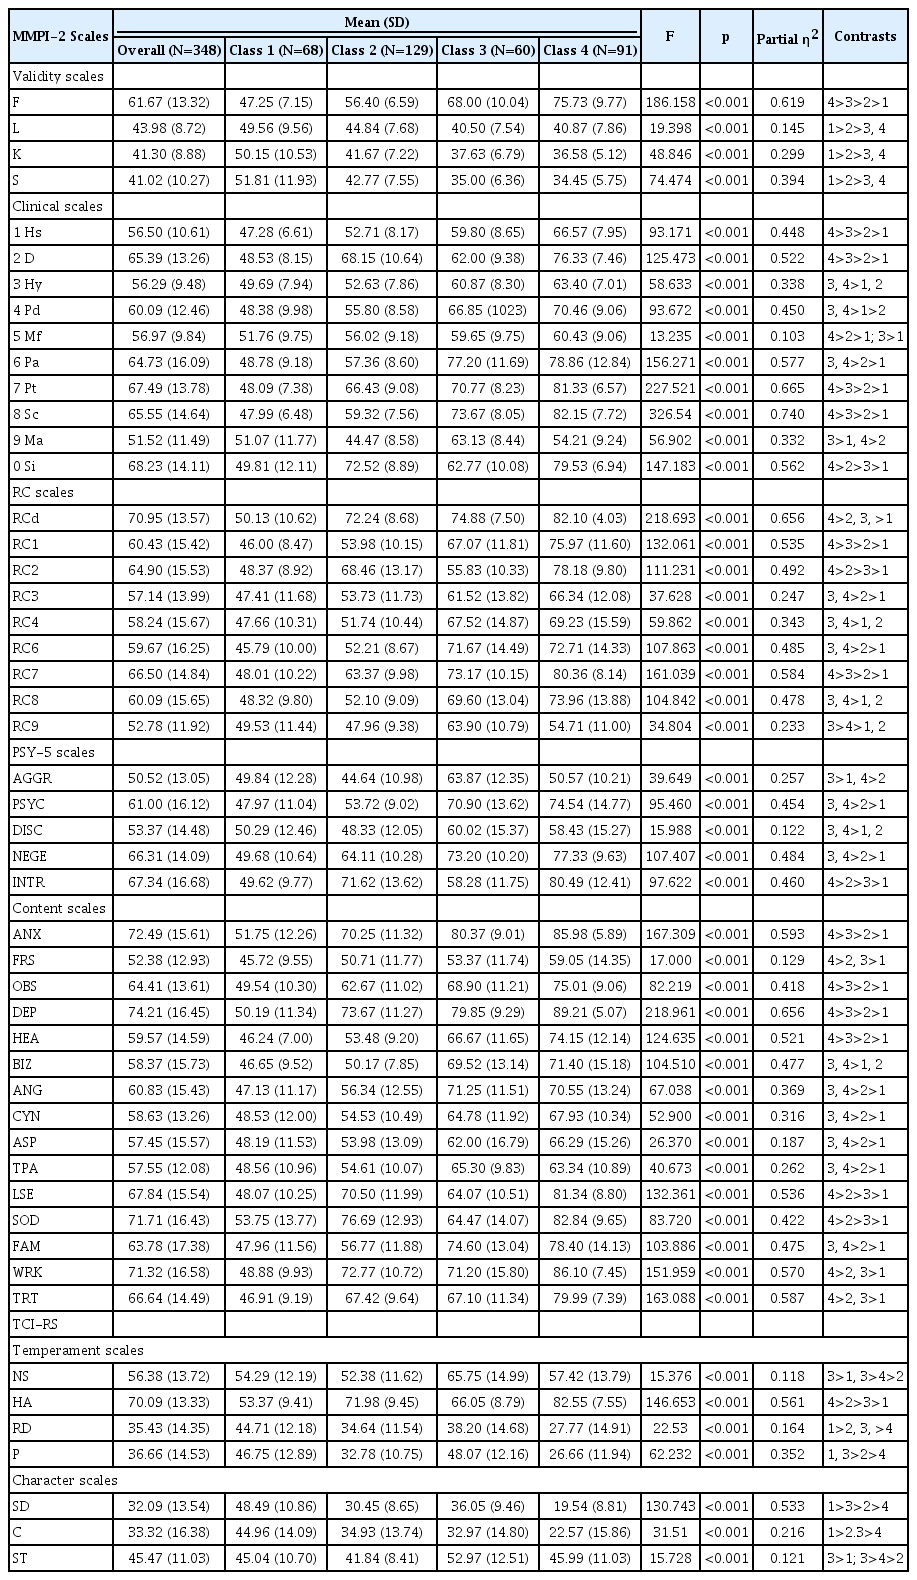
Means and standard deviations of the scores on the MMPI-2 and TCI-RS for the four classes and overall sample
The highest proportion, 37% (n=192) of the total sample, belonged to Class 2. For those in Class 2, the L, K, and S validity scales were the second highest among the four groups and the F scale was slightly higher than the mean (50 T-score). Of the ten clinical scales, the greatest elevation was observed in Depression, 2; Psychasthenia, 7; and Social Introversion, 0 scales with scores above the 65 T-score. Individuals with 2-7-0 code type tend to experience intense feelings of subjective distress including depression, anxiety, and social discomfort and tend to criticize themselves. They showed a higher level of Harm Avoidance than other temperament dimensions. Their mean scores of Reward Dependence, Persistence, Self-Directedness, Cooperativeness, and Self-Transcendence were all in the low range (T<45). Taken together, these results suggested that individuals in Class 2 might be vulnerable to internalizing disorders such as depression and anxiety with strong introversion, shyness, timid and passive traits, low energy levels, and autonomy. Hence, Class 2 was named as the “internalized class.”
Class 3 consisted of 17.1% individuals (n=60) of the total sample. Participants in Class 3 scored the second lowest on the L, K, and S scales and the second highest on the F scale among the four classes. Class 3 and Class 4 shared similar patterns on MMPI-2 profiles. The members in Class 3 showed the greatest elevation on Paranoia, 6; Psychasthenia, 7; and Schizophrenia, 8 scales. However, Class 3 tended to be less dramatically deviated than Class 4. The feature distinguishing Class 3 and Class 4 was that Class 3 scored higher on Hypomania, 9 than Class 4. To further investigate the psychological characteristics of Class 3 and Class 4, we surveyed the mean T-scores of the Restructured Clinical scales, Personality Psychopathology Five scales, and Content scales (Table 3). Differences in supplementary scales were presented in Supplementary Table 1 (in the online-only Data Supplement). Class 3 scored higher on RC9 (Hypomanic Activation) and aggression (AGGR) than Class 4. Class 3 scored lower on low self-esteem (LSE) and social discomfort (SOD) than Class 4. Class 3 also scored the highest on Novelty Seeking among the four classes. These patterns implied that the members in Class 3 possessed more impulsive, aggressive, hostile, irritable, and less restricted psychological features than those in Class 4. Based on these descriptions, Class 3 was named as the “externalized class,” given their inclination toward externalizing problems related to aggressive, defiant, and undisciplined behavior.
Class 4 consisted of 26.1% (n=91) of total sample. They had the lowest scores on the L, K, and S scales, and the highest on the F scale and the majority of clinical scales except Ma (Hypomania, T=54). Specifically, the individuals in Class 4 showed elevation in Depression, 2; Paranoia, 6; Psychasthenia, 7; and Schizophrenia, 8. It should be noted that the 6-7-8 code type reflects insecurity, paranoia, distrust of others, unstable reality testing, and psychotic experiences. In addition, they showed extremely high scores on Harm Avoidance and low scores on Reward Dependence, Persistence, Self-Directedness, and Cooperativeness scales. These results suggest that the individuals in Class 4 had the most severe psychiatric symptoms, diminished sense of reality, and immature and unstable personality structure. Therefore, we named Class 4 the “confused class.”
Comparative analysis of the four latent classes on clinical, malingering-related variables and intellectual ability
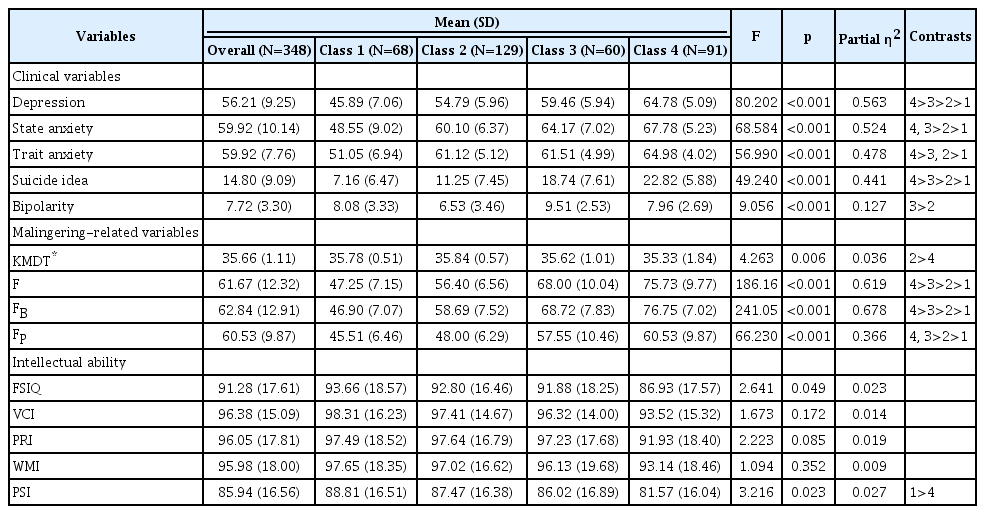
Table 4 shows the differences in clinical and malingeringrelated variables among the four latent classes. Class 1 was in the nonclinical range of depression, anxiety, and suicidal ideation while Class 4 scored the highest on such variables. Class 4 revealed clinically moderate level of depression, severe statetrait anxiety, and suicidal ideation. Class 3 showed the highest level of bipolarity among the four classes. There were significant differences in clinical variables such as depression (F=80.20, p<0.001), state anxiety (F=68.85, p<0.001), trait anxiety (F=56.99, p<0.001), suicide ideation (F=49.24, p<0.001), and bipolarity (F=9.06, p<0.001) among the four classes.
There were significant differences in malingering-related variables such as KMDT (F=4.26, p<0.001), the F scale (F=186.16, p<0.001), the FB scale (F=241.05, p<0.001), and the Fp scale (F=66.23, p<0.001) among the four classes. In all four classes, the mean scores for KMDT was in the “non-malingering” range. However, Class 4 had significantly lower rates of correct responses than Class 2. In addition, Class 4 showed the highest scores on F family scales (F, FB, and FP) in MMPI-2 reflecting faking-bad tendency.
Class 4 showed the lowest scores on all five intelligence indices. However, when applying Bonferroni correction, the differences between the four groups were not statistically significant. However, it should be noted that all four classes revealed a mean IQ below 100. In particular, the Processing Speed Index of all four classes was less than 90.
Comparative analysis of the four classes on sociodemographic variables, drinking, smoking, history of conduct behavior, and school and domestic violence
The age differences between the four classes were significant (F=8.81, p<0.001). Class 4 was found to be significantly older than the other three classes (Class 1: mean=20.90, SD=1.91, Class 2: mean=21.27, SD=2.37, Class 3: mean=21.04, SD=1.70, Class 4: mean=22.48, SD=2.85). However, there were no significant differences in education, occupation, psychiatric history, familial loading of psychiatric illness, and parents’ marital status.
Table 5 indicates the percentage of people who responded with “Yes” in each class in drinking, smoking, history of conduct problems in adolescence, history of school violence, and exposure to domestic violence. Class 3 had the highest proportion in drinking, smoking, history of conduct problems, and exposure to domestic violence. Class 4 reported the highest proportion in school violence victims and offenders but there was no statistically significant difference when Bonferroni correction was applied. The differences in the percentages of smoking (χ2=34.98, p<0.001), conduct problems (χ2=33.16, p<0.001), and exposure to domestic violence (χ2=29.11, p<.001) were still significant after the Bonferroni correction was applied.
Comparison of the four classes on follow-up rates
There was a significant difference in follow-up rates of psychiatric treatment among the four classes (χ2=56.07, p<0.001). In this study, “followed-up” is used to mean that psychiatric treatments in the Medical Center were maintained after undergoing a psychiatric assessment and medical certificate for military service until the time when the chart review for this study was conducted. Class 1 showed the lowest followed-up rate (17.6%, n=12), and Class 2 had the highest followed-up rate (46.7%, n=47). Meanwhile, the followed-up rates of Class 3 and Class were 21.7% (n=28) and 32.9% (n=39), respectively.
DISCUSSION
This study examined the sociodemographic, clinical, and psychological characteristics of Korean young men who were referred for a psychiatric evaluation due to anticipated military maladjustment and identified their subtypes based on the profiles of MMPI-2 and TCI. About 30–40% of participants had a psychiatric history (n=152) and familial loading of mental disorder (n=98). About 30% of them experienced parents’ divorce (n=102) and exposure to direct or indirect domestic violence (n=115). About 55% (n=192) of the sample were unemployed without studying or working. Approximately 70% reported clinically significant level of depression and state and trait anxiety. In addition, 52.4% (n=206) reported suicidal ideation at a clinical level, with about 26% (n=90) classified as severe in this regard. These findings suggest that they were likely to be in socially or psychologically vulnerable situations.
In the next step, we conducted LPA to investigate subgroups of the participants based on their MMPI-2 and TCI profiles. By using MMPI-2 and TCI together as indicators in LPA, we attempted to identify heterogeneity of the participants considering various psychiatric symptoms, biological temperament, and underlying personality structure. The LPA identified four classes with distinctive psychological features: Class 1 (nonclinical: n=68, 19.5%), Class 2 (internalized: n=129, 37%), Class 3 (externalized: n=60, 26.1%), Class 4 (confused: n=91, 26.1%). Class 1 did not complain distinct clinical symptoms and had a relatively adaptive and stable temperament and personality structure. Class 2 showed a relatively higher level of harm avoidance in TCI and 2–7 code type in MMPI-2. These individuals tend to have inhibited, shy, timid, and self-critical characteristics and so are likely to be vulnerable to internalizing disorders such as depression and anxiety. Individuals with code type 2–7 are known to be highly motivated for treatment because they experience high subjective distress and seek help [21]. Class 3 and Class 4 shared similar profiles on the MMPI-2. However, Class 3 showed a relatively higher level of novelty seeking and more aggressive and hyperactive tendency than Class 4. Class 3 showed the highest proportion of smoking, drinking, and history of conduct behavior among the four classes. Class 4 showed the most severe level of almost all psychiatric symptoms and diminished sense of reality. Class 4 seemed to be the group with the high risk showing confusing mixture of symptoms with difficult temperament and immature personality strucutre [36].
Classification using a person-centered approach can provide clinically useful criteria that complement the categorical diagnostic systems of mental disorders. In the past decades, limitations of categorical diagnostic systems such as the DSM and International Statistical Classification of Diseases and Related Health Problems (ICD) have been proposed [37,38]. Categorical approaches have some limitations such as high comorbidity of disease, oversimplification of individual attributes, and overlooking the underlying psychological structure of psychiatric symptoms. Moreover, we reviewed the medical chart and attempted to categorize the participant’s diagnosis based on the ICD (Supplementary Table 2 in the online-only Data Supplement), but approximately 39% of participants belonged to two diagnostic categories, and 28% belonged to three or more different diagnostic categories simultaneously, suggesting high comorbidity. Thus, the four-class solution in this study, based on individual multidimensional characteristics, may help overcome the limitations of categorical diagnostic systems and help plan therapeutic interventions for participants by providing comprehensive clinical conceptualizations.
However, the possibility of malingering should be carefully considered to ensure the validity of the four-class solution. In particular, Class 4 scored high on the variables related to the faking-bad tendency. This could be because as many young men should involuntarily perform military service, many are presumably motivated to avoid military service. However, the instruments used in this study seem to have limitations in detecting malingering. The KMDT is a widely used forced-choice test that requires the individual to choose one of two response options, and has a very low difficulty level. As the KMDT was too simple and easy, only two of 348 participants in the study were in the range of “probable malingering.” The F family scales (F, FB, and FP) in MMPI-2 measure infrequent symptoms that are not usually reported by the general population or even by actual psychotic patients [39]. However, the elevation on F family scales do not always indicate that the respondents are trying to lie, because the F scales are known to correlate with mental confusion and psychotic experiences, and faking bad can occur with or without actual symptoms [40]. In general, the extremely high score (inpatients: ≥100T, outpatients: ≥90T) on the F scale suggests that the profile may be invalid [41]. The next range of scores (inpatients: 80–99T, outpatients: 70–89T) suggest that the subjects may exaggerate their symptoms or problems. However, they may exaggerate their symptoms as part of “crying for help.” [39,41] Class 4 showed mean score of 75T on F scale, which implies that Class 4 might consist of those who really had serious psychiatric symptoms and are crying for help or those who reported more severity of symptoms than the actual level. Therefore, further research and discussion are needed for effective instruments to detect of malingering on mental tests [42].
Another main finding of this study is about intellectual ability of overall participants. There were no statistically significant differences in IQ indices among the four classes although Class 4 tended to score the lowest. However, the mean IQ of total participants (M=91.3, SD=17.6) was about nine points lower than the mean of the general population (M=100, SD=15), and especially the processing speed index was about 15 points lower (M=85.9, SD=16.6). This study excluded those who had general communication difficulty or were clearly diagnosed with intellectual disability. Therefore, the participants in this study may include people with lower intelligence which was not detected so far, or whose IQ was not low enough to be diagnosed as intellectual disability. About 16% (n=55) participants belonged to a borderline intelligence range (generally IQ 70–79), about three times more than the proportion of 6.7% in the general population. Of course, IQ, especially processing speed can be reduced by psychiatric symptoms such as psychomotor retardation and performance anxiety or underestimated due to low level of motivation. However, even for Class 1, who did not report significant clinical symptoms, the Verbal Comprehension Index (M=98.3, SD=16.2), Perceptual Reasoning Index (M=97.5, SD=18.5), and Working Memory Index (M=97.7, SD=18.3) were very close to 100, whereas the mean Processing Speed Index recorded only 88.8 (SD=16.5). This suggests that some participants originally had lower information processing speed regardless of their psychiatric symptoms. Processing speed is a primary element of intelligence and mental capacity. It is also believed to be linked causally to other elements of intelligence and mental functioning [43,44]. Those with slower processing speed may be not adaptive in the face of challenging situations such as military service, when they need to quickly learn new rules and keep pace with others. Slower processing speed is likely to cause problems not only in adaption to military duty but also in their future including seeking employment or long-term daily lives. In order to adapt to the rapidly changing information age, the abilities to quickly select the necessary information from a vast amount of resources and multitask are required. In addition, in the age of highly developed technology, machines or artificial intelligence are replacing the simple tasks that were previously performed by low-skilled workers. Therefore, it is time for the society to seriously consider the adaptation problems of young men with cognitive weakness, such as borderline intellectual functioning or low processing speed, although these are not intellectual disabilities.
Some limitations of this study should be mentioned. First, because a cross-sectional design was employed, we were unable to infer causal relationships between the variables. Longitudinal studies should be conducted to clarify causal relationships and changes over time. Second, the generalizability of our finding is restricted because this study was based on a single center, potentially causing sampling bias. Multi-center studies and replications of the current study are needed to validate primary findings such as the four-class solution and lower processing speed of participants. Third, because sociodemographic data were collected retrospectively through chart reviews, in some cases, the exact information could not be identified. Fourth, structured diagnostic interview tools such as Structured Clinical Interview for the DSM (SCID) were not used in this study. If such tools were included, it would have helped to identify the correspondence of four-class solution and official diagnosis. Fifth, this study did not include objective measurements to assess participants’ daily living adaptability such as interpersonal skills, academic achievement, and occupational ability.
Despite these limitations, the results of the study have the following implications. Although prior to military service, young men often report many psychological problems in stressful situations, few studies have been conducted in this regard. This study has significant implications in that it focused on the mental health and adaptation problems of young men who were expected to have difficulties in military life, and it attempted to identify subgroups through a person-centered approach based on combinations psychiatric symptoms and personality structures. Recognizing heterogeneous subgroups in a sample can benefit clinical conceptualizations and therapeutic intervention [17,45]. Such attempts are not limited to providing criteria for determining military suitability or preventing accidents during military service. Apart from the issue of military service, young adults who lack adaptability may experience significant distress throughout their everyday lives in social and occupational functioning. However, these young adults are no longer the subject of social concern after exemption from military service or the end of their military duty. As they are still in their early 20s when they are exempted from such duty, most of them live under the care of their parents. However, as their parents become older or die and the family system weakens, their lack of adaptability and independence can be a serious social problem. Thus, this study is expected to be the cornerstone of therapeutic interventions and social discourses that will benefit not only their military adaptation, but also their future daily adaptation.
Supplementary Materials
The online-only Data Supplement is available with this article at https://doi.org/10.30773/pi.2020.0044.
Acknowledgements
None.
Notes
The authors have no potential conflicts of interest to disclose.
Author Contributions
Conceptualization: Hee-Yeon Jung, Ah Young Lim, Su Mi Park. Data curation: Ah Young Lim, Eunbin Shin. Formal analysis: Ah Young Lim, Su Mi Park. Supervision: Hee-Yeon Jung. Writing—original draft: Ah Young Lim. Writing—review & editing: Ah Young Lim, Su Mi Park, Hee-Yeon Jung, Jun-Young Lee, Jung-Seok Choi.

