Predictors of Habitual and Addictive Smartphone Behavior in Problematic Smartphone Use
Article information

Abstract
Objective
Smartphones have become common, and problematic smartphone use (PSU) is increasing. Predictors of PSU should be identified to prevent it. Little is known about the role of content types of smartphone use as predictors of PSU. Therefore, we aimed to evaluate the predictors of two proposed concepts of PSU, namely habitual smartphone behavior (SB) and addictive SB, within the context of the application (app) categories.
Methods
We studied 1,039 smartphone users using online surveys conducted between January 2 and 31, 2019. We employed multiple regression analysis to identify the predictors of habitual and addictive SB. We controlled for sex and age (mean=39.20).
Results
Common predictors of habitual and addictive SB were the use of social networking services, games, entertainment apps, and average weekend smartphone usage time. The predictors of habitual SB were the use of web and lifestyle apps, weekly usage frequency, and sex (female) and the predictors of addictive SB were the use of shopping apps and sleep duration.
Conclusion
This study revealed the need to consider habitual and addictive SB in evaluating PSU. The predictors in terms of the content types of smartphone usage can be used to develop monitoring and prevention services for PSU.
INTRODUCTION
Smartphones have become a common feature around the world and an essential part of our daily lives. This global popularity has raised concerns about its negative effects associated with problematic smartphone use (PSU). Scholars define PSU as compulsive and maladaptive smartphone behavior [1]. In South Korea, 20.0% of the people are included in the PSU group according to the smartphone overdependence scale, which measures the self-control failure, salience, and serious consequences of smartphone use [2]. Furthermore, the proportion of PSU in preschoolers (3–9 years old) and the elderly (aged 60 or older) is steadily increasing [2]. Therefore, it is important to identify the predictors or risk factors to prevent PSU.
Van Deursen et al. [3] proposed two concepts in PSU, namely habitual smartphone behavior (SB) and addictive SB. Habitual SB means repetitive smartphone use without self-instruction or conscious thinking, such as automatically checking a smartphone. Oulasvirta et al. [4] reported that the increased habit formation of checking a smartphone for message notification led to an increase in PSU. Addictive SB, a similar concept in smartphone addiction, assumes intensive smartphone use and failure to control the behavior despite significant harmful consequences. As a basic conception, a habit is something that we do regularly and that develops over time with repetition and the repetition may be unconscious [5]. Addiction can appear as a habit in that it involves repetitive behaviors, but addiction is a more complex activity and involves physiological response such as withdrawal symptoms [6,7]. In terms of biological perspectives, habits rely primarily on the cortico-striatal-thalamic circuitry (CSTC) and allow the behavior to be engaged without involving the prefrontal cognitive circuitry [5,8]. However, if habitual behavior begins to lead to unfavorable results, prefrontal executive processing can impose correcting or stopping the behavior [9]. However, addiction is characterized by an inability to cognitively regulate behavior, while a habit is more choicebased [6,7]. Thus, even when presented with negative consequences, the addictive behaviors will continue. The development of an addiction may result from a decrease in executive control over behavior and/or a strengthening of CSTC [6]. These two concepts have both commonalities and differences. Therefore, it is necessary to consider both the habitual and addictive SB aspects to evaluate more specific predictors of PSU. However, no research has been conducted yet that predicts and distinguishes habitual and addictive SB in smartphone use.
Previous studies have evaluated psychological predictors such as low self-esteem, depressive symptoms [10], interpersonal anxiety [10], low self-control [10,11], and impulsivity [12] in PSU. Recent studies have also examined the types of smartphone usage such as social use [e.g., social networking service (SNS)] [13] and non-social use (e.g., browsing the Internet for news or entertainment) [3,14]. With regard to types of smartphone use, some studies found that social media use was related to PSU [13], while others reported that non-social smartphone use was more strongly associated with PSU [3,14]. However, little is known about the specific types of smartphone usage, especially in habitual and addictive SB.
Therefore, we aimed to find out the predictors of habitual and addictive SB in relation to the role of content types of smartphone use based on application (app) usage behavior.
METHODS
Participants
We received smartphone users’ survey data from a polling company between January 2 and January 31, 2019. The polling company was dataSpring. The company has Korean online panel with 379,451 people (https://www.d8aspring.com/asiansample) (as of January 2020). The company sent mail, including an online survey link, and an informed consent link to an online panel and all participants completed anonymous web-based questionnaires. The inclusion criteria were that participants should be smartphone users and adults in their 20s to 50s. Respondents with the same answer, meaningless short answer responders (e.g., ^^, *&^&, etc.), and logical error responders were excluded from the study. In addition, we regarded the responses of those who responded faster than the minimum expected time as meaningless responses; therefore, we also excluded them. Finally, 1,039 smartphone users were included in the analyses.
Ethics
The study was conducted in accordance with the Declaration of Helsinki and was approved by the Institutional Review Board of Catholic University (IRB number: MC18QNSI0101).
Measures and procedure
This study used 14 variables: two dependent variables, 10 independent variables, and two control variables. Furthermore, it used a multiple regression analysis to identify the predictors of habitual and addictive SB (Figure 1).

Research process.
We used habitual SB and addictive SB as dependent variables. Habitual smartphone usage was measured using an instrument adapted from Limayem et al. [15]. The original scale was developed for habitual Internet use, which the previous study adapted to the use of smartphones, and had shown a high internal consistency (Cronbach’s α=0.92) [3]. The modified scale for habitual SB consisted of six items with a five-point Likert scale from 1 (never) to 5 (always). The total score was from 6 to 30. Higher scores indicated greater habitual SB.
Addictive smartphone usage was measured using the modified version 3 of the mobile phone problem use scale developed by Bianchi and Phillips [16]. This modified scale consists of 26 items covering addictive features of smartphone use such as tolerance, withdrawal, craving, escape from problems, social motivation, and negative consequence had good internal consistency (Cronbach’s α=0.93) [3]. In an original scale, addictive smartphone behavior consisted of 26 items measured using a ten-point Likert scale. However, we used a five-point Likert scale from 1 (never) to 5 (always) to make the response easier. Therefore, the total score was from 26 to 130. Higher scores indicated addictive SB.
Nine variables related to smartphone usage and sleep duration were used as independent variables. These were three smartphone usage patterns (weekday smartphone usage time, weekend smartphone usage time, and weekly frequency of smartphone use) and six content types of smartphone use according to the apps (SNS/Chatting, web, games, entertainment, shopping, and lifestyle) (Table 1). The types of smartphone use included 16 classified items: finance, systems, web, SNS/chatting, shopping, business, tools/productivity, entertainment, weather, transportation, photos, lifestyle, health/exercise, games, education, and decoration [17]. Among the 16 items, two researchers and one psychiatrist chose the six smartphone app categories based on the apps that are mostly used.

Six smartphone app categories
The SNS/Chatting apps are mainly used for seeking social relationships and consist of social networks, messengers, chatting, and vlogs. The web apps are primarily used for seeking information and consist of web browsers such as Naver, Google, Chrome, Daum, Nate, and Dolphin. The game apps are for game enjoyment such as simulation games, role-playing games, arcade games, action games, board games, game money, and game items. Entertainment apps are apps that have diverse content for enjoyment, such as media/videos, sports, travel, music, books, and comics. Shopping apps are mainly for consumption and buying purposes and consist of clothes, tickets, books, and used items. Finally, lifestyle apps are predominantly for ordinary life maintenance such as phone calls, text messages, e-mails, addresses, diaries, deliveries, and delivery tracking. Each item in the perceptions of app uses consisted of a five-point Likert scale from 1 (never) to 5 (always).
We also included sleep duration as an independent variable because lack of sleep and sleep disturbance was found to positively correlate with PSU and Internet addiction in previous studies [18-20]. Other studies also showed that smartphone addiction correlates with sleep quality [21-23]. A previous study even observed whether the phone screens of users are on/off to detect sleep duration [24]. In addition, sleep disturbances have been reported to be associated with various mental conditions [25,26]. Accordingly, we thought that sleep duration might be an important factor and should be considered as an independent variable in PSU.
Finally, we controlled for sex and age to focus on the 10 variables as mentioned above because previous studies indicated that women and young people engage in PSU more than men and elderly people do [11,27].
Statistical analysis
We conducted a multiple regression analysis on 1,039 smartphone users using R (version 3.5.0). Among the variable selection methods, we used the “enter” method for inputting independent variables.
RESULTS
Participants’ characteristics
As shown in Table 2, 50% of the respondents were male. The respondents’ ages were evenly distributed from 20s to 50s. In terms of marital status, 54.1% of the respondents were married or living with a partner. Most (66.9%) of the respondents belonged to the group consisting of office workers, administrative professionals, service industry professionals, professional technicians, freelancers, and production employees. The monthly income of 57.5% of the respondents was over $3,584.23. In addition, 63.2% of the respondents lived in the capital city and 82.9% had Android phones.
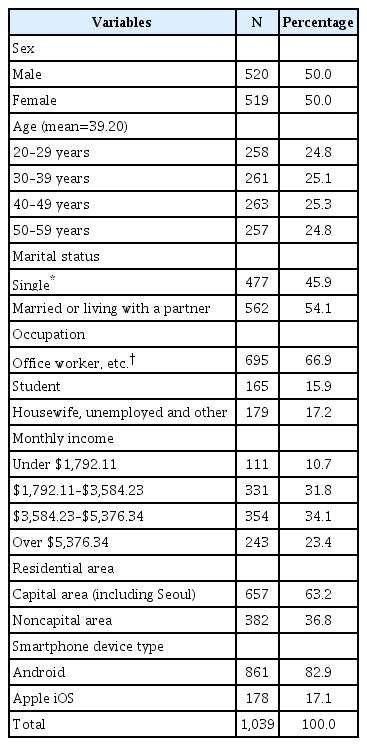
Demographic characteristics
Predicting factors of the habitual and addictive SB
Table 3 and Figure 2 show the results of the multiple regression analysis to identify the predictors of habitual and addictive SB.

Multiple regression analysis results
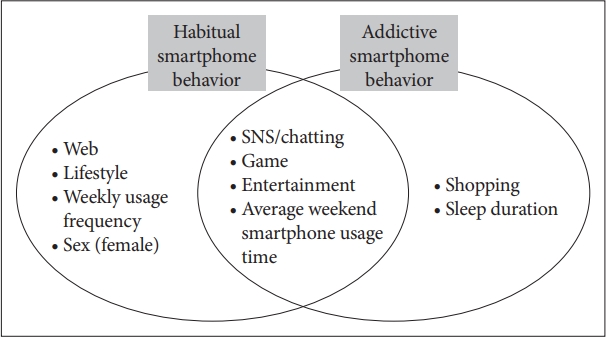
Predictors of habitual and addictive SB.
We found the following to be the predictors of habitual SB. The app usages for entertainment (t=5.493, p≤0.001), SNS/chatting (t=4.983, p≤0.001), web (t=4.868, p≤0.001), lifestyle (t=4.128, p≤0.001), and games (t=2.712, p=0.007) were significantly associated with habitual SB. In addition, weekly usage frequency (t=3.041, p=0.002), average weekend smartphone usage time (t=2.169, p=0.030), and sex (female) (t=2.885, p=0.004) were significantly associated with habitual SB (F=35.601, p≤0.001). According to the standardized coefficients representing the relative contribution of the independent variables, entertainment apps had the greatest effect on habitual SB (β=0.178), followed by web apps (β=0.158), SNS/chatting apps (β=0.150), lifestyle apps (β=0.132), average weekend smartphone usage time (β=0.088), weekly usage frequency (β=0.082), sex (female) (β=0.080), and game apps (β=0.077). The coefficient of determination (R2) for this model was 0.294, indicating that 29.4% of the variation in habitual SB can be explained by these eight independent variables.
The following were found to be the predictors of addictive SB. The usage of game (t=7.719, p≤0.001), shopping (t=5.369, p≤0.001), entertainment (t=2.991, p=0.003), and SNS/chatting apps (t=2.895, p=0.004), average weekend smartphone usage time (t=2.072, p=0.039), and sleep duration (t=-2.919, p=0.004) were significantly associated with addictive SB (F=19.450, p≤0.001). Game apps had the greatest effect on addictive SB (β=0.235), followed by shopping apps (β=0.186), entertainment apps (β=0.104), SNS/chatting apps (β=0.094), average weekend smartphone usage time (β=0.090), and sleep duration (β = -0.083). The coefficient of determination (R2) for this model was 0.185, indicating that 18.5 percent of the variation in addictive SB can be explained by these five independent variables.
The predictors that were common for both habitual and addictive SB were the use of SNS, game, and entertainment apps and average weekend smartphone usage time. The predictors of habitual SB, which were not predictors of addictive SB, were the use of web and lifestyle apps, weekly usage frequency, and sex (female), while the predictors of addictive SB, which were not predictors of habitual SB, were the use of shopping apps and sleep duration.
DISCUSSION
In the present study, we identified the predictors of the two concepts of PSU, namely habitual and addictive SB, especially in relation to the content types of apps, smartphone usage pattern, and sleep duration.
First, we identified the common predictors of habitual and addictive SB.
The predictors that were common for both habitual and addictive SB were the use of SNS, games, and entertainment apps according to the content types of the apps. In other words, the problematic use of the SNS, game, and entertainment contents may have characteristics of both habitual and addictive SB. In the aspect of addictive usage, previous studies reported that SNS, game, and entertainment contents tend to be addictive [28-31] and their uses were positive predictors of smartphone addiction according to the media content types [32,33]. In our study, among the three content types, the use of game apps had a greater influence on addictive SB than on habitual SB (t-value of addictive and habitual SB=7.719 and 2.712, respectively). Past studies demonstrated that online game attraction and online game use were significant predictors of Internet addiction – one of the other technological addictions [34-36]. These might suggest that smartphones are gradually replacing desktops in the use of these content types. In the aspect of habitual usage, although the uses of all three content types were predictors of habitual SB, the use of SNS and entertainment apps had a greater influence on habitual SB than on addictive SB. The SNS app category consists of social networks, messengers, chatting, and vlogs and the entertainment app category consists of comics, media/videos, sports, travel, music, and books. These categories are closely related to the most popular apps such as Facebook, YouTube, Instagram, KakaoTalk, and Line. Recently, social networking channels such as Facebook and Instagram are not only used for social communication, but also for self-representation or recording users’ daily lives, like a part of a diary. In addition, entertainment apps such as YouTube have become a platform widely used not just for fun but also for purposes of obtaining information. This diversification of usage of SNSs and entertainment may be linked to why their use has aspects of both habitual and addictive SB. In other words, it is assumed that these types share not only rewarding elements from the original purpose of use of these apps, such as enjoyment, but also habitual elements from the extended usage purpose such as managing one’s own life. In addition, the average weekend smartphone usage time, not weekday usage time, was also a common predictor. This may be because the majority (about 83%) of our study participants were office workers or students. However, this result is consistent with other studies among adolescents or adults, which showed that weekend average usage time was a predictor of PSU [37,38].
Second, we identified the different predictors of habitual and addictive SB.
The predictors of habitual SB, which were not predictors of addictive SB in terms of content types of smartphone use were web and lifestyle apps. The web apps category consisted of web browsers, while the lifestyle app category consisted of phone calls, text messages, e-mail addresses, diaries, real estate, deliveries, and delivery tracking. The web and lifestyle apps are closely related to everyday life and currently accessed them more from smartphones than from any other types of device because of the ubiquitous accessibility nature of smartphones. A previous study reported that checking e-mails or messages was related to the strongest habitual pattern and that these kinds of brief-checking behaviors may increase overall smartphone use [4]. In addition, the frequency of the weekly smartphone use was another predictor of habitual SB. Considering that the definition of habitual SB implies the repetitive use of a smartphone, it is natural that habitual SB was associated with the weekly usage frequency. On average, people check their smartphones 46 times per day [39] A previous study revealed that the frequency of smartphone use was as important as the amount of usage to identify PSU [33].
Furthermore, we found that the female sex was a predictor of habitual SB although we designed our study to control sex. In other words, women engage in more habitual SB than men do. Previous studies reported that sex is a critical factor in PSU [40,41] and there was a gender difference in the way a smartphone was used [3]. This may suggest that the predictors of smartphone addiction previously identified may be more related to habitual SB in women when we evaluate PSU based on the habitual and addictive SB concepts. Therefore, in order to understand and manage people who have PSU, there is a need to consider both the habitual and addictive SB aspects.
The only predictor of addictive SB that was not a predictor of habitual SB in terms of application type was shopping apps. Previous studies suggested that pathological online buying shares several key characteristics with behavioral addictions and it is considered a form of Internet addiction [42]. In addition, an increase in craving was observed after online shopping picture exposure and this craving reaction correlated with pathological buying behavior [42]. Over the past decade, the shopping process has been altered and shopping enabled via the smartphone introduces new features to the shopping experience. This current smartphone-based shopping experience featuring a variety of visual product advertisement, convenience, and ease of use even in the overseas store may trigger craving and lead to addictive behavior.
Finally, we found an association between sleep duration and addictive SB. Consistent with our findings, many studies have reported a positive association between sleep deprivation and PSU or between poor sleep quality and PSU [18,22,43]. Sleep problems such as bedtime phone usage before sleep may not only contribute to the onset of PSU but was shown to act as a prognostic factor for PSU recover [44]. These results support the hypothesis that smartphone use affects sleep patterns, for example, through light stimulation, which would therefore explain the addictive SB increasing sleep deprivation. Furthermore, sleep plays a significant role in mental health; thus, many studies have focused on sleep as a behavioral marker in mental health [19,26,45,46]. Therefore, there is a need to carefully monitor and manage sleep to predict and prevent addictive SB.
Overall, the present study showed the presence of different predictors of habitual and addictive SB in PSU depending on the content types of smartphone use, smartphone usage pattern, and sleep duration. However, our findings need to be interpreted cautiously because PSU cannot be explained by either habitual SB or addictive SB, just like habit formation is partly involved in the mechanism of addiction but habitual action itself does not cover all addictions in terms of sensitization or negative reinforcement [47,48]. Therefore, we should consider both aspects and their interaction when approaching PSU.
Nevertheless, the current study is significant. The study proposes that there are habitual and addictive SB aspects in PSU and clarifies which types of smartphone use are related to PSU in the habitual and addictive SB aspects. The results show that the types of productivity enhancement, such as e-mail, and information seeking, such as browsing the news, are related more with habitual SB, while the types of consumption and buying, such as shopping are more related with addictive SB. The types of social information and relationships such as social network, gaming, and entertainment (e.g., viewing movies) are related to both habitual and addictive SB. These results suggest that the categorization with a strong association between stimuli (e.g., e-mail alarm or headlines) and response (e.g., checking) occurs in habitual SB and that the maladaptive and aberrant recruitment of habit process leads to PSU [48,49]. Whereas the categorization with an association between action (e.g., buying) and outcome (e.g., obtaining rewards or avoiding unpleasant states) has more reinforcing effects and this feature can be related to addictive behavior [48]. In addition, the categorization with a variety of functions may have both habitual and addictive aspects depending on the users’ purpose.
We developed the smartphone addiction risk rating score for a smartphone addiction management application based on habitual SB and addictive SB [50]. In this app, users periodically respond to related questionnaires of habitual SB and addictive SB. It calculates the smartphone addiction risk rating score and provides an interventions based on the risk score. In addition, In the current app, it is possible to calculate the users’ habitual SB score and addictive SB score by using app category usage, weekly usage frequency, sex, weekend usage time, and sleep duration reported by users. We derive the score using the regression equation derived from the study.
In future research, we intend to collect actual usage by app category usage, weekly usage frequency, weekend usage time, and sleep duration through updated app. By collecting the actual data, it is possible to calculate the habitual SB score and addictive SB score without users’ response of questionnaires. We can provide interventions for each based on the derived scores. Currently, the smartphone management app has been developed as the first version. In the future, our results will be verified with actual data.
The limitations of this study and suggestions for future studies are as follows. First, we used smartphone usage data from a self-reporting questionnaire. Some studies have reported that respondents’ estimates of their smartphone use do not necessarily relate to actual use [51]. Moreover, there was time distortion, where self-reporting smartphone use time was significantly lower than the recorded total smartphone use time via the app [52]; therefore, the studies recommended using objective usage measurements to predict behavior [53]. In line with these results, future research can use real smartphone usage as sensing data from mobile devices and compare the differences between self-reporting estimates and actual use. Second, we used only the content types of smartphone use, smartphone usage patterns, and sleep duration as independent variables. Previous studies have demonstrated psychological predictors such as depressive symptoms and anxiety in PSU [10] and process smartphone usage pattern mediated relationships between anxiety and PSU [14]. Therefore, future research can add psychiatric factors, such as depression, symptoms of attention deficit hyperactivity disorder (ADHD), and anxiety [54]. Third, we used only six categories of smartphone apps – Google Store has 35 categories of apps. Future research can use diverse and subdivided app categories. Fourth, habitual and addictive SB are meaningful concepts in PSU, but there was no cutoff in the measurement for both types of SB used in the present study. If there is a cutoff value, future research can perform different analyses, such as logistic regression.
The present study suggests that there is a need to consider the habitual and addictive SB aspects to evaluate PSU and that habitual and addictive SB have not only similar features but also different features with respect to the content types of smartphone usage. In addition, these common and different predictors, including using apps and sleep duration, can be used to develop monitoring and prevention services for PSU. Our findings may also be able to take a new approach to future investigations about PSU.
Acknowledgements
This work was supported by a National Research Foundation of Korea (NRF) grant funded by the Korean government (MSIT) (NRF2018R1C1B6007750).
Notes
The authors have no potential conflicts of interest to disclose.
Author Contributions
Conceptualization: Mi Jung Rho. Data curation: Jihwan Park. Formal analysis: Jihwan Park. Funding acquisition: Mi Jung Rho. Investigation: Mi Jung Rho. Methodology: Mi Jung Rho, Jihwan Park. Project administration: Mi Jung Rho. Resources: Mi Jung Rho. Software: Jihwan Park. Supervision: Mi Jung Rho. Validation: Jo-Eun Jeong. Visualization: Jihwan Park. Writing—original draft: Jihwan Park, Mi Jung Rho. Writing—review & editing: Mi Jung Rho, Jo-Eun Jeong.