Identification of Central Symptoms in Depression of Older Adults With the Geriatric Depression Scale Using Network Analysis and Item Response Theory
Article information
Abstract
Objective
This study aimed to identify the central symptoms of late-life depression using network analysis and the item response theory.
Methods
A total of 3,472 older adults were enrolled and the Geriatric Depression Scale-15 (GDS-15) was used to evaluate the depressive symptoms. To identify the central symptoms and the network structures among the individual symptoms, the analyses of symptom network structures and item response theory were performed.
Results
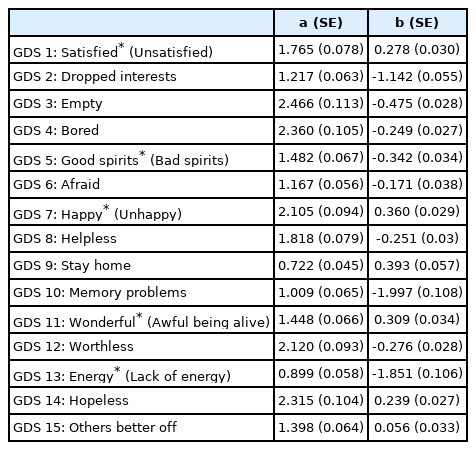
Among items on the GDS-15, “Happy,” “Hopeless,” “Empty,” “Bored,” “Worthless,” and “Good spirits” showed significantly higher strength centrality than the other symptoms. Among all the edges, the edge between “Empty” and “Bored” was the strongest; however, these two symptoms were not connected strongly to other symptoms. In the analysis of item response theory, “Empty,” “Bored,” “Hopeless,” “Worthless,” “Happy,” “Helpless,” and “Satisfied” presented a very high value on the discrimination parameter.
Conclusion
Our study identified the central symptoms and the network structures among symptoms listed on the GDS-15. Most of central symptoms identified by network analysis and item response theory coincided. Our results suggest that these central symptoms need to be prioritized as highly comorbid symptoms and can contribute to the development of a brief screening tool for the elderly.
INTRODUCTION
Depression in late life is a common psychiatric pathology affecting the quality of life negatively. The community prevalence of clinically relevant depressive syndrome in older adults (aged 55+) has been reported as being 13.5%, with a 1.8% prevalence of major depression [1]. Moreover, the prevalence of depression increases substantially with aging. A meta-analysis reported that people in latest life (aged 75+) showed a 7.2% and 17.1% prevalence of major depression and depressive disorders, respectively [2]. Depression in elderly people may have differential characteristics from those of young adults [3]. For instance, elderly people are less likely to present cognitive-affective symptoms such as dysphoria, worthlessness, and feelings of guilt [4]. The prevalence rate of depression markedly increases with other medical conditions [3]. In addition, depression in older adults has heterogeneous characteristics in clinical symptom presentation, which is accompanied by a variety of differential factors such as sex, age, chronic physical illness, cognitive impairment, and psychosocial adversity [5,6].
These various symptoms are interconnected through their reciprocal influences on each other. For instance, depressed mood might induce insomnia, which, in turn, perpetuates the symptoms of fatigue and lack of concentration; these symptoms then complete the circular loop by further aggravating the depressed mood [7-9]. However, conventional approaches using psychiatric scales have focused on the summed up scores of the items listed in a specific rating scale to determine the severity of psychiatric symptoms or validity and reliability of the scales, such as internal consistency and construct validity [10]. While these approaches are popular and easy ways to assess the severity of mental disorders, they often lead to overlooking the interpersonal variability of symptom presentation or the interaction among the individual symptoms [10]. This paradigm of summed-up scores based on the hypothesis of symptom homogeneity may cause a delay in progress of research on psychiatry disorders.
To overcome these limitations of conventional approaches, researchers have recently emphasized focusing on individual symptoms and their interactions [11]. Network analysis and item response theory (IRT) are analytic methods that provide additional information on mental disorders by focusing on individual symptoms rather than the summed-up scores of rating scales [12,13]. The approach of network analysis, which is a relatively recent method, is a useful framework to reveal the dynamic relationships between the interwoven symptoms of depression [13]. In addition to exploring the interaction among the individual symptoms of depression, network analysis is also useful in identifying the central symptoms of depression [8]. For instance, a study investigated the centrality of 28 depression symptoms, including the Diagnostic and Statistical Manual of Mental Disorders (DSM)-defined symptoms, and found that individual symptoms differed substantially in their centrality values, and symptoms listed in the DSM criteria were not more central than non-DSM symptoms [14]. Another network analysis of depressive symptoms in late life found that the centrality in the individual symptoms is different, with the highest centrality being found in the symptoms of “Death wishes” and “Loss of interest.” [15]
The identification of the central symptoms is as crucial as the planning of the treatment target for the evaluation and diagnosis of late life depression. Additionally, a parsimonious assessment tool is beneficial for the assessment of depression because it reduces the burden on the respondents and enhances compliance with the assessment, as reflected in fewer skipped or missing values [16]. In particular, simple and easily understandable assessment tools are more suitable for older adults because they often suffer from impaired cognition [17]. IRT, first introduced in the field of psychometrics for ability assessment, is widely used to calibrate and evaluate items in psychiatric assessment tools [18]. Contrary to the classical test theory, IRT assumes that each item included in a scale is differentially related to overall depression [19,20]. Thus, IRT can be used not only for improving scoring accuracy, but also for building an efficient scale by adopting only the highly discriminative items [18]. The two-parameter logistic (2PL) model of IRT provides the parameters of location and discrimination for each item. The discrimination parameter is a measure of the differential capability of an item, which allows the item to differentiate among the respondents [18]. Thus, items with a high discrimination parameter can be regarded as the central symptoms majorly related to depressive disorder.
The identification of central symptoms can provide valuable information on late-life depression. For instance, a Netherlands study on the symptom network of depression and dementia found that “helplessness” and “worthlessness” were connected to functional disability, and that dementia was only connected to “memory problems” among the depression symptoms [21]. However, there are still a few studies on the central symptoms of depression by network analysis [15,21,22]. In addition, symptom presentation in geriatric depression might have cultural differences. For instance, a cross-cultural study on the comparability of the Geriatric Depression Scale (GDS) reported substantial differences in factor structures between older Korean and American people, despite good reliabilities in each sample [23]. Korea is one of the fastest aging societies, with the proportion of its population aged 65 years and above soaring from 7% in 2000 to 14.4% in 2020, and a further estimation of the expansion of this population to 20% in 2026 [24]. The prevalence of depression in Korean older adults has also been reported to be high, with 10.1% experiencing possible depression, 17.8% experiencing probable depression, and 27.8% experiencing overall depression [25]. However, to our knowledge, there has been no study that has identified the central symptoms of depression by utilizing both network analysis and IRT. Thus, this study aimed to identify the central symptoms in late-life depression with GDS using network analysis and IRT in the Korean population.
METHODS
Participants and procedure
Our study was performed by a retrospective chart-review of 3,484 older adults aged 60 or over, who participated in the nationwide dementia screening and registry program, conducted in Chungnam province of South Korea. This province has a mixture of rural and urban areas, and a population of approximately two million. We recruited patients with dementia from a geriatric psychiatry clinic (Dankook University Hospital, DKUH) and communities. All the participants underwent standardized clinical interviews, and neurological and physical examinations, which were administered by geriatric psychiatrists, according to the protocol of the Korean version of the Consortium to Establish a Registry for Alzheimer’s Disease clinical assessment battery (CERAD-K) [26] and the Mini International Neuropsychiatric Interview (MINI) [27], to diagnose dementia, stroke, and major psychiatric disorders, respectively. All the geriatric psychiatrists were trained in neuropsychiatry and dementia research. From the 3,484 participants, those whose response to any of the GDS items was missing were excluded (12 participants); hence, 3,472 participants were included in the final analysis. This study’s protocol was approved by the Institutional Review Board for Human Subjects of Dankook University Hospital (IRB No. DKUH-2020-09-020-002).
Assessment
To assess the severity of depression, we utilized the GDS, which is one of the most popular scales for assessing late-life depression. GDS was originally developed with 30-items having binary responses of either a “yes” or a “no” for each item [28]. Its shorter version of 15 items (GDS-15) was developed later to improve the compliance with assessment [29]. GDS-15 was reported to be effective in the detection of late-life depression in primary care with high sensitivity and specificity as compared to other tools as well as to the original version of GDS [30,31]. The Korean version of GDS-15 was validated by Bae and Cho [32]. Each item of the GDS-15 was read aloud by the investigator, and the patients were requested to respond with either “yes” or “no.” For 10 of the items, a response of “yes” suggests the presence of depressive symptoms, coded as “1” point; the remaining five items are reverse items, for which a response of “no” indicates the presence of depressive symptoms, coded as “1” point.
Statistical analysis
Constructions of the symptom network
GDS-15 includes items having only binary responses of either a “yes” or a “no.” The Ising model is known to be an appropriate model for the analysis of the symptom network for binary data [33,34]. To constitute the parsimonious network, we applied the “least absolute shrinkage and selection operator” (LASSO) technique [35] with the tuning parameter to minimize the Extended Bayesian Information Criterion (EBIC) [34,36]. Theoretically, the network structure can have 15 symptom nodes and 105 (=15×14/2) edges connecting two symptom nodes. However, the LASSO technique shrinks off some edge weights to zero and identifies the set of significant edges. The accuracy of the estimated edge weights was assessed by performing nonparametric bootstrapping 2,500 times with 95% confidence intervals. The symptom network was estimated using IsingFit package 0.3.1 of R software (R core team, Vienna, Austria).
Centrality indices
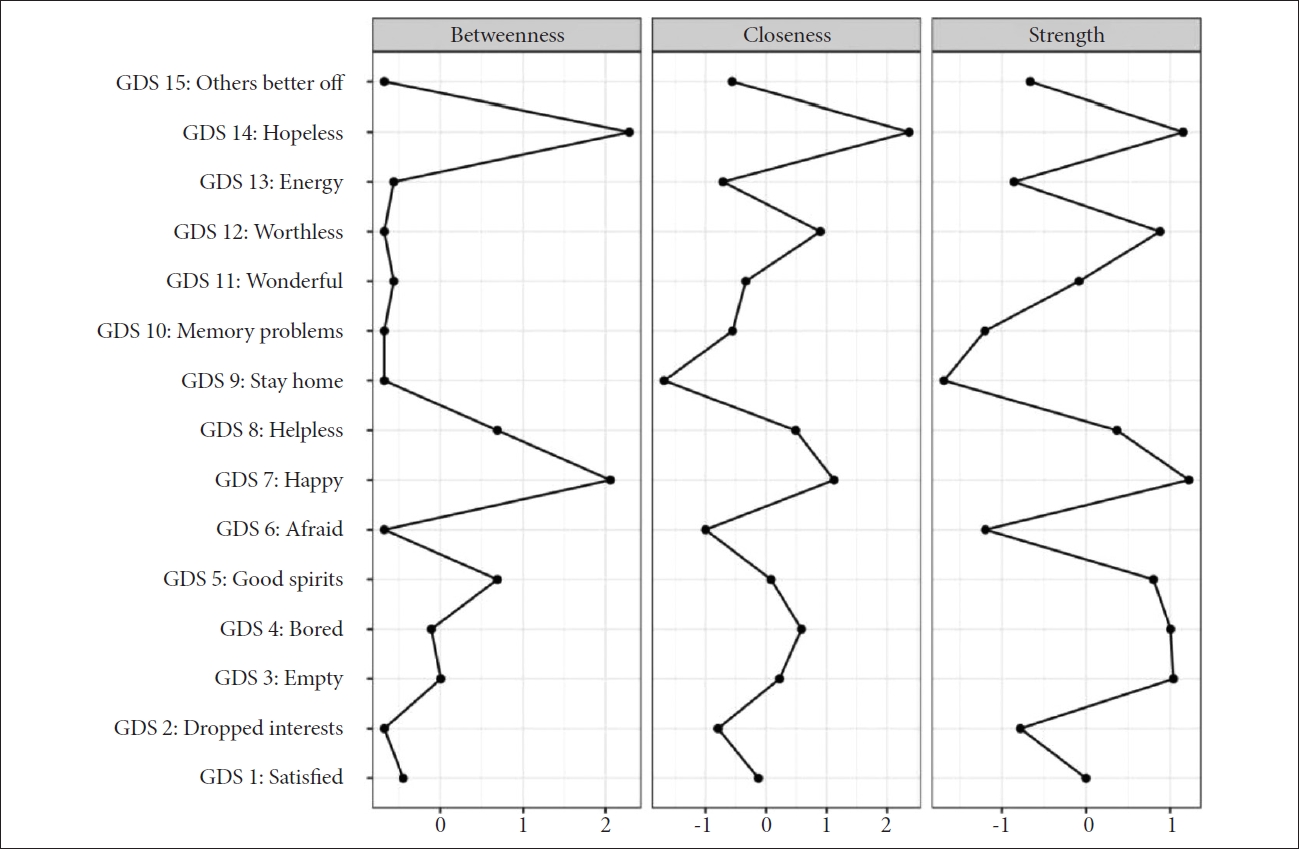
In order to identify which item of GDS reflects the central symptoms of geriatric depression, three centrality indices of betweenness, closeness, and strength were calculated. While betweenness represents the number of shortest paths connecting any two nodes, closeness is calculated as the inverse of the sum of the total length of all the shortest paths between a specific node and the rest of the nodes in the network. Finally, strength centrality indicates the sum of the edge weights of each node [34]. To test the significance of the difference among centrality indices as 95% confidence intervals, we performed bootstrapping 2,500 times. Bootnet 1.2.4 packages in R 3.6.1 (R core team) were utilized for the network estimating and bootstrapping.
IRT
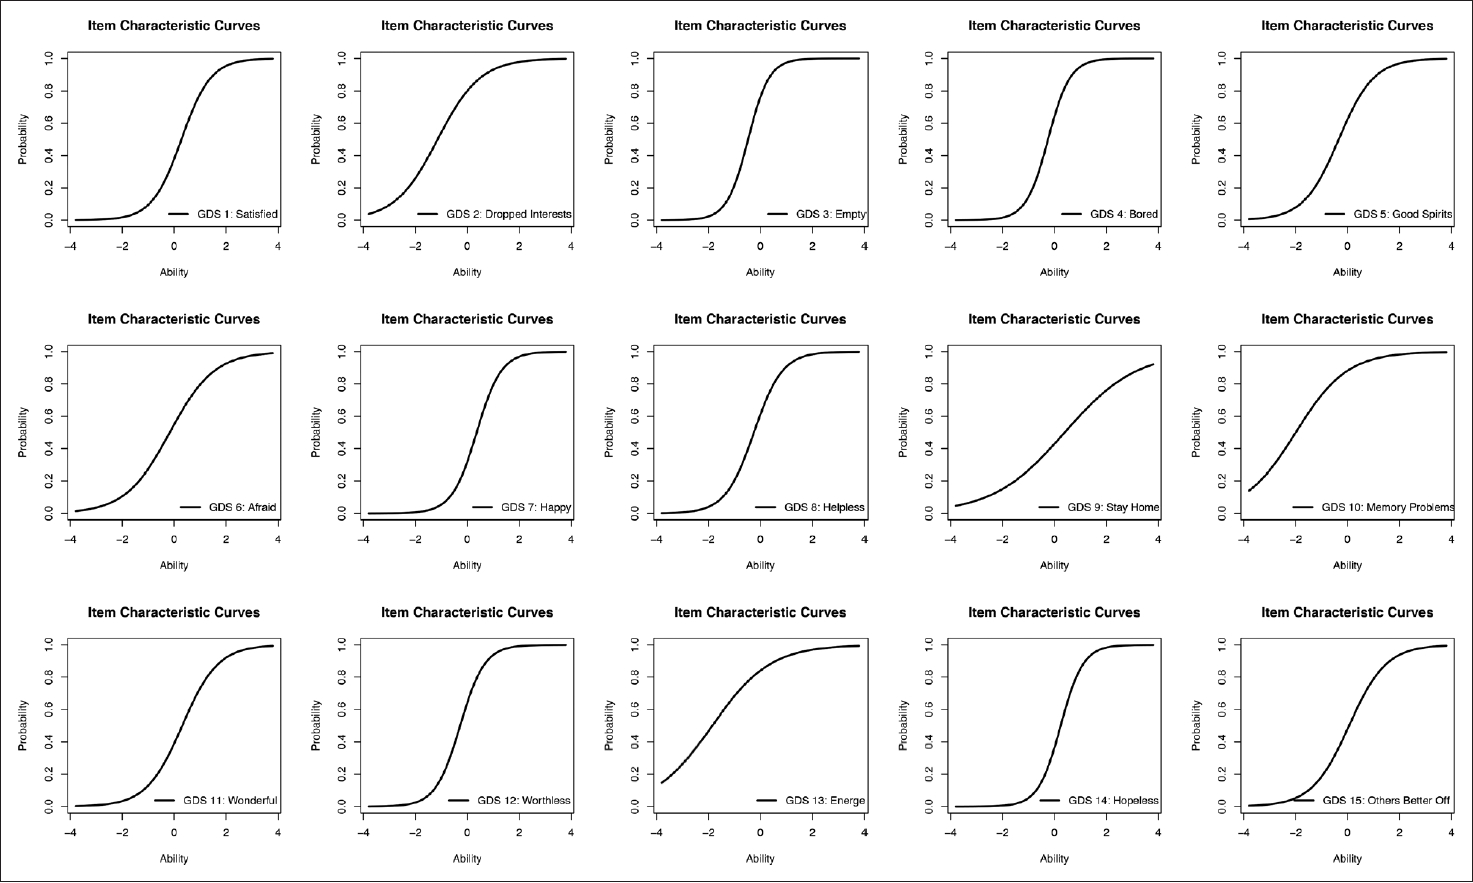
In the IRT analysis, the unidimensional 2PL model was utilized [37]. The item characteristics in the 2PL model are estimated with the discrimination (a) and location (b) parameters. The location parameter indicates the point on the latent trait metric where the probability of endorsing the item is 50%. The range of the location parameter is typically between -2.0 and 2.0 [38]. The discrimination parameter (a) indicates the ability of each item to differentially discriminate among the people responding to the item [18]. For binary scales, a higher value on the discrimination parameter indicates that the probability of a “yes” response in the item increases more sharply as the total scores (latent trait) of the respondent increase. In clinical assessment, the range of values for the discrimination parameter is divided into very low (0.01 to 0.34), low (0.35 to 0.64), moderate (0.65 to 1.34), high (1.35 to 1.69), and very high (1.70 or higher) [39,40]. Finally, the S-shaped Item Characteristic Curve (ICC), which shows the probability of item endorsement (“yes” response) as a function of the respondent’s level of trait, was graphically displayed. IRT analysis was performed by the functions implemented in ltm 1.1.1 R packages (R core team).
RESULTS
Demographic characteristics and presence of depressive symptom
Demographic characteristics of the participants are shown in Table 1. Among the total participants, 2,300 (66.2%) were female. The mean age of participants was 75.20 (7.27) years, and the mean duration of education was 5.24 (4.78) years. Table 1 also shows the number and proportion of participants whose depressive symptom on each GDS item is present. Among the 15 symptoms, “memory problem” (2,935; 84.5%), “energy” (2,806; 80.8%), and “dropped interest” (2,596; 74.8%) ranked the highest in terms of proportion of symptom presence.
Network structure among the GDS items and centrality indices
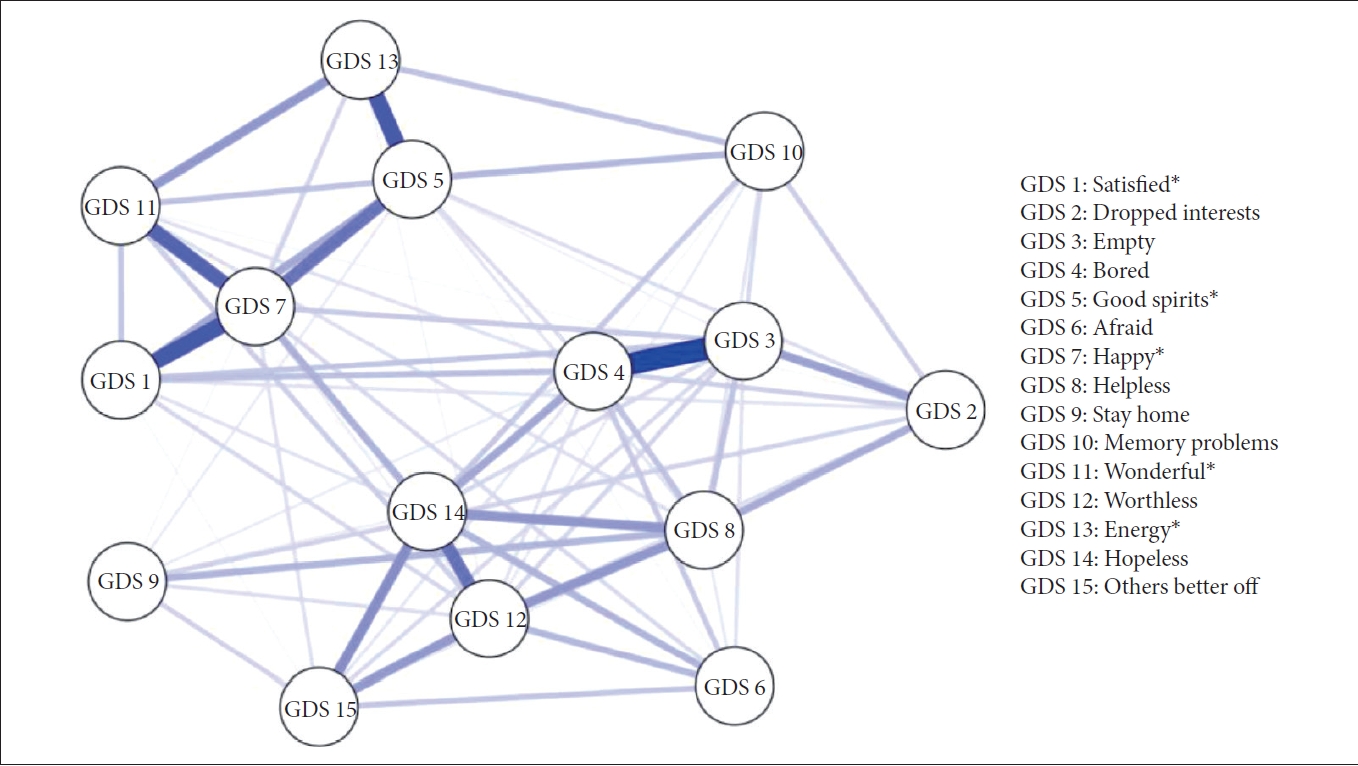
The network structure among the GDS items is presented in Figure 1, and the centrality indices are shown in Figure 2. The differences in the strength centrality among all the symptoms are shown in Supplementary Figure 1 (in the online-only Data Supplement), and the differences in edge weights between any of the two nodes are shown in Supplementary Figure 2 (in the online-only Data Supplement). “Happy,” “Hopeless,” “Empty,” “Bored,” “Worthless,” and “Good spirits” presented significantly higher strength centrality than other nodes of symptoms (Supplementary Figure 1 in the online-only Data Supplement). “Happy,” which had a high betweenness centrality, was also connected with a strong edge to “Satisfied,” “Wonderful,” and “Good spirits.” Among all the edges, the edge between “Empty” and “Bored” was the strongest; however, these two symptoms were connected weakly to other symptoms (Supplementary Figure 2 in the online-only Data Supplement).

Estimated symptom network of depression assessed with the GDS. Circles indicate nodes (GDS item) and lines indicate edges (associations between two symptoms). The thickness of lines represents the weights of the edges. *Positively worded item. GDS, Geriatric Depression Scale.
IRT parameters for each GDS item
Table 2 presents the result of the IRT analysis, and Figure 3 shows the ICCs of IRT analysis. “Empty” presented the highest degree on the discrimination parameter; “Bored,” “Hopeless,” “Worthless,” “Happy,” “Helpless,” and “Satisfied” also presented very high values (1.70 or higher) on the discrimination parameter. “Good spirits,” “Wonderful,” and “Others Better off” presented high values (1.35 to 1.69) on the discrimination parameter. In the location parameter, “Memory problem,” “Energy,” and “Dropped interest” showed the highest value among all the symptoms.
DISCUSSION
The present study investigated the central symptoms of depression in older adults with GDS using symptom network analysis and the IRT. In our study, “Hopeless,” “Empty,” “Happy,” “Bored,” “Worthless,” “Good spirits,” and “Helpless” presented higher degrees of strength centrality than the other symptoms, with the z-scores of strength centrality over zero on strength centrality. This is an interesting finding in that most of the symptoms presenting high scores on strength centrality in this study were similar to those found in a study conducted in the Netherlands [23] in which “Hopeless,” “Empty,” “Happy,” “Worthless,” and “Helpless” also presented z-scores over zero on strength centrality, except for “Bored” and “Good spirits.”
Moreover, some strong edges between two symptom nodes also coincided between our study and the previous one. For instance, the symptom “Happy,” showing a high degree of betweenness and strength centrality, was connected strongly with the symptoms of “Wonderful,” “Satisfied,” and “Good spirits,” with high edge weights in both the studies [21]. In addition, “Helpless” had the second highest score on strength centrality and was connected to the symptoms of “Worthless” and “Hopeless” with a strong edge in the previous study [21]. Our study also found these three symptoms to be aggregated with a strong edge and to have a high strength centrality. These common findings between the two studies imply that the central symptoms constituting the depression faced by older adults are common across cultures.
However, the two studies also have some differences despite the considerable similarities of the network structures of depressive symptoms. The previous study found that “Dropped interest” and “Lack of energy” had high degrees of strength centrality and aggregated in a cluster by a strong edge [21]. In contrast, in our study, these two symptoms did not have a high degree of strength centrality; the edge weight between the two symptoms was also the lowest.” These contrasts may have been caused by cultural differences related to viewpoints of older adults regarding daily activity. Thus, future cross-cultural studies investigating the mechanisms underlying these cultural differences might provide more insight into the depression of older adults.
Our study also employed an IRT analysis, under which “Empty,” “Bored,” “Hopeless,” “Worthless,” “Happy,” “Helpless,” and “Satisfied” presented higher discrimination indices than other symptoms. Most of these symptoms coincided with the symptoms having high degrees of strength centrality in the network analysis. These findings indicate that the symptoms having high scores on discriminant indices also constitute the central symptoms in network analysis.
Parsimonious assessment scales need to be developed for the efficient evaluation of psychopathologies; this will ensure greater compliance with the scale, thereby resulting in fewer skipped or missing items [16,18]. Moreover, considering decreased energy and cognitive function in older adults having depression, the brevity of assessment tools is essential to reduce the respondents’ burden and improve efficiency in the evaluation of geriatric depression [17,41,42]. Based on these necessities, multiple previous studies have developed various brief versions of GDS, including GDS-4, GDS-8, GDS-10, and GDS-5/15 [43-45]. These brief versions of GDS have sought to find the central symptoms from among all the items. The present findings for the central symptoms on geriatric depression from network analysis and IRT may provide important information enabling construction of efficient assessment tools. In addition, previous studies of symptom networks in psychiatric disorders reported that central symptoms are major treatment targets for efficient and effective intervention and are capable of predicting the prognosis of treatments [46,47]. Thus, our findings may contribute to a more effective intervention by targeting the central symptoms in the treatment of geriatric depression.
In addition, our findings from IRT analysis are comparable with those of a previous study conducted in Italy [48]. The symptoms presenting high scores on the discrimination index in our study—“Hopeless,” “Empty,” “Happy,” “Bored,” “Worthless,” “Good spirits,” “Helpless,” and “Satisfied”—also showed a high degree of discrimination in the study conducted in Italy [48], except the symptom of “Helpless.” Moreover, “Empty” presented the highest degree on the discrimination index in both the studies. These findings indicate that the centrality of symptoms listed in the GDS is generally common across cultures. However, there was also a difference between the two studies; while the discrimination index of “Energy” was relatively low in our study, it presented a high score in the other study [48]. This difference might be associated with cultural differences in the recognition of the daily activities of older adults, similar to the cultural differences found in the findings of the network analysis; this warrants future studies of cross-cultural comparison.
Limitations
Our study has some limitations that should be noted. First, depression is a heterogeneous mental disorder in terms of its clinical presentation, biological contributors, and treatment response; furthermore, it has a variety of symptom presentations including cognitive (e.g., worthlessness, suicidal ideation), emotional (e.g., anhedonia, depressed mood), and physical (e.g., insomnia, appetite, fatigue) symptoms, as well as social aspects (e.g., social withdrawal) [6,15]. For instance, the DSM-5 lists nine symptoms, which are psychologically distinct from one another, as the diagnostic criteria of depression (depressed mood, diminished interest, weight change, sleep problems, psychomotor agitation or retardation, worthlessness or guilt, cognitive function impairment, and suicidal ideation) [49]. Moreover, Fried [50] found 52 disparate symptoms to be encompassed in seven widely used rating scales for depression. However, GDS did not reflect these widely varied symptoms of depression. GDS-15 has been reported to be unidimensional. Moreover, the items included in GDS-15 have been reported to have substantial redundancy [17]. While the brevity of GDS-15 could improve the efficiency of screening for depression in older adults, it is difficult to understand the complex interactions among the various symptoms existing in geriatric depression using the scale. Thus, future studies employing assessment tools that include information on the various symptoms of depression (e.g., fatigue, appetite, irritability, sleep) are needed [15]. Second, cognitive impairment is very common and comorbid with depression in old age [51]. Previous studies on the differential item functioning analysis of items of GDS-15 have suggested that GDS functions similarly among people with and without cognitive impairment [52,53]. Nevertheless, it is possible that the symptom characteristics of depression differ based on the presence of cognitive impairment. However, our study did not consider the factor of cognitive function; hence, future studies should consider the aspect of cognitive function to confirm the present findings in subgroups of older adults with or without cognitive dysfunction.
In conclusion, our study identified the central symptoms of depression and the network structures among the individual symptoms of depression using network analysis and IRT of GDS-15 in older adults. The central symptoms of “Hopeless,” “Empty,” “Unhappy,” “Bored,” “Worthless,” “Bad spirits,” “Helpless,” and “Satisfied” were identified in the network analysis; these symptoms also presented a high degree of discrimination index in the IRT analysis. The present identification of the central symptoms in the depression of elderly adults may provide information for constructing more efficient assessment tools or targeting central symptoms in the treatment of geriatric depression. Our findings also showed high similarities with previous studies conducted in Western communities. Future studies should include information on a wider set of depression symptoms for an individualized understanding of depression in older adults.
Supplementary Materials
The online-only Data Supplement is available with this article at https://doi.org/10.30773/pi.2021.0453.
Bootstrapped difference tests (α=0.05) between node strength of GDS items. Gray color indicates nodes that do not differ significantly from one another, whereas black color indicates nodes that do differ significantly from one another. The values in the diagonal elements represent node strength. GDS, Geriatric Depression Scale.
Bootstrapped difference tests (α=0.05) between edge weights that were non-zero in the estimated network. Gray color indicates nodes that do not differ significantly from one another, while black color indicates nodes that do differ significantly from one another.
Notes
Availability of Data and Material
The datasets generated or analyzed during the study are available from the corresponding author on reasonable request.
The authors have no potential conflicts of interest to disclose.
Author Contributions
Conceptualization: all authors. Data curation: Dohyun Kim, Jung Jae Lee. Formal analysis: Kyoung Min Kim, Dohyun Kim. Investigation: Dohyun Kim, Jung Jae Lee. Methodology: Kyoung Min Kim, Dohyun Kim. Project administration: Jung Jae Lee. Resources: Jung Jae Lee. Software: Kyoung Min Kim, Dohyun Kim. Supervision: Un Sun Chung, Jung Jae Lee. Validation: all authors. Visualization: Kyoung Min Kim, Dohyun Kim. Writing—original draft: Kyoung Min Kim, Dohyun Kim. Writing—review & editing: all authors.
Funding Statement
None


