Predictors of Developmental Outcome in 4- to 6-Year-Olds With Developmental Disability
Article information
Abstract
Objective
Studies on the early trajectories of developmental disability (DD) are limited. This study aimed to evaluate the diagnostic stability and developmental trajectories of autism spectrum disorder (ASD) and intellectual disability (ID), and to determine baseline clinical characteristics that affect future diagnosis.
Methods
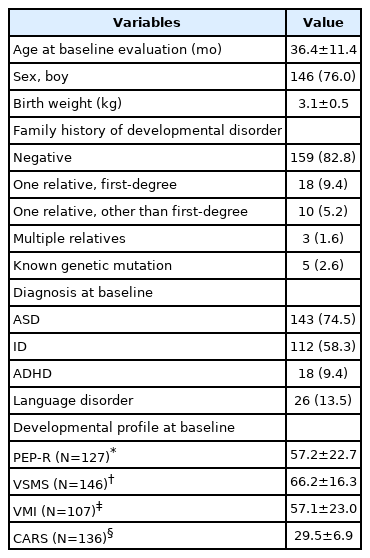
We analyzed 192 children who were referred for possible DD through retrospective chart review. Clinical diagnosis was assessed once at baseline, aged 2–4, and at follow-up, aged 4–6. The participants’ developmental profiles were measured by Psychoeducational Profile-Revised (PEP-R), Vineland Social Maturity Scale (VSMS), Beery-Buktenica Developmental Test of Visual Motor Integration (VMI), and Childhood Autism Rating Scale (CARS).
Results
On comparing the diagnostic change, 5% of children were no longer diagnosed as ASD, and 13% of children were no longer diagnosed as ID at follow-up. Trajectories of developmental profiles were compared between children with and without ID at follow-up, and significant time-by-group interaction were observed in PEP-R (p<0.001), VSMS (p<0.001), and VMI (p=0.003) scores, indicating that children without ID at follow-up showed significant improvement over time compared to children with ID. ASD diagnosis (p<0.001) and CARS score (p=0.007) at baseline were significantly associated with ASD at follow-up, while VSMS score (p=0.004) and VMI score (p=0.019) at baseline were significantly associated with ID at follow-up.
Conclusion
A subset of children lost their diagnosis at follow-up, and such diagnostic change was significantly more common in ID compared to ASD. Baseline autism symptomatology was related to ASD at follow-up, and baseline adaptive and visuo-motor function was related to ID at follow-up.
INTRODUCTION
Developmental disability (DD) refers to diverse group of conditions which show impairment in physical or cognitive development. DDs include autism spectrum disorder (ASD) and intellectual disability (ID), both of which are categorized under neurodevelopmental disorders in the International Classification of Diseases Eleventh Revision (ICD-11) [1] and the Diagnostic and Statistical Manual of Mental Disorders, Fifth Edition (DSM-5) [2]. According to ICD-11 and DSM-5, ASD is characterized by deficits in social interaction and communication, and restricted and repetitive patterns of behavior. Likewise, ID is characterized by deficits in intellectual and adaptive functioning that originate during the developmental period, confirmed by clinical assessment and standardized tests [3].
National Health Interview Survey in US from 2009 to 2017 reported a 122.3% increase in ASD diagnosis and 25.8% increase in ID diagnosis [4]. With the increasing prevalence rate of DDs, early detection and intervention is of paramount importance. For example, the symptoms of ASD can manifest as early as 12 to 24 months [5], and up to half of children with ASD were symptomatic at 24 months of age [6]. Early diagnosis leads to early intervention, which is important in that more improvements are observed in younger children [7,8].
Despite increased recognition for early detection and intervention in DDs, the longitudinal trajectories of DDs are less clear. In ASD, symptoms are known to be relatively stable, but recent studies indicate that a minority of patients undergo improvements in core symptoms during childhood [9,10]. The proportion of patients from a diverse cohort of children that improve varies from 5% to 27% [11,12]. Specifically, 5% of children did not reach the Autism Diagnostic Observation Schedule (ADOS) autism threshold when followed until adulthood [13], 11% of the 2-to 6-year old children showed improving trajectory [14], 25% of 14- to 36-month children exhibited moderate improvement [15], and 27% of the 41-month to 10-year-old cohort showed continuous improvement based on ADOS Calibrated Severity Scores (CSS) [16]. On the other hand, in a meta-analysis that assessed symptom trajectories of ID in subjects older than 8, it was found that the patients’ full-scale intellectual quotient (FSIQ) remained relatively stable, except in 14% of subjects whose FSIQ changed by 10 points or more [17]. In syndromic forms of ID, previous study reported that cognitive decline was evident between ages 8–24 years [18]. Declines in cognitive function were found in genetic disorders such as Fragile X syndrome, Down syndrome, and Williams syndrome, but not in others [19].
Literature indicates that a subset of children shows different trajectory compared to others, but distinguishing risk factors that affect future symptoms are challenging. Known predictors for persistent ASD symptoms include female sex, lower IQ, more severe autism symptoms, and poor language skills [13,14,20-22]. As for ID, limited study explored clinical characteristics that affect symptom trajectories. Available longitudinal studies described that developmental status at childhood was a predictor of developmental status at young adulthood [23], while sex or socioeconomic status was not [24].
Although the mean age for the first visit is decreasing, and although predicting developmental trajectory is important, studies addressing the early trajectories of DD are limited. To address the gap in the literature, we aimed to evaluate the diagnostic stability of ASD and ID over time in preschool children. In addition, we aimed to assess symptom trajectories based on diagnosis, and searched for baseline clinical characteristics that affect future diagnosis.
METHODS
Participants and procedure
We retrospectively reviewed the electronic medical records of children who visited Department of Child and Adolescent Psychiatry at Asan Medical Center in Seoul, Korea, from June 2008 to June 2016. Asan Medical Center is one of the largest tertiary hospital in Korea, and referral from primary physicians is mandatory in order to visit the clinic. Children who were referred for possible DD between age 2 and 4 years, and who were assessed with relevant psychological tests were reviewed. Only the children who received psychological tests at least twice were included, resulting in a total of 192 children.
Psychiatric diagnoses were confirmed retrospectively based on the electronic medical records and psychological tests by experienced child and adolescent psychiatrists. Electronic medical records included detailed descriptions based on the Diagnostic and Statistical Manual of Mental Disorders, Fourth Edition (DSM-IV) or DSM-5 [2]. Information acquired from psychological tests was also referred to, but the diagnosis was established mainly clinically, on the basis of DSM-IV or DSM-5. A consensus meeting was held to confirm the diagnosis when the results were equivocal. Children with ID could be concurrently diagnosed with ASD. Diagnoses were assessed once at baseline, which was between ages 2 and 4, and at follow-up, which was between ages 4 and 6. Demographic and clinical characteristics such as age at baseline evaluation, sex, birth weight, family history of DD and known genetic mutation were retrospectively obtained through electronic medical chart review. The study was approved by the Institutional Review Board (IRB) for human subjects at the Asan Medical Center, University of Ulsan College of Medicine (no. 2018-0530).
Assessments and measures
Developmental profiles were assessed by relevant psychological tests. Psychoeducational Profile-Revised (PEP-R) [25], originally designed for children with autism, was used to measure developmental age of the children. Developmental age was then converted to developmental quotient ([developmental age/chronological age]×100). In addition, Vineland Social Maturity Scale (VSMS) was administered [26], which estimates various areas of personal and social functioning in children. Social age was obtained, and social quotient was calculated ([social age/chronological age]×100). Beery-Buktenica Developmental Test of Visual Motor Integration (VMI) consists of a series of line drawings which tests the ability to coordinate visual and motor abilities [27]. Raw VMI scores were transformed into standardized scores which have a mean of 100 and a standard deviation of 15. Childhood Autism Rating Scale (CARS) was administered to measure autism symptomatology, and the total score was used for analysis [28]. CARS consists of 15 items with score range from 1 to for, where higher score indicate worse severity.
Statistical analysis
The univariate random coefficients model was used to determine whether change of developmental profiles over time differed significantly according to the presence of ASD or ID diagnosis at age follow-up. The results were illustrated as a time-score plot, where the growth of each developmental profiles was shown. Subsequently, the multivariable random coefficients model was fitted by including time, diagnosis at follow-up, family history, and birth weight as fixed effects and patient and interaction between patient and time as random effects. Interaction term between time and covariates were included as fixed effects if it was significant in the univariate model. Finally, multivariable logistic regression model using backward elimination was built to identify variables that were associated with ASD or ID diagnosis at follow-up. All statistical analyses were performed using the Statistical Analysis System (SAS), version 9.4 (SAS Institute, Cary, NC, USA).
RESULTS
Demographic and clinical characteristics of the children are shown in Table 1. A total of 192 children (146 boys, 76.0%) were included in this study. The mean age at baseline evaluation was 36.4±11.4 months and mean birth weight was 3.1± 0.5 kg. Family history of psychiatric disorder was observed in 16.1% (n=31) of the total children. Known genetic mutation was observed in five children (2.6%), which included Down syndrome (n=1), Prader–Willi syndrome (n=1), fragile X syndrome (n=1), chromosomal translocation t(11;18) (q24.2;q21.3) (n=1), and Tetrasomy 15q (n=1). A total of 143 children were diagnosed with ASD, 112 with ID, and 96 with both ASD and ID.
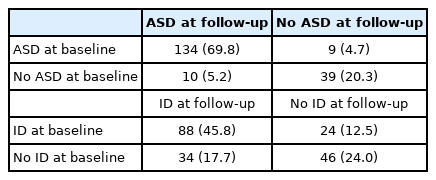
Change of diagnosis at baseline and follow-up are presented in Table 2. There were 134 children (69.8%) who had stable diagnosis of ASD at baseline and at follow-up. Meanwhile, 9 children (4.7%) who were initially diagnosed as ASD were no longer diagnosed as ASD at follow-up, and 10 children (5.2%) who were not diagnosed as ASD at baseline were newly diagnosed as ASD at follow-up. As for ID, 88 children (45.8%) had a stable diagnosis of ID at baseline and at follow-up. Meanwhile, 24 children (12.5%) who were initially diagnosed as ID were no longer diagnosed as ID at age follow-up, and 34 children (17.7%) who were not diagnosed as ID at baseline were newly diagnosed as ID at follow-up. When compared to ASD, ID diagnosis at baseline showed more frequent improvement at follow-up (ASD 4.7% and ID 12.5%, p=0.005; McNemar’s test).
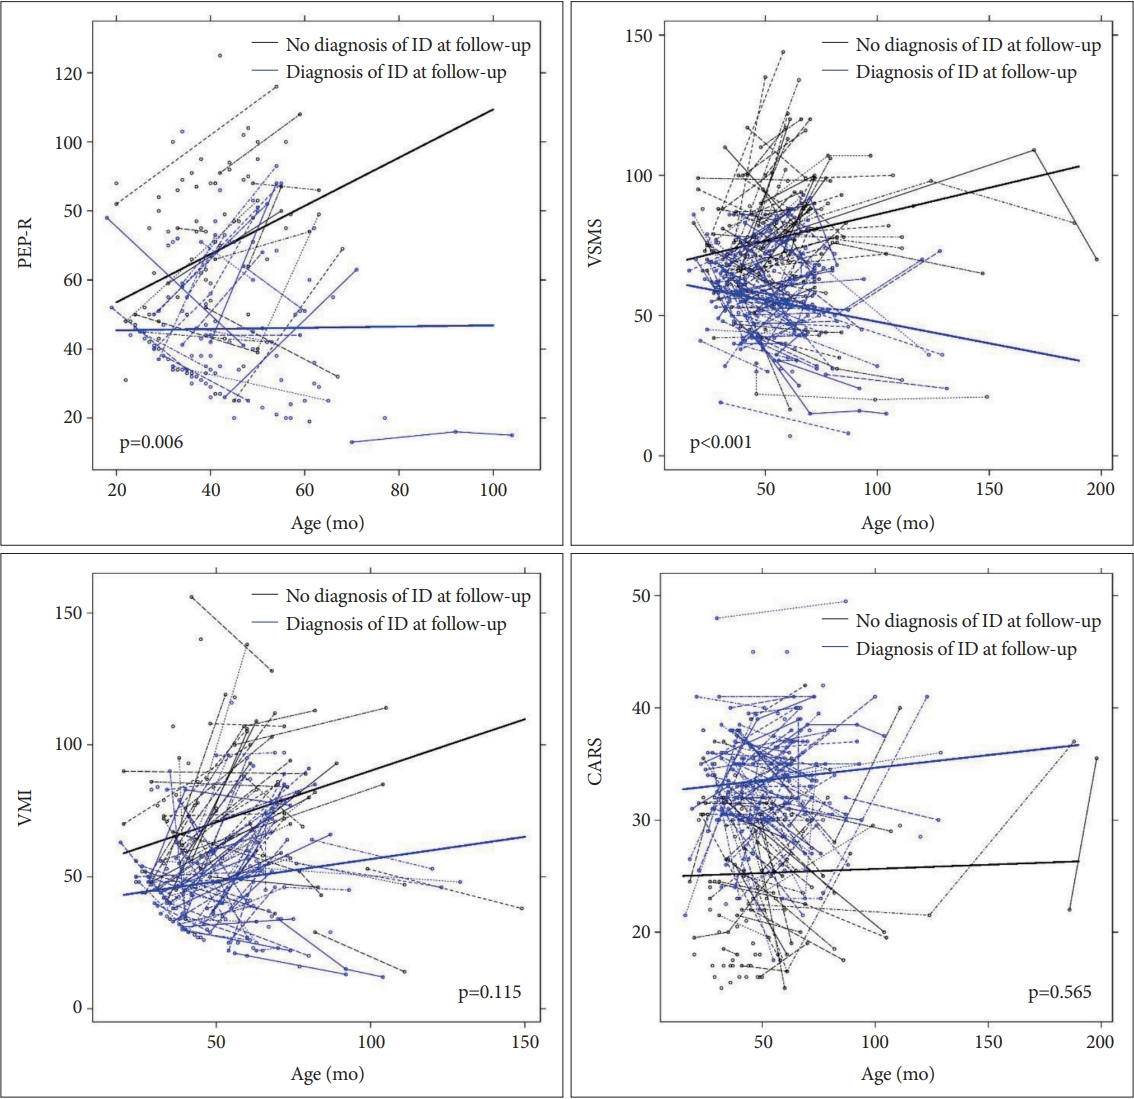
Trajectories of developmental profiles over time according to ID diagnosis at follow-up are illustrated in Figure 1. The change of PEP-R, VSMS and VMI scores over time were significantly different between the ID and the non-ID group (time-by-group interaction p-value; p<0.001, p<0.001, and p=0.004, respectively). The change of CARS score over time did not show significant difference between the ID and the non-ID group (p=0.185). When the trajectories of PEP-R, VSMS, VMI and CARS scores over time were compared according to ASD diagnosis at follow-up, no significant differences were observed between the ASD and the non-ASD group (time-by-group interaction p-value; p=0.121, p=0.363, p=0.623, and p=0.818, respectively).

Trajectory of developmental profiles in children with and without ID at follow-up. Time-by-group p-values are presented in the figure. PEP-R, Psychoeducational Profile-Revised; VSMS, Vineland Social Maturity Scale; VMI, Beery-Buktenica Developmental Test of Visual Motor Integration; CARS, Childhood Autism Rating Scale; ID, intellectual disability.
As shown in Table 3, multivariable random coefficients model was built for each of the developmental profiles. Family history of DD, birth weight, ASD diagnosis at follow-up, ID diagnosis at follow-up, and time were included as an independent variable. Significant time-by-group interaction between ID and non-ID group was observed in PEP-R, VSMS, and VMI scores (p<0.001, p<0.001, and p=0.003, respectively). When separate model was built, the presence of ASD diagnosis at follow-up had no significant time-by-group interaction in PEP-R, VSMS, VMI, and CARS scores.
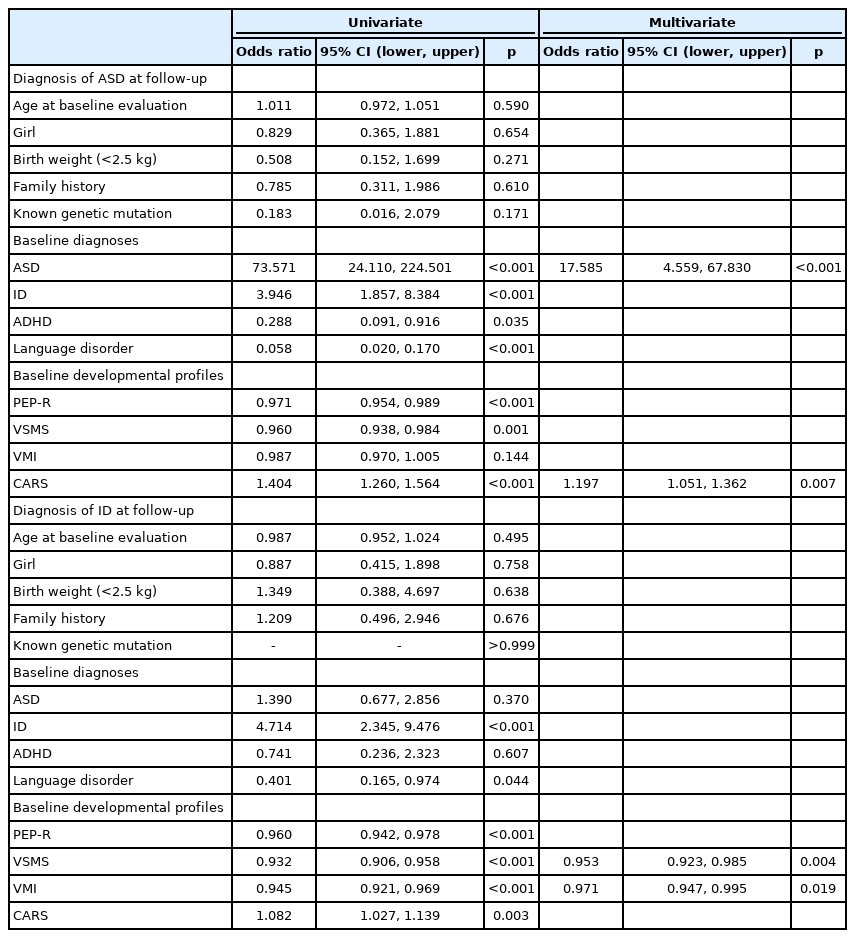
Table 4 displays the results of logistic regression analysis for predicting diagnosis at follow-up. In the univariate analysis for predicting ASD at follow-up, diagnosis of ASD, ID, attention-deficit/hyperactivity disorder (ADHD), and language disorder at baseline (p<0.001, p<0.001, p=0.035, and p<0.001, respectively) and PEP-R, VSMS, and CARS scores at baseline (p<0.001, p=0.001, and p<0.001, respectively) showed significant association. In contrast, the age at baseline evaluation, sex, birth weight, family history, presence of known genetic mutation, and VMI score at baseline did not show a significant association. In the final multivariate model, ASD diagnosis at baseline and CARS score at baseline were significantly associated with ASD at follow-up (OR, 17.59; 95% confidence interval [CI], 4.56 to 67.83; p<0.001 and OR 1.20; 95% CI, 1.05 to 1.36; p=0.007, respectively). The same independent variables and modeling were used for predicting ID diagnosis at follow-up. In the univariate analysis, diagnosis of ID and language disorder at baseline (p<0.001, p=0.044), PEP-R, VSMS, VMI, and CARS scores at baseline (p<0.001, p<0.001, p<0.001, and p=0.003, respectively) were significantly associated with ID at follow-up. In contrast, age at baseline evaluation, sex, birth weight, family history, presence of known genetic mutation, and diagnosis of ASD and ADHD at baseline did not show significant association. In the final multivariate model, VSMS and VMI scores at baseline were significantly associated with ID at follow-up (p=0.004 and p=0.019, respectively).
DISCUSSION
We investigated the early childhood trajectories of DD in a clinical sample of children by retrospective chart review. A majority of ASD and ID diagnosis were stable, but a subset of children no longer fulfilled the diagnostic criteria at follow-up. Changes in developmental profiles were assessed according to the presence of diagnosis at follow-up. Children without ID at follow-up exhibited significant improvement over time in PEP-R, VSMS, and VMI scores compared to children with ID at follow-up. On the other hand, both children with ASD and without ASD at follow-up did not show significant difference in PEP-R, VSMS, VMI, and CARS scores over time. Variables that predicted diagnosis of ASD at follow-up included baseline diagnosis of ASD and baseline CARS score, while diagnosis of ID at follow-up were predicted by baseline VSMS and VMI scores.
On assessing the diagnostic stability, we found that 70% of ASD and 46% of ID diagnosis remained stable. However, we noted that 5% of children were no longer diagnosed as ASD at follow-up, and 13% of children were no longer diagnosed as ID at follow-up. The proportion of children who lost their diagnosis in our study are comparable to studies that assessed clinical diagnosis, where 3% to 5% of children received nonspectrum diagnosis during follow-up [13,29]. We note that a change in diagnosis can be a conservative measure of improvement, considering that 20% to 30% of these patients show improving trend on ADOS CSS [15,16]. As for ID, the diagnosis is known to be stable over a lifetime. In a meta-analysis conducted in patients with mild ID, the mean correlation coefficient for FSIQ was 0.82 during a 3-year follow-up period [17]. However, studies that assessed the diagnostic change of ID before the age of 6 are limited. In a study conducted in children with ID, the correlation coefficient for FSIQ was 0.67 between 48 months and 91 months of age [30], suggesting larger variability of intellectual abilities in younger children [31]. Our study indicates that in younger children, a diagnosis of ID may undergo more than twice as many changes compared to ASD. It is possible that children diagnosed with ID between ages 2 and 4 can improve intellectually and adaptively over time, but it may also be that the assessment made in younger children are inaccurate and are false positives. Considering that diagnosis in our study was based on a retrospective chart review, further verification is essential in a prospective cohort of children where the diagnosis is more reliable and valid.
In this study, children without ID at follow-up showed improvement of developmental profiles over time, compared to children with ID at follow-up. The improved developmental profiles included PEP-R, VSMS, and VMI, which measures developmental age, adaptive function and visual-motor skill, respectively. Generally, stability of IQ is known to be high in school-age children with normal development [32]. Similarly, children with ID showed high correlation (r=0.7) between IQ measured at 49 months and 88 months of age [30]. However, previous studies were limited to older children, and did not assess measures other than IQ. Our results suggest that in children before age of 6, a subgroup of children’s cognitive and adaptive function may improve, and that children who present with ID at age 2 may not be a single homogenous group who have stable trajectory.
Given that the diagnosis at follow-up may influence developmental trajectory, we sought to investigate baseline clinical variables that was associated with diagnosis at follow-up. In the multivariate analysis, baseline VSMS and VMI scores, rather than baseline diagnosis of ID, were significantly associated with ID diagnosis at follow-up, indicating that the extent of impairment in cognitive and adaptive function at baseline may be important in predicting ID diagnosis at follow-up. Previous studies reported that when IQ was lower, IQ was more stable, supporting the findings from our study [17,33]. The association between developmental profile scores and future ID diagnosis suggests that measuring the specific extent of adaptive functioning and visual-motor skill at young age can have more implications than merely assessing clinical diagnosis at that moment.
As for ASD, baseline diagnosis of ASD and baseline CARS score were significantly associated with diagnosis of ASD at follow-up, suggesting that factors that influence follow-up diagnosis is different between ASD and ID. Odds ratio from the univariate analysis and survival of ASD and CARS score in the multivariate analysis suggest that autism symptomatology at baseline is more important than other variables in predicting future ASD diagnosis. This finding is in agreement with the high diagnostic stability of ASD reported in this study and previous studies [13,29]. We note that, this does not necessarily mean that cognitive functioning at baseline is unrelated to ASD diagnosis at follow-up, considering the significant association of baseline PEP-R and VSMS scores with ASD diagnosis at follow-up in the univariate analysis. Moreover, previous results indicate that children with improved ASD symptom had higher IQ than children without [22,34].
Potential limitations of our study need to be addressed. First, this study was based on a single tertiary hospital, and thus may not represent a sample from a general population. Moreover, children who were assessed at least twice were included, which may lead to a bias in the sample. Second, the sample size of 192 is modest compared to previous studies which assessed developmental trajectory of DDs such as ASD. Third, a retrospective chart review was conducted. Therefore, the child could not be observed directly, and the caregivers could not be questioned to gather relevant information on the child. This may have resulted in decreased accuracy of the diagnosis. In addition, developmental profiles were assessed as a part of clinical procedure, and were not based on systematic research protocols, which led to variability in the type and number of tests administered. Fourth, developmental profiles were also utilized when establishing a diagnosis, which could have an impact on the study results. Fifth, information on therapeutic interventions was not available, which could have a profound impact on the developmental outcome of the children.
Despite these caveats, the strengths of our study come from the assessment of developmental trajectory in young children with DD. In addition to the developmental profiles assessed, a clinical evaluation and diagnosis was done by experienced child and adolescent psychiatrists, allowing to explore factors associated with diagnosis between age 4 and 6.
In conclusion, our results highlight that while a majority of ASD and ID diagnosis are stable, a minority of children lose their clinical diagnosis during the follow-up period. Initial diagnosis of ASD between age 2 and 4 showed higher stability than ID diagnosis, indicating that ID diagnosis are subject to more change as a child grows up. Baseline autism symptomatology was associated with ASD at follow-up, and baseline adaptive and visuo-motor function was associated with ID at follow-up.
Notes
Availability of Data and Material
The datasets generated or analyzed during the study are available from the corresponding author on reasonable request.
Conflicts of Interest
The authors have no potential conflicts of interest to disclose.
Author Contributions
Conceptualization: Hyo-Won Kim. Data curation: Kee Jeong Park, Seung-Hyun Shon. Formal analysis: Seonok Kim, Taeyeop Lee. Funding acquisition: Hyo-Won Kim. Methodology: Taeyeop Lee, Seonok Kim. Project administration: Hyo-Won Kim. Resources: Hyo-Won Kim. Software: Taeyeop Lee, Kee Jeong Park, Seonok Kim. Supervision: Hyo-Won Kim. Validation: Hyo-Won Kim. Visualization: Taeyeop Lee, Kee Jeong Park, Seonok Kim. Writing—original draft: Taeyeop Lee, Kee Jeong Park. Writing—review & editing: Hyo-Won Kim.
Funding Statement
This work was supported by the National Research Foundation of Korea (NRF) grant funded by the Ministry of Science and ICT (NRF2020R1A5A8017671).


