Investigation of the Relationship Between Cognitive Functions and Retinal Findings From Spectral Optical Coherence Tomography in Patients With Schizophrenia and Their Healthy Siblings
Article information

Abstract
Objective
Retinal structural changes which were investigated by optical coherence tomography (OCT) have been reported in schizophrenia. Since cognitive dysfunction is a core feature of schizophrenia, the correlations between retinal findings and cognitive functions of patients and their healthy siblings may provide insight into the pathophysiological processes of the disorder. We aimed to investigate the relationship between neuropsychiatric tests and retinal changes in schizophrenia patients and their healthy siblings.
Methods
We measured OCT parameters and cognitive performance (via Trail Making Tests, verbal fluency tests, and The Digit Span Tests) of 72 participants (36 patients with schizophrenia and 36 healthy siblings) and disease severity (with Positive and Negative Syndrome Scale, Global Assessment of Functioning, and Clinical Global Impression scales) in patients with schizophrenia and evaluated the relationship between retinal findings and clinical parameters, especially neurocognitive tests.
Results
We found decreased ganglion cell layer-inner plexiform layer thickness and macular volume in the patient group. There were strong correlations between neurocognitive tests and OCT findings in both groups. On the other hand, there was not any correlation between retinal findings and disease parameters.
Conclusion
The cognitive symptoms of schizophrenia may be more closely related to structural changes in the retina.
INTRODUCTION
Despite a great number of research, our knowledge of the molecular pathways of schizophrenia pathophysiology remains unclear. Nevertheless, numerous structural changes such as gray matter and total brain volume decreases, reductions in the anterior cingulate cortex, corpus callosum, thalamus, and hippocampus volumes, enlargement of the lateral ventricles that were shown by neuroimaging studies suggest that biological changes at structural levels start at the earliest stages of the disease [1,2]. These changes were correlated with deterioration in neurocognitive tests, mainly executive functions, attention, and verbal memory [3,4]. Additionally, these structural (especially gray matter loss) and cognitive alterations have been demonstrated in every phase of disease, such as both in patients with chronic schizophrenia, first episode of psychosis, prodromal stage of psychosis, and even in individuals with a high genetic risk for schizophrenia [5-7]. These findings make many researchers consider that schizophrenia is not only neurodegenerative but also a neurodevelopmental disease that begins long before the onset of clinical manifestations and that core cognitive deficits are the consequences of an abnormal development of the brain, leading to cognitive dysfunctions.
The retina, which is the only part of the central nervous system that allows examining with the naked eye, emerges from the forebrain ectodermal tissue during neurodevelopment, later becomes a part of the eye, and therefore it is referred to as “a window into the brain.” Optical coherence tomography (OCT) is a noninvasive, fast imaging technique that provides high-resolution and cross-sectional images of the retina. There are no contraindications to OCT, which measures specific retinal structures such as peripapillary retinal nerve fiber layer (RNFL, axon layer of retinal ganglion cells), peripapillary ganglion cell layer (GCL, bodies of ganglion cells), and inner plexiform layer (IPL, synaptic connections between the axons of bipolar cells and dendrites of ganglion cells). There is growing evidence suggesting that retinal abnormalities may be present in psychiatric disorders. Visual impairments including poor visual acuity, cataracts, strabismus, nystagmus, retinal venulae widening, various retinopathies and maculopathies, and dopamine and glutamate abnormalities in the retina are also important features of schizophrenia and could serve to define the disease state [8]. In recent years, several studies have assessed retinal findings of patients with schizophrenia by using OCT and showed a significant deterioration in overall and different quadrants of RNFL thickness and macular volume (MV) [9-11]. The studies also demonstrated the inverse correlation between layer thickness and disease characteristics, including disease duration, symptom severity, and the number of hospitalizations [10,12]. Additionally, negative symptom severity was found to be related to outer nuclear layer and inner segment layer thinning in multiple regions [13].
Additionally, there are studies that investigated cognitive performance in relation to retinal thickness. Recently, a prospective analysis of participants from the UK aged 40–69 years without neurodegenerative disease, determined that thinning of specific retinal segments was related to worse cognitive functioning, and greater likelihood of future cognitive decline. Since cognitive dysfunction is a core feature of schizophrenia, the correlation with retinal findings and cognitive functions may contribute to a better understanding of some neurodevelopmental aberrations in the disorder [14]. Liu et al. [15] found the reduction of the RNFL was significantly correlated with the impairments of immediate memory and visuospatial function in schizophrenia patients.
There are limited number of studies that assessed retinal layer changes in unaffected siblings of schizophrenia patients and no previous study examined the correlation of cognitive functions of the healthy siblings with retinal findings. Here, we present the first study to our knowledge, comparing the patients with schizophrenia and their unaffected siblings in terms of the relationship between retinal layer thicknesses and cognitive decline. We hypothesized that the relationship between retinal changes and cognitive parameters would be stronger in both patients and their healthy siblings, decisively.
METHODS
Research design and participants
Seventy-two participants were enrolled in the study: 36 patients fulfilling the criteria of schizophrenia according to the Diagnostic and Statistical Manual of Mental Disorders-5th edition (DSM-5) [16] and their 36 healthy siblings. Schizophrenia patients who were followed up and treated in the community mental health center (institutions where patients with chronic and disabling psychiatric disorders such as schizophrenia and other psychotic disorders are regularly treated in Türkiye) were invited with their siblings after obtaining their consent. For patients, the inclusion criteria were fulfilment of the DSM-5 criteria for schizophrenia, being between the ages of 18 and 50 years, being able to read and write, and having fasting blood glucose levels and blood pressure within the normal range. The patients with ophthalmic diseases (e.g., glaucoma, age-related macular degeneration, degenerative myopia, cataract, corneal leukoma, or vitreous hemorrhage) and diseases affecting the retina such as any type of diabetes mellitus, high blood pressure, epilepsy, or history of serious head injury were not included to study sample. Also, a history of comorbid mental retardation or pervasive developmental disorder, any evidence of active substance or alcohol use, and currently receiving electroconvulsive therapy (ECT) were taken as exclusion criteria to prevent confounding factors on neurocognitive functioning. We used the same inclusion criteria for the siblings as well, only excluding the first criterion (i.e., meeting diagnostic criteria for schizophrenia). Similarly, we used the same exclusion criteria that we used for the patient group for the siblings as well, with only taking out the last criterion (i.e., currently receiving ECT). Also, we added having any psychiatric disease to the exclusion criteria.
All respondents provided informed consent at the beginning of the survey by confirming their willingness to participate in this study. The study has been approved by the Ethics Committee of Marmara University Faculty of Medicine with the document number 2021/291 and has therefore been performed in accordance with the ethical standards laid down in the 1964 Declaration of Helsinki and its later amendments [17].
Sociodemographic and clinical variables
Participants were questioned for age, gender, education, working situation, comorbid psychiatric or physical diseases, history of suicide attempt or ECT, body mass index (BMI), family history for psychiatric disorders, and alcohol, substance, or tobacco use. The patient group was also questioned for age at onset, duration of untreated psychosis and medications.
Psychiatric and neurocognitive assessments
Positive and Negative Syndrome Scale
Positive and Negative Syndrome Scale (PANSS) was used for measuring symptom severity of patients with schizophrenia [18]. The reliability and validity of the PANSS in the Turkish population was tested in 1999 [19]. The scale contains seven items for positive symptoms, seven items for negative symptoms, and 16 items for general psychopathology.
Global Assessment of Functioning
Global Assessment of Functioning (GAF) was used to evaluate the severity and recovery of the symptoms for the patients [20]. GAF is a 100-point scale that measures a patient’s overall level of psychological, social, and occupational functioning. Higher scores indicate higher levels of functionality.
Clinical Global Impression-Severity Scale
Clinical Global Impression-Severity Scale (CGI-SS) was used to score the severity of the illness and the degree of recovery. The CGI-SS is a 7-point Likert scale (1, normal; 2, borderline mentally ill; 3, mildly ill; 4, moderately ill; 5, markedly ill; 6, severely ill; and 7, among the most extremely ill patients) [21].
Trail Making Test
The Trail Making Test-A includes 25 circles numbered from 1 to 25 and participants are asked to draw lines to connect these numbers in ascending order. In Trail Making Test-B, the circles include both numbers and letters. Participants are asked to connect the circles using both numbers and letters in ascending order [22]. The participants are evaluated on the duration of time required to connect the trail. These tests measure processing speed and working memory [23]. The Turkish validity and reliability study of the scale was conducted by Türkeş et al. [24].
Verbal fluency test
Categorical verbal fluency was evaluated by asking the participants to count the maximum amount of animal species in 60 seconds, while semantic fluency was evaluated by counting the words starting with the letters K, A, and S except for proper nouns in 60 seconds. The Turkish norms of the tests, the Turkish version of which was created by Öktem for the first time, were used in the study conducted by Tümaç and Canbeyli [25].
The Digit Span Test
In the Digit Span-forward Test, patients are asked to repeat an increasing series of numbers after the tester, and the test measures short term auditory recall. In the Digit Span-backward Test which measures working memory, patients are asked to repeat the numbers in reverse order. The Turkish validity and reliability study of the scale was performed by Karakaş [26].
OCT
OCT is a noninvasive method that provides high-resolution images in cross-sectional imaging of the orbital tissues. By measuring the intensity of the reflected light from the tissue layers and the reflection delay time, it provides detailed tomographic section images of biological tissues at high resolution (1–15 μm) [27]. With the increased resolution by the developing technology, it can better separate the retinal layers, including the junction between the outer limiting membrane and the inner and outer photoreceptor segments. Today, OCT is complementary to other diagnostic methods in the evaluation of retinal surface, retinal surface-vitreous relationship, intraretinal structures, and retinal pigment epithelium in macular pathologies. We measured peripapillary RNFL, GCL-IPL thickness, and MV by using the Optopol Revo spectral-domain OCT device (Optopol, Raleigh, NC, USA) in all patients and their siblings in a single session. The measurements were done by a trained and experienced ophthalmologist, without dilating the pupils. RNFL assessments were made in a circle of 3.4 mm containing the optic nerve head, temporal, superotemporal, superonasal, nasal, inferonasal, and inferotemporal, and average results were recorded separately. Macula measurements were adjusted defining the fovea as the center.
Statistical analyses
The Shapiro–Wilk test was used to evaluate the normality of the numeric data. Numerical variables which were normally distributed were presented as mean±standard deviation. Otherwise, presented with median (minimum–maximum) values. Categorical variables were presented with number (%) values. Independent samples t-test was used to compare normally distributed numerical variables between genders. Mann-Whitney U test was used to compare nonnormally distributed numerical variables between genders. Correlations between the numerical variables were evaluated with Spearman’s correlation coefficient or Pearson correlation coefficient according to normal distrubition. To evaluate whether retinal layers predict cognitive tests, two linear regression models were conducted. A two-sided p-value of less than 0.05 was judged to be statistically significant. Statistical analyses were performed on IBM SPSS Statistics version 23.0 (IBM Corp., Armonk, NY, USA).
RESULTS
Sociodemographic and clinical characteristics of the participants
Our study consisted of 36 schizophrenia patients and their 36 healthy siblings. While there were 24 men and 12 women among schizophrenia patients, this ratio was 18/18 for siblings (p=0.151). The median duration of education for patients was 8 years, while it was 11.5 years for the siblings (p=0.052). The rate of participants who are working in a full-time job was 19.4% in the patient group and 44% in the sibling group. Median BMIs were 26.16 and 22.31 kg/m2 for the patient group and their siblings, respectively (p=0.018).
For the patient group, the mean age at onset of first symptoms was 19.14±3.97 years. The median scores of the PANSS positive, negative, general psychopathology, and total were 13, 20, 33, and 66, respectively. The mean GAF and CGI-SS scores of the patients were 55 and 4, respectively. The median number of antipsychotics used by the patients was 2.0, and 27.8% of the patients were under clozapine treatment.
Sociodemographic and clinical characteristics of participants are presented in Tables 1 and 2.

Sociodemographic characteristics of the patients and their siblings

Clinical characteristics of the patients
The comparison of the OCT parameters between groups
There were significant differences between groups in right superior (p=0.026) and left inferior (p=0.021) RFNL; left superior (p=0.049), right inferior (p=0.030), and right mean (p=0.050) GCL-IPL; right (p=0.014) and left (p=0.003) MVs. There were no significant differences in other OCT parameters. The measures and comparison of the OCT parameters between schizophrenia patients and their siblings are presented in Table 3.
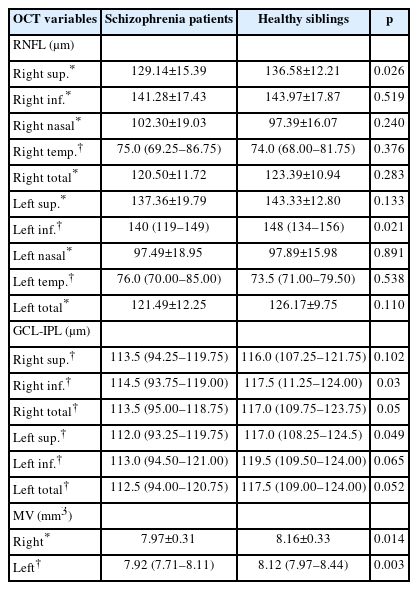
The comparison of the RNFL, GCL-IPL, and MVs of the patients and their siblings
Comparison of the neurocognitive tests between groups
Trail Making Test- A and B completion times of the patients were significantly longer than those of the siblings (p<0.01). The performance of the siblings was significantly better than the patients in both categorical (p<0.01) and phonemic (p<0.01) verbal fluency. While there was no difference between the groups in terms of Digit Span-forward scores, Digit Span-backward scores were significantly lower in the patient group (p<0.01).
Correlations between neurocognitive tests and OCT parameters for patient group
For the patients, there were no significant correlations between OCT parameters and PANSS, CGI-SS, and GAF scores. Right and left mean RNFL was correlated with Digit Span-forward scores (p=0.001, p=0.011), which were not different from the siblings’ scores, right and left mean GCL-IPL were correlated with verbal fluency total scores (p<0.05). Other significant correlations between neurocognitive tests and OCT parameters for the groups are presented in Table 4.
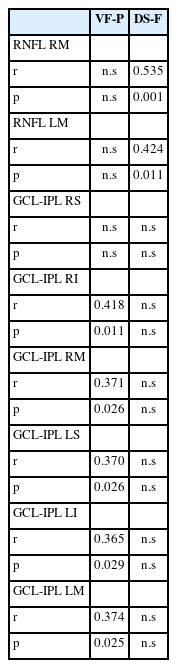
Correlations between neurocognitive tests and OCT parameters in patients
For the variables that were significantly related in the correlation analysis, general linear models were created by including OCT measurements, study group (patient/control), BMI, and age variables in the model to predict cognitive functions. Since GCL-IPL thicknesses differed between the two groups in our study, it was chosen as the independent variable in regression models. Additionally, verbal fluency, which was found to be significantly related to GCL-IPL thicknesses, was accepted as a dependent variable in a linear regression model. In predicting verbal fluency total scores, right and left mean GCL-IPL was still significant when group, gender, BMI, age, and interactions between group and gender were included in the model (p=0.01, p=0.03). There was also a significant group effect. The interaction effect of other variables was not significant. The effects of study group (patient/control), BMI, and age variables on verbal fluency are presented in Table 5.

The effects of study group (patient/control), BMI, and age variables on verbal fluency scores
DISCUSSION
In our study, we hypothesized that retinal layer thickness would be decreased more in patients with schizophrenia than healthy siblings and this reduction would be related to the severity of cognitive dysfunctions. According to results, the groups were similar in terms of mean RNFL. However, all GCL-IPL thicknesses were lower in the patient group, and a mild-to-moderate correlation between phonemic verbal fluency from cognitive functions and GCL-IPL’s mean values of total and all subregion thicknesses for both eyes in patient group was demonstrated.
There are a few studies comparing patients with schizophrenia and their first-degree relatives in terms of OCT findings [28]. Kurtulmus et al. [28] found that there was no difference between mean RNFL, GCL and macular thicknesses between groups but only IPL was significantly lower in both patients and first degree relatives than healthy controls. Similar to this study, we found all GCL-IPL thicknesses to be lower in the patient group. GCL-IPL consists of the ganglion cell bodies, dendrites, and synaptic connections. Thinning of GCL-IPL could reflect neuronal atrophy and synaptic losses of schizophrenia [11]. Differently to several recent studies comparing retinal layers via only RNFL structures, in our study spectral-OCT, which has a higher spatial resolution than time domain OCT to investigate GCL-IPL segments and MV in addition to RNFL has been used. González-López et al. [29] demonstrated that the sensitivity of the GCL-IPL in detecting retinal impairment in relapsing-remitting multiple sclerosis (MS) was higher than that of the RNFL measurements. Also, measurements of GCL and IPL in patients with neurodegenerative diseases such as Parkinson’s disease, MS, and optic neuritis have showed correlation with disease severity rather than RNFL thickness [30,31]. Celik et al. [12] found not only decreased GCL and IPL volumes in patients with schizophrenia compared with controls but also stronger correlations between GCL and IPL volumes and disease severity and duration, than RNFL thicknesses. The significant GCL-IPL thinning in the patient group indicates the presence of abnormal synaptic organization during the course of disease, thus GCL-IPL may be more important region than RNFL reflecting retinal changes during the course of psychosis.
In addition to GCL-IPL changes, MVs were significantly lower in patients in our study. A study conducted with MS patients reported that MV reduction is a parameter that demostrates neuronal loss [32]. Two studies [9,32] conducted with schizophrenia patients found no difference between MVs, whereas in one study [33], MVs were lower in the patient group than in controls. Despite few and conflicting results in the literature, our findings support the notion that MV may indicate neuronal loss in patients with schizophrenia, but further studies are needed for better understanding on this topic.
Deficits in neurocognitive functions are considered to be a primary symptom cluster in patients with schizophrenia [34]. Neurocognitive deficits are observed not only in the patients but also in their first-degree relatives and individuals at risk states [35]. In schizophrenia, significant deficits in attention, memory, and executive functions have been found prior to the occurrence of manifest symptoms [36]. It is established that cognitive symptoms worsen with the onset of the disease, and cognitive deficits deteriorate with the duration of the disease. In our study, Trail Making Test- A and B, verbal fluency test, and Digit Span Test-backward performances were significantly worse in the patient group than in siblings. These results are consistent with the previous studies [34,37].
In recent years, studies examining the relationship between retinal structures and cognitive functions have been increasing. A population-based study investigating 11,124 eyes of 6,471 subjects found that low cognitive performance was mainly associated with thinner RNFL thickness and suggested that RNFL thickness would be an indicator for cognitive performance and present the potential for prediction of future cognitive decline [38]. We found that both the right and left eye RNFL thickness and the Digit Span Test performances were moderately correlated in patients. The Digit Span Test evaluates working memory, attention, and short-term auditory recall functions [39]. Similarly, in a follow-up study conducted in 2017, the thickness of the RNFL was associated with the test scores that evaluated episodic memory, and it was emphasized that the RNLF thickness could be a marker reflecting the cognitive deficits in geriatric population [40]. Another large scale population study (n=2,483) reduction of GCL volume is more strongly related to adult cognitive functioning especially in processing speed and verbal episodic memory than RNFL thickness [41]. The studies investigating this relationship in neurological diseases showed different results. A longitudinal population study demonstrated that thinner RNFL and GCL-IPL were associated with different cognitive tests similar to our results and found the association of GCL-IPL with prevalent dementia [42]. The studies exploring the relationship of retinal structures with cognitive functions in schizophrenia patients are limited. In two recent studies, Liu et al. [15] compared thickness of RNFL and neurocognitive tests via the Stroop Color Word Test and Repeatable Battery for the Assessment of Neuropsychology Status in schizophrenia patients and healthy controls and found that in schizophrenia patients there was a significant relationship with impairments of immediate memory, visuospatial functions, and reduction of RNFL thickness. However, differently to these studies, in our study, not only RNFL but also GCL-IPL thickness of the retina was investigated and found correlations with cognitive impairment.
In our study, there was a strong relationship between verbal fluency performances and thickness of GCL-IPL in patient group. The verbal fluency test is used to evaluate language skills, especially speed of processing and sustained attention [43]. In recent studies, verbal fluency performance in schizophrenia patients presented one of the largest mean effect sizes among other neurocognitive test variables [44]. It has consistently found to be affected in both patients and healthy first-degree relatives, supporting its value as a vulnerability marker [45]. The studies investigating verbal fluency as a possible predictor for transition to schizophrenia in first episode psychosis and in ultrahigh risk (UHR) patients concluded that verbal fluency was disrupted prior to the outbreak of psychosis and could contribute to an improved prediction of transition to psychosis in patients with UHR symptoms within two years [46]. We created a model to determine the variables (such as BMI, age, gender, and being sick) affecting retinal measurement and verbal fluency results and found that only being sick and GCL-IPL thicknesses significantly predicted test performance. These results are compatible with studies emphasizing that verbal fluency can be an important predictor in determining the cognitive symptoms of psychosis patients. Several studies in recent years have reported IPL thinning independently of confounders in patients with schizophrenia and suggested that it may be a potential endophenotype candidate. Our results have shown that GCL-IPL thinning is related to some cognitive domains, especially to processing speed. From this point of view, GCL-IPL could be an important layer in terms of evaluating cognitive functions in patients. Additionally, the detection of cognitive impairments and retinal findings in healthy siblings of patients who have a similar genetic predisposition with patients but are not affected by disease-related confounders such as sympthoms of the disease or medication, and the fact that the impairment of patients cannot be found to be associated with disease severity, duration or treatment response, contribute to the neurodevelopmental hypothesis of schizophrenia rather than neurodegenerative processes. Further larger sample studies including healthy control groups with healthy siblings and patients may illuminate these issues.
Our study has some limitations. First of all, our results may not be representative of the general population due to the relatively small size of our sample, besides; as this is a cross-sectional study, the causality is not clear. Second, we examined the relatively limited number of retinal layers in our study, so examining deeper retinal layers may help developing different perspectives on this issue. Additionally, since there was no healthy control group in the study, OCT and neurocognitive parameters could not be compared with those who were not affected by the disease or genetic vulnerability, further studies including the participants from different phases of the disorder for example patients at first psychotic episode may provide better understanding about these connections. Finally, there may be the possible effects of psychotropics used by patients and differences in BMI between groups on retinal structures. Despite these limitations, our study is the first study that evaluates OCT parameters and neurocognitive impairment in the healthy siblings of schizophrenia patients and investigates the correlation of retinal findings in both patients with schizophrenia and their healthy siblings to cognitive functions.
In conclusion, these results indicate that different structural changes in the retinal nerve are associated with some specific cognitive domains in schizophrenia patients. OCT measurements may play an essential role in tracking neurocognitive symptoms which are the important causes of disability in patients. Our findings imply that these structural changes in the retinal nerve are related to possible structural changes in the brain that cause cognitive symptoms.
Notes
Availability of Data and Material
The datasets generated or analyzed during the study are available from the corresponding author on reasonable request.
Conflicts of Interest
The authors have no potential conflicts of interest to disclose.
Author Contributions
Conceptualization: Rümeysa Taşdelen, Batuhan Ayık, Hatice Kaya. Data curation: all authors. Formal analysis: Batuhan Ayık, Hatice Kaya. Investigation: all authors. Methodology: Rümeysa Taşdelen, Batuhan Ayık, Hatice Kaya. Resources: all authors. Writing—original draft: Rümeysa Taşdelen, Batuhan Ayık, Hatice Kaya. Writing—review & editing: all authors.
Funding Statement
None