The Influence of Life Stress and Sleep Disturbance on White Matter Integrity
Article information

Abstract
Objective
This study investigated whether sleep and stress mutually interact to induce changes in white matter integrity.
Methods
Diffusion tensor imaging (DTI) was conducted on 36 participants (male=22, female=14; mean age=38.33±12.78 years). Participants were divided into three groups depending on their sleep quality and stress levels: poor sleepers with stress, poor sleepers without stress, and good sleepers. Sleep quality and stress level were evaluated using the Pittsburgh Sleep Quality Index and the Life Experiences Survey, respectively. Fractional anisotropy (FA) values were calculated employing DTI tractography.
Results
After controlling for age and sex, poor sleepers with stress exhibited a lower FA of the left inferior cerebellar peduncle (ICP) than did poor sleepers without stress (t=2.81, p=0.02). Poor sleepers without stress showed a higher FA of the right middle longitudinal fasciculus (MdLF) than did good sleepers (t=3.35, p=0.006).
Conclusion
The current study reports the effects of sleep, stress, and their interaction on the white matter integrities of the ICP and MdLF. ICP change seems to be associated with sleep disturbances related to stress, while MdLF change would be associated with sleep disturbances unrelated to stress.
INTRODUCTION
It is well-known that sleep and stress mutually interact [1]. Stressful life experiences disturb sleep continuity and the sleep cycle [2]. The levels of neurotransmitters involved in the sleep-wake cycle (acetylcholine and norepinephrine) are influenced by stress. Psychological stress affects the hypothalamic-pituitary-adrenal axis, in turn changing sleep [1]. Sleep disturbances alter the neural connectivities of white matter tracts. Such changes have been reported in the internal capsule, corona radiata, thalamus, and frontal regions of insomnia patients [3-5]. Thus, white matter neural connectivity may be compromised by sleep problems.
Life stress could also affect white matter. Patients with depression who were exposed to high levels of life stress exhibited greater increases in white matter hyperintensity volumes than did those exposed to less stress, despite similar levels of depression [6]. Thus, stress per se triggers changes in white matter integrity independent of any associated psychiatric/psychological problems. The relationship between stress and sleep may also influence brain structural and functional connectivity [7,8]. The interaction between sleep and stress affects the brain response to emotional and sleep-related stimuli [9,10]. Thus, sleep and stress probably interact to trigger changes in white matter integrity.
However, only one prior study investigated how the interaction between sleep and stress affected the white matter tracts of elderly subjects [3], and found that poor sleep quality induced more changes than did stress; no mediation effect of sleep and stress was apparent. However, even if sleep disturbances exert stronger effects than stress, the effects of such disturbances associated with stress should differ from those of sleep disturbances without stress.
No study has yet compared the white matter integrities of those with poor sleep with and without stress. We used diffusion tensor imaging (DTI) tractography to investigate the relationships between sleep, stress, and white matter integrity in poor sleepers with and without stress (PS+S and PS-S, respectively), and good sleepers (GS). We hypothesized that the fractional anisotropy (FA) values reflecting white matter connectivity would differ between the groups.
METHODS
Participants
Forty-one subjects (male=24, female=17) aged between 20 and 65 years (mean age=38.32±12.84 years) were recruited via advertisements placed at Seoul National University Hospital and Samsung Medical Center. We included those exposed to everyday stress with sleeping problems. The structured clinical interview of the Diagnostic and Statistical Manual of Mental Disorders IV was used to screen for psychiatric disorders. Nocturnal polysomnography (PSG) was employed to detect sleep disorders. The exclusion criteria were moderate-to-severe obstructive sleep apnea (apnea-hypopnea index >15/h on nocturnal PSG); periodic limb movement disorder (periodic limb movement index >15/h on PSG); (even) borderline antisocial personality disorder; a current Axis I psychiatric disorder; shift work; pregnancy; or a past or current history of severe neurological or medical illness. Also, those unable to undergo magnetic resonance imaging (MRI) were excluded. Of the 41 subjects initially enrolled, five were excluded because the brain images were of poor quality (attributable to motion artefacts during acquisition). Brain images of 36 subjects (male=22, female=14; mean age=38.33±12.78 years) were used. There was no significant difference in either age (t=0.02, p=0.99) or sex (p=0.63) between the included 36 and excluded 5 subjects. The 36 participants were divided into three groups based on sleep quality and stress status: PS+S (n=14, male=9, female=5; mean age=43.93±12.78 years), PS-S (n=9, male=4, female=5; mean age=39.11±14.32 years), and GS (n=13, male=9, female=4; mean age=31.77±8.90 years). The GS group included GS with stress (GS+S; n=4, male=3, female=1; mean age=28.50±2.89 years) and GS lacking stress (GS-S; n=9, male=6, female=3; mean age=33.22±10.39 years). All participants gave written informed consent prior to participation. The study was approved by the Institutional Review Boards of Seoul National University Hospital (IRB No. 1608-160-788) and Samsung Medical Center (IRB No. 2016-08-067).
Self-reported measures/coding
The Pittsburgh Sleep Quality Index (PSQI) was used to assess sleep quality during the prior month in terms of subjective quality, latency and duration, habitual efficiency, disturbance, use of sleep medication, and daytime dysfunction [11]. The score for each component ranged from 0 to 3; the maximum score was 21. Higher scores indicated poorer sleep quality. Subjects with scores >5 were classified as PS; all others were GS. The Life Experiences Survey (LES) was used to assess stress during the past 6 months. The LES features 47 items covering many stressful life events, including death or illness of a close family member or friend, marital separation, and financial problems. The LES features a 7-point Likert scale ranging from extremely negative (-3) to extremely positive (+3). Positive and negative events are separately evaluated. Subjects with stress were those whose negative LES scores were within the upper 50th percentile; all others lacked stress.
DTI
A 3T whole-body Siemens scanner (TrioTim Syngo; Siemens Healthneers, Munich, Germany) fitted with a 12-channel, birdcage head coil was used for anatomical imaging and DTI. Anatomical images were acquired using a T1-weighted, three-dimensional (3D) magnetization-prepared rapid gradient echo sequence (repetition time/echo time/inversion time/flip angle=1,670 ms/1.89 ms/900 ms/9°, slice thickness=1.0 mm, in-plane resolution=1×1 mm, field of view=250 mm, and matrix size=256×256). DTI was performed in the axial plane using the following parameters: b=0 and 900 s/mm2, number of diffusion gradient directions=30, repetition time= 12,000 ms, echo time=82 ms, slice thickness=2 mm, flip angle=90°, and matrix size=128×128.
DTI analyses
Diffusion data files were analyzed using DSI Studio (http://dsi-studio.labsolver.org/). Initially, the DICOM diffusion files were converted to NIFTI files employing MRIConverter (https://lcni.uoregon.edu/downloads/mriconvert) and the latter files imported into DSI Studio. An automated mask was applied prior to rendering of the 3D DTI volumes. Diffusion data were reconstructed using the q-space diffeomorphic method; this yielded individual FA maps aligned to the MNI space employing non-linear registration to the Human Connectome Project (HCP) 1,065 subject template. Mean FA values were extracted via automatic fiber tracking employing the HCP tractography atlas [11], which shows the white matter pathways revealed by diffusion MRI. The atlas contains 10 projections (optic and acoustic radiations; the corticostriatal pathway; the corticospinal tract; the corticothalamic pathway; the fornix; and the frontopontine, occipitopontine, parietopontine, and temporopontine tracts), 11 associations (the arcuate fasciculus; frontal aslant tract; cingulum; extreme capsule; U-fibers; and the inferior-fronto-occipital, inferior longitudinal, middle longitudinal, superior longitudinal, uncinate, and vertical occipital fasciculi), 3 commissures (the corpus callosum and the anterior and posterior commissures), 5 cerebellar regions (the cerebellum; vermis; and the inferior cerebellar, middle cerebellar, and superior cerebellar peduncles), and 7 brainstem pathways (the rubrospinal, spinothalamic, and central tegmental tracts; the dorsal and medial longitudinal fasciculus; and the lateral and medial lemnisci). As some cranial nerves cannot be identified in the HCP-842 template due to the limitation of spatial resolution, all cranial nerves were excluded from the regions of interests.
Statistical analysis
Categorical variables were compared using the Fisher’s exact test. When differences between groups were significant, post-hoc pairwise comparisons were performed using the Fisher’s exact test. Group differences in continuous variables were sought via a one-way analysis of variance with the posthoc Tukey’s test. Individual FA values of interest were extracted from DSI studio, and a one-way analysis of covariance with the post-hoc Tukey’s test was used to identify between-group differences with adjustment for age and sex. All statistical analyses were performed using R software (R Development Core Team, Vienna, Austria); a p<0.05 was considered to indicate statistical significance.
RESULTS
Demographic and clinical characteristics
The sex ratio did not differ between the three groups (PS+S, PS-S, and GS) but age did (F=3.51, p=0.04) (Table 1). The mean age of PS+S was significantly higher than that of GS (t=2.64, p=0.03) but the age of PS-S did not differ from those of the other two groups (PS-S vs. PS+S: t=0.94, p=0.62; PS-S vs. GS: t=1.42, p=0.34). When we compared four groups (PS+S, PS-S, GS+S, and GS-S), there was no significant difference in the sex ratio, mean age, or educational level. As expected, there were significant between-group differences in the LES (F=18.29, p<0.001) and PSQI (F=37.92, p<0.001) scores. The LES score was higher in PS+S than in PS-S (t=5.48, p<0.001) and GS (t=4.68, p<0.001). However, the LES scores did not differ between PS-S and GS (t=1.24, p=0.44). The PSQI scores of PS+S were higher than those of PS-S and GS (t=2.92, p=0.02; t=8.66, p<0.001; respectively). The PSQI scores were higher in PS-S than GS (t=4.82, p<0.001). The PSQI scores correlated positively with the LES scores of the total subjects (r=0.57, p<0.001). This correlation remained significant after adjustment for age and sex (r=0.56, p<0.001).
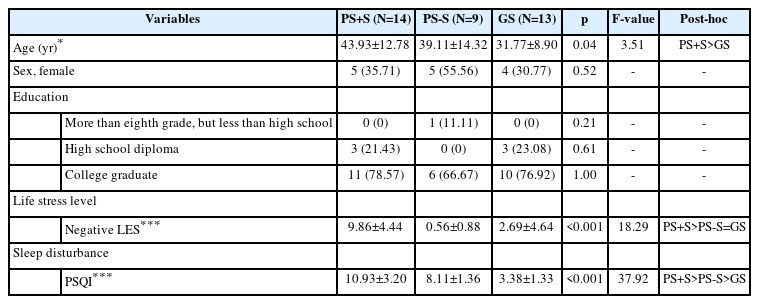
Demographic and clinical characteristics of all participants
Group differences in FA
We found significant between-group differences in the mean FA of the right middle longitudinal fasciculus (MdLF) (F=4.58, p=0.02) and left inferior cerebellar peduncle (ICP) (F=4.58, p=0.02) (Figure 1). The differences remained significant even after adjustment for age and sex (right MdLF: F=4.81, p=0.02; left ICP: F=4.70, p=0.02). Post-hoc comparisons showed that PS-S evidenced a higher mean FA of the right MdLF than did GS (t=3.35, p=0.006) (Figure 1). There was no difference between PS+S and PS-S (t=1.68, p=0.23) or between PS+S and GS (t=1.82, p=0.18). The mean FA of the left ICP was lower in PS+S than PS-S (t=2.81, p=0.02); the differences between other group pairs were not significant (PS+S vs. GS: t=1.11, p=0.52; PS-S vs. GS: t=1.70, p=0.22) (Figure 1). When GS+S (n = 4) were excluded from analysis, the results were similar.
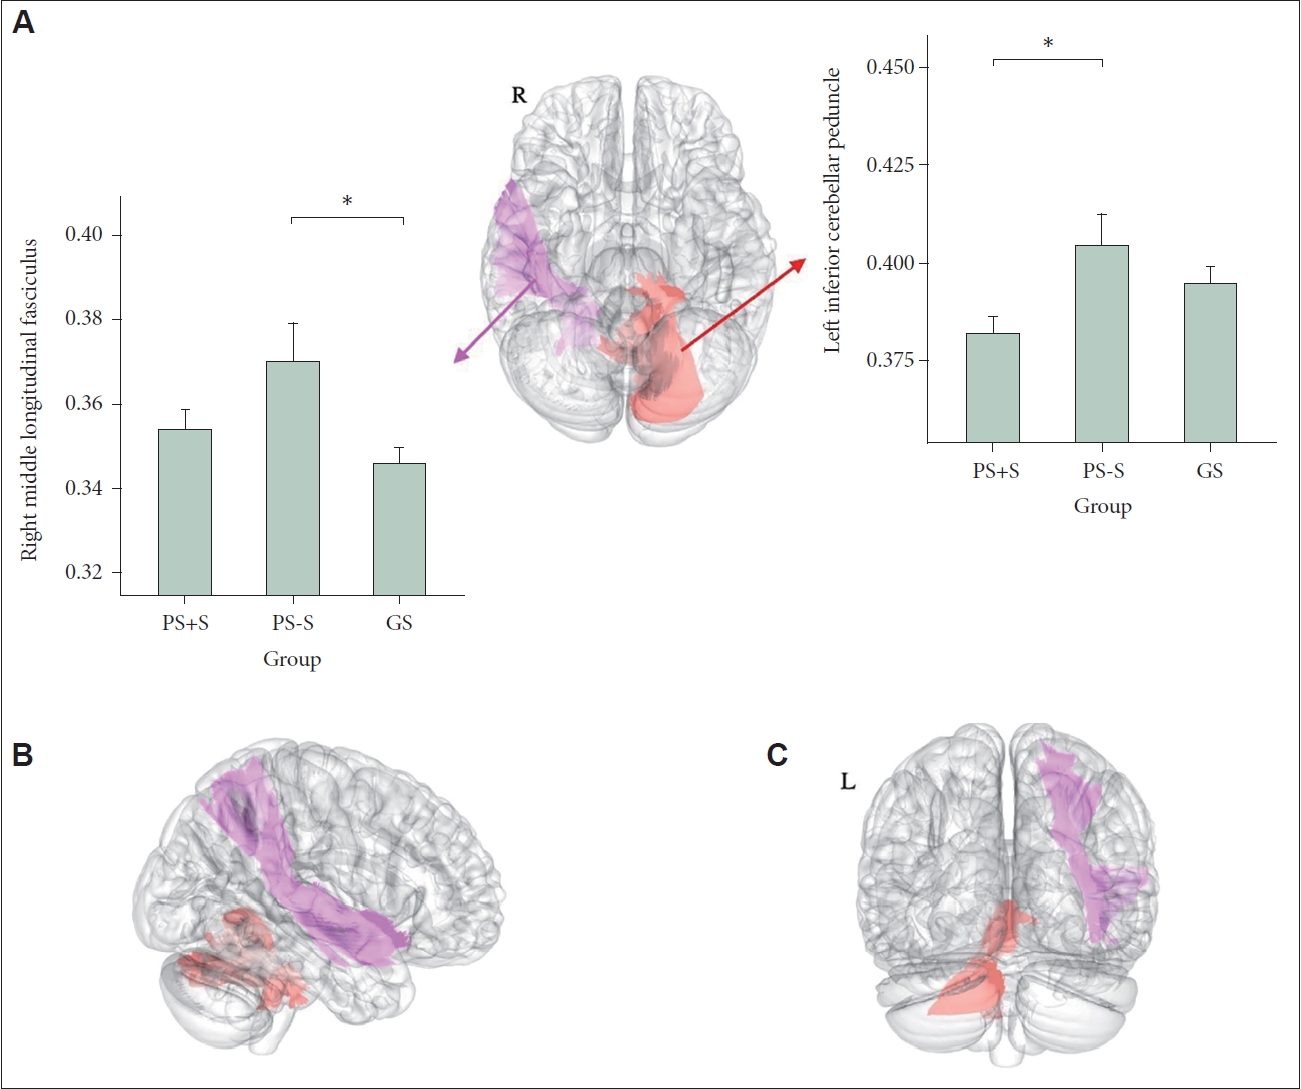
Differences in white matter integrities among poor sleepers with stress (PS+S), poor sleepers without stress (PS-S), and good sleepers (GS). Brain regions that exhibited significant among-group differences in mean FAs are shown in the axial plane (A), right sagittal plane (B), and coronal plane (C). These areas correspond to the left ICP (red) and right MdLF (pink). The mean FA of each region (by group) is shown in the box plots (A). PS-S exhibited a higher right middle longitudinal fasciculus FA than did GS, and PS+S had a higher left ICP FA than did PS-S. *p<0.05. FA, fractional anisotropy; ICP, inferior cerebellar peduncle; MdLF, middle longitudinal fasciculus.
DISCUSSION
This study explored whether sleep and stress ineteracted to change white matter integrity. Consistent with our hypothesis, integrity was affected by sleep quality and stress. The anisotropic diffusion of the right MdLF was higher in PS than in GS. The connectivity of the left ICP was reduced in PS+S compared to GS. MdLF white matter integrity was higher in PS-S than in GS. This seems to contradict the previous finding of an overall reduction in neural tract associations (including that of the MdLF) in children with sleep disturbances [12]. However, our participants/groups differed; this study did not investigate children and the children of the cited work were not grouped by the level of stress exposure. In this current study, PS+S and GS did not differ in terms of MdLF integrity.
It is still not clear why only PS-S (but not PS+S) showed increased MdLF white matter integrity. The MdLF is a long associative white matter tract connecting the temporal pole and the parietal, precuneus and occipital cortex [13,14]. MdLF has been assumed to engage in language processing, particularly in the context of semantic language comprehension [15,16]. However, the role and the division of the MdLF are controversial yet [17]. MdLF was also suggested to involve the integration of visual and auditory information [18]. As MdLF connects the temporal pole including amygdala and precuneus cortex, MdLF may also involve the emotional regulation associated with amygdala-precuneus connectivity [19]. Sleep plays very crucial role in the cognitive and affective processing such as memory consolidation, cognitive integration, or emotional regulation [20,21]. As sleep disturbance might produce the cognitive/affective impairments, compensatory MdLF strengthening (i.e., increased FA) after poor sleep may appear to preserve cognitive/emotional processing.
However, in the current study, poor sleep with stress did not show increased FA value of MdLF. This can be due to the effects of stress. One previous study reported that early life stress decreased FA values of MdLF [22]. Another study reported the interaction of social stress and serotonin genotype affected FA values of MdLF [23]. Therefore, stress may interfere the compensatory MdLF strengthening after poor sleep [20].
Another plausible explanation is that poor sleep caused by stress may differ neurologically from sleep disturbance unrelated to stress. Sleep disturbance has many triggers [24]. Sleep disturbance unrelated to stress may feature neurobiological characteristics that differ from disturbance induced by stress or stress-related emotional problems. As PS-S showed higher rather than lower FA value of MdLF compared to GS, poor sleep unrelated to stress seems to be associated with strong white matter integration of MdLF. However, although the increased white matter integrity (i.e., increased FA) sometimes indicates aberrant over-integrations of white matter, the decreased white matter integrity (i.e., decreased FA) is generally regarded as indicating weak and disrupted brain connectivity. Therefore, the notion that poor sleep strengthens the white matter integration seems to be slightly counter-intuitive.
This study found that ICP white matter integrity was decreased in PS-S compared to PS+S but did not differ between PS and GS. It thus seems that stress mainly affected ICP white matter integrity. The ICP is located between cerebellum and brainstem. The ICP contains spinocerebellar, cuneocerebellar, olivocerebellar, and vestibulocerebellar tracts, which carry information from body to the cerebellum. The ICP also contains efferent connections from the cerebellum towards the vestibular nuclei along the border of the pons and medulla [25]. Indeed, the cerebellum has been suggested to be connected to stress-related neural tracts [26]. Our findings were in line with previous studies reporting the association between ICP and trauma/stress. One study has reported that the decreased FA value of ICP was correlated with post-traumatic stress disorder symptom of combat veterans [27]. Another study has also reported the association between childhood trauma and low FA value of the ICP in young adults [28]. In addition, white matter change of ICP was reported to be associated with current stress level in older adults [29].
This study has several limitations. No cross-sectional study can explore the temporal or causal relationships between sleep, stress, and white matter tract changes. Our study was explorative in nature, the sample size was small, and the effects on individual tracts remain unclear. Future longitudinal studies with large sample sizes that focus on specific white matter tracts are required. In addition, in this study, life stress during the prior 6 months (regardless of the stress onset time) was assessed; the effects of long-term chronic stress may differ from those of acute stress.
In conclusion, current study found higher MdLF FA values in PS-S than in the others and lower ICP FA values in PS+S than in the others. This finding suggests that poor sleep and stress interact to trigger white matter alterations, and that sleep disturbances related to stress and not may differ in neurobiological terms.
Notes
Availability of Data and Material
The datasets generated or analyzed during the study are available from the corresponding author on reasonable request.
Conflicts of Interest
The authors have no potential conflicts of interest to disclose.
Author Contributions
Conceptualization: Yu Jin Lee, Seog Ju Kim. Data curation: Jiye Lee, Nambeom Kim, Yunjee Hwang, Kyung Hwa Lee. Formal analysis: Minjeong Kim, Jiye Lee, Jooyoung Lee. Funding acquisition: Seog Ju Kim. Investigation: Jooyoung Lee, Yu Jin Lee, Seog Ju Kim. Methodology: Nambeom Kim, Yunjee Hwang, Kyung Hwa Lee. Project administration: Yu Jin Lee, Seog Ju Kim. Resources: Yu Jin Lee, Seog Ju Kim. Software: Jiye Lee, Nambeom Kim, Yunjee Hwang. Supervision: Yu Jin Lee, Seog Ju Kim. Validation: Nambeom Kim, Jooyoung Lee, Yu Jin Lee, Seog Ju Kim. Visualization: Minjeong Kim, Jiye Lee. Writing—original draft: Minjeong Kim, Jiye Lee. Writing—review & editing: Nambeom Kim, Yunjee Hwang, Kyung Hwa Lee, Jooyoung Lee, Yu Jin Lee, Seog Ju Kim.
Funding Statement
This research was supported by the National Research Foundation of Korea (NRF) grant funded by the Korean government (MSIT) (No. 2020R1F1A1049200, 2022R1A2C2008417), the Bio & Medical Technology Development Program of the National Research Foundation (NRF) funded by the Korean government (MSIT) (No. 2020M3E5D9080561), and a grant of the Korea Health Technology R&D Project through the Korea Health Industry Development Institute (KHIDI), funded by the Ministry of Health & Welfare, Republic of Korea (No. HR21C0885).