Adolescent Screen Use: Problematic Internet Use and the Impact of Gender
Article information

Abstract
Objective
The relationship between screen use and problematic internet use (PIU; i.e., internet addiction) amongst adolescents has not been sufficiently explored. Further, there is even less research on how gender is associated with this relationship. The goal of the study was to examine adolescent screen use, PIU, and its impact on day-to-day routines of adolescents.
Methods
Participants were recruited from an outpatient pediatric clinic in São Paulo, Brazil. A total of 180 adolescents completed questionnaires related to their screen use, extracurricular activities, and symptoms of PIU. Univariate and multivariate statistics were used to determine correlates and predictors of PIU, and to explore gender differences.
Results
A total of 26.1% of adolescents met the criteria for PIU. There were no significant differences between boys and girls in PIU severity. However, there were significant gender differences in preferred use of the Internet, with boys being more likely to access the Internet to play video games (odds ratio [OR]=27.1) and girls being more likely to socialize with friends (OR=4.51). PIU severity increased proportionally to the number of hours of use of all screen devices with moderate-to-large effect sizes (η2=0.060–0.157). Using screens during meals and missing extracurricular activities were both associated with PIU.
Conclusion
Though gender was not associated with PIU, both excessive use of screen devices during meals and neglect of offline extracurriculars activities were identified as risk factors for PIU. Prevention measures should consider the impact of gender and associated patterns of motivation and Internet use.
INTRODUCTION
The dawn of television (TV) transformed societies and their relationship with information. Even the domestic space and family dynamics went through changes as TV sets became almost ubiquitous in each household living-room. Parents and children gathered around the “magic screen” that promised a window to the world. The invention of TV was concerning to some, as scholars debated the potential harms of binge-watching TV and its addictive potential [1]. A similar reaction is likely to occur every time new technology grows in popularity, even comics were not free from public concern regarding their likely disturbing effects over youngsters’ minds [2].
However, the post-modern era does seem to have amassed not one, but a host of technological innovations that together provide unprecedented social and behavioral changes at an accelerated pace that has never been seen before. First came personal computers, which became another omnipresent domestic device, rapidly followed by more portable versions (notebooks, tablets, etc.). Coupled with the Internet, the content of such screen-based devices went through an exponential growth, which is still ongoing. Then came the smartphone, which combined the Internet and telecommunication all amalgamated in a single device [3].
Consequently, new generations face unprecedented access to technological content, which may be associated with behavioral challenges such as the excessive use of social media, video game playing, message exchange apps, relationship platforms, video streaming, consumption of pornography and online sexual content, which may lead to addictive like behaviors [4]. Screen-based activities such as TV, Internet browsing, videogame playing, and social network use are associated with inadequate lifestyle habits, such as poor sleep and sedentariness [5]. Together they have been called the “invisible risks” as they are related to high levels of anxiety, depression and suicide attempts in adolescents and young adults [6]. The aforementioned cluster of activities has several designations, but it has been mostly recognized and described under the term Problematic Internet Use (PIU). Conceptualized as a potential behavioral addiction, PIU is defined by excessive online activity that is difficult to control [7]. Research suggests that PIU has implications for adolescent development and is associated with functional impairment, interpersonal difficulties and decreased academic performance [8]. Despite PIU being considered one of the most significant educational challenges for parents and guardians, its specific consequences and associated risk factors are not adequately understood.
While the Internet can offer access to a vast array of content, there is the paradoxical concern that users could get trapped within algorithmic loops feeding them with a shallow and narrow scope of interests [9]. In youngsters, this could contribute to a loss in the breadth of their experiences beyond academic performance [4]. For instance, the engagement in extracurricular activities has been reported as a protective factor against PIU [10], although this association is not unequivocal in other reports [7]. Extracurricular activities include various structured social, sports, and cultural activities in parallel with the official school curriculum. They are considered an essential part of education and are vital to the expansion of education and major contributors to a sense of belonging and citizenship for the future adult [11].
Today, adolescents spend an unprecedented amount of time in front of screens and on the Internet. According to the Pew Research Center (2018) [12], nearly half of teens indicate that they use the Internet “almost constantly,” and most are worried about the degree of their Internet usage. The current literature is divided on whether to approach the problem based on the specific activity such as Internet gaming disorder (IGD) or encompassing all screen and Internet activities under the umbrella term of PIU [13]. The main arguments in favor of a more generalized addiction approach to Internet use is that it would have great sensibility to a host of digital behaviors commonly associated with each other [14]. The counterargument is that behavioral nuances and particular clinical needs could be better addressed by approaches specific to the problematic behavior [15]. Indeed, gender differences are evident with regards to use of digital technologies. Specifically, many studies have found that girls tend to use the Internet primarily to access social media platforms and socialize, whereas boys tend to use it more for entertainment purposes, such as playing video games [16]. However, research is mixed on whether the amount of daily screen time differs between boys and girls. Generally, studies tend to suggest that boy adolescents spend more time across devices [17,18], whereas other studies found no effect of gender on screen time at all [19]. Among teenage populations, studies on specific uses of social media have also highlighted similar gender differences, with young girls using social media at a greater rate and at an increased risk for developing adverse effects such as sedentariness, sleep impairment, negative perception of their health, and low self-esteem [20]. Despite higher rates of social media use in girls most research suggests that PIU tends to be most prevalent among boys [21]. Specifically, Kim et al. [22] found that in a sample of adolescents, boys who primarily use the Internet to play video games had the highest rate of PIU. Nonetheless, many studies did not find significantly different rates of PIU between genders [23].
These mixed results demonstrate the need to further examine gender differences in PIU in adolescents, considering their social and educational context. Furthermore, most contributions in the field of PIU and related behaviors come from the Northern Hemisphere of the globe, either from Asia, Europe, or North America. Located in South America, Brazil is one of the most engaged countries in information and communication technologies (ICT). From 2019 to 2020, Brazilian Internet users increased, totaling 152 million, with 94% of the Brazilian adolescents being regular users of the Internet, making 22 million users solely in the age bracket between 10–17 years [24]. Considering the presence of ICT equipment, in 2019, almost the entire population from 9 to 17 years old lived in households with a cell phone (98%) and TV (97%), with a ratio slightly higher than one smartphone per inhabitant [25]. Our investment in ICT as a society contrasts with the paucity of information on the impact of the rapid diffusion of Internet screen-based device use amongst youth in Brazil. The goals of the present study were: 1) to explore the relationship between PIU and screen habits, 2) to explore the relationship between PIU and extracurricular habits, and 3) to determine if there was a significant effect of gender on these relationships in a sample of Brazilian adolescents.
METHODS
Participants
A total of 180 adolescents between 14 and 18 years old were invited to participate in the study between May and November 2017 from an outpatient pediatric service. The outpatient service is from the Federal University of São Paulo and is an open access, self or parent referral, free of charge treatment center for the general population. The average age of participants was 13.7 (standard deviation [SD]=2.3) years. Fifty-four percent of the sample were girls. The demographic profiles of girls and boys were generally similar. However, girls were slightly older than the boys. The main chronic disorders in treatment were respiratory illnesses, mostly rhinitis, asthma, and bronchitis (Table 1).
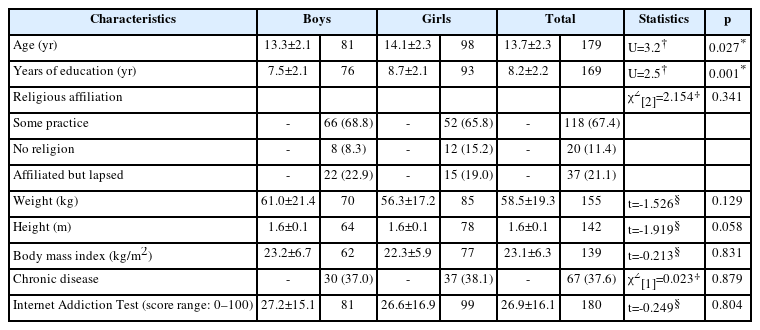
Demographic and clinical profiles of adolescents attending a general pediatric outpatient unit (N=180)
Measures
Demographics
The demographic and clinical profile of participants were obtained during the initial consultation and included: age, gender, years of formal education, religion, weight, height, and presence of chronic disease (respiratory: rhinitis, asthma, sinusitis, bronchitis; others: allergies, migraine, polycystic kidneys, etc.).
PIU
To assess PIU, the Internet Addiction Test (IAT) was used [24]. The IAT consists of 20 self-report Likert-style items ranging from 1 (rarely) to 5 (always). A higher score on the IAT indicates a greater degree of Internet addiction severity. Possible scores on the IAT range from 0–100. Score ranges are as follows: normal (0–30), light addiction (31–49), moderate (50–79), and severe (80–100). The IAT has been translated and validated for use in Portuguese and has satisfactory internal consistency [26].
Screen habits
To assess screen habits and associated behaviors, a literature review was carried out to identify relevant questionnaires in the area and eight items were selected to cover the following area: number of hours a day spent watching TV, watching TV during meals, number of hours a day using a cell phone, using a cell phone during meals, number of hours a day playing video games, number of hours a day using a computer, number of hours a day using tablets, neglecting extracurricular activities to be online, or in other screen-related activity. Several scales were reviewed to develop the questions used to assess PIU behaviors. The IAT [26], validated for use in Brazil. The Smartphone Addiction Scale (SAS) [27], the Internet Gaming Disorder-Short Form (IGDS-SF) [28], and the Bergen Social Media Addiction Scale (BSMAS) [29] were also reviewed and items were translated and adapted by the authors of the present study. Further, additional items covering the number of hours in front of the TV, cell phone, video game, computer and tablet [30]; use of screens, TV or cell phone during meals [31,32]; searching for specific content and/or activities, including social networks, games, chat, and other activities [23,33] were selected from other relevant studies conducted in local and international surveys.
Extracurricular activities
The same procedure was used to assess the type and frequency of extracurricular practices with the addition of items inspired by previous work by the adolescent medicine outpatient team that investigated the relationship between out-of-school activities and TV use [34]. The following extracurricular activities were assessed: regular practice of sports activities, regular practice of non-sports extracurricular activities (including languages), extracurricular courses, arts (music, dance, and theater), and other social practices (dating and hanging out with friends). Further, the potential impact of screen time in these behaviors was included. Finally, as PIU in adolescents is associated with substance use [35], three additional questions were included to assess alcohol, tobacco, and other substance use in the adolescent sample.
Ethics
Informed consent was obtained from all parents and/or guardians of each participant, and an assent form was completed by each adolescent participant following standards established and approved by the local ethics and research committee. Adolescents lacking the capacity to understand the nature of participation were excluded. This study involving human participants was in accordance with the ethical standards and have been approved by the Federal University of São Paulo/Unifesp Research Ethics Committee under number of CAAE: 79495817.0.0000.5505 and shared with the Research Ethics Committee of the University of São Paulo.
Data analysis
Univariate statistics were used to assess participant demographics, IAT scores, screen habits, and practice/frequency of extracurricular activities. Continuous variables were tested for normality using the Kolmogorov–Smirnov test. Independent samples t-tests were carried out for normally distributed variables, and Mann–Whitney U tests were carried out when variables violated normality and for ordinal variables, effect sizes were estimated using Cohen’s d, or the alternative D coefficient for continuous variables without normal distribution, considering the following references: d<0.31=small, 0.30<d<0.40=small-to-moderate, 0.39<d<0.70=moderate, 0.69<d<0.80=moderate-to-large, and d>0.79=large [36]. Categorical variables were compared using the chi-square test, or Fisher’s test when expected cell counts were less than five. Next, the variables that reached significance in the previous univariate analysis were entered into a binary logistic regression model, where gender (1-girls, 2-boys) was the dependent variable.
Associations between PIU, screen habits, and practice of extracurricular activities were assessed using bivariate correlation analysis and linear models. Spearman’s Rho was used for non-normally distributed continuous variables and ordinal variables. For categorical variables, the t-test was used in the case of two categories, and analysis of variance, in the case of more than two categories. Next, the variables that reached significance in the previous univariate analysis stage were selected to compose a linear regression model, with the IAT score as the dependent variable.
Power analysis was carried out based on a study by Choi et al. [35], which reported a mean IAT score of 34.14 (SD=11.23) in a sample of adolescents. To detect if gender influenced PIU, we estimated a sample with the size necessary to detect a difference between means of at least half a standard deviation, setting the sample power values at 0.8 and significance at less than 0.05 [36]. The minimum estimated number per group was 32 individuals for a total sample size of 64.
RESULTS
One hundred eighty adolescents were included in the sample, 98 (54.4%) were girls. The demographic profile of girls and boys was approximately similar. However, girls were about one year older than boys (p=0.027, alternative D=0.40, moderate effect size), had almost 14 more months of education (p=0.001, alternative D=0.35, small-to-moderate effect size) and were slightly shorter (4 cm), although this difference did not reach significance (p=0.058, Cohen’s d=0.36, small-to-moderate effect size). Regarding the body mass index (BMI), there was no significant difference between boys and girls, but contrasting the mean age with the BMI, boys could be considered overweight on average and girls close to the upper limit of the normal range of BMI. The main chronic diseases under treatment were respiratory diseases, mostly rhinitis, asthma, and bronchitis, making up a total of 37.6% of the sample under treatment for at least one chronic disease. Regarding the IAT score, no gender differences were observed, with a mean score of 26.9 (SD=16.1), which was within the healthy range, although close to the upper limit (0–30). The division of the sample by severity of PIU was: 116 individuals without PIU (64.4%), 47 with mild PIU (26.1%), and 17 (9.4%) with moderate PIU. No participants’ IAT scores fell in the severe range. Full results can be found in Table 1.
Screen habits
In terms of screen habits, 38.4% of participants indicated that they watched TV for at least three hours a day, and 28.9% said they watched TV while having their meals. Sixty-six percent of the sample used their mobiles for three or more hours per day, and nearly a quarter (23.9%) used them during meals. There was a significant difference regarding hours dedicated to video games, with 28.6% of boys reported playing video games for three hours or more per day, compared to no girl participants exceeding the amount of two hours per day of video game play (p<0.001, alternative Cohen’s d=0.79). Preferred online activities also differed by gender, with 60.5% of boys primarily accessing the Internet to play video games (p<0.001), compared to 55.1% of girls primarily using the Internet to communicate with friends (p<0.001). Full results can be found in Table 2.
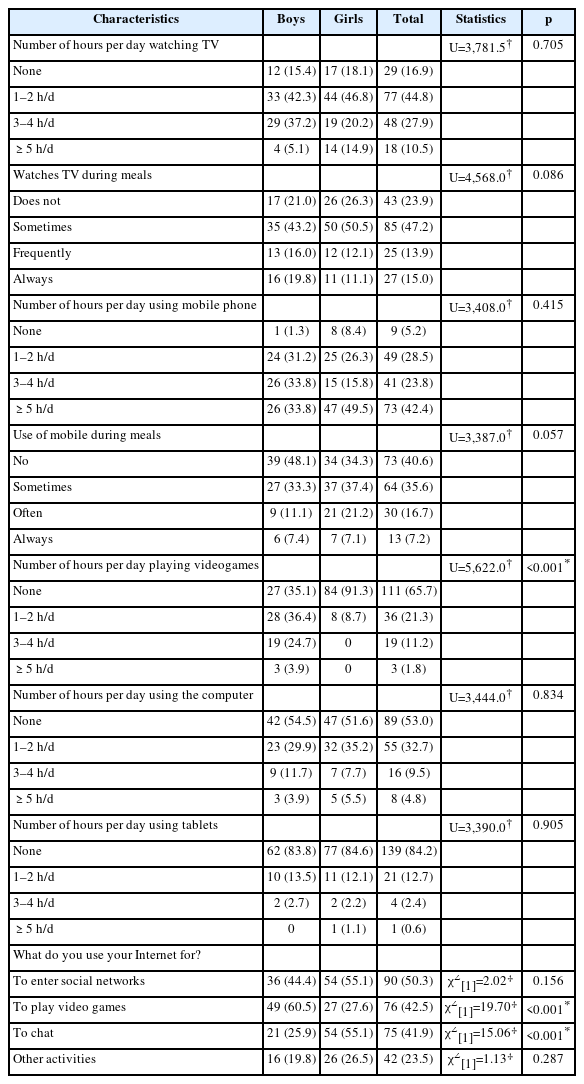
Screen habits of adolescents attending a general pediatric outpatient unit
Extracurricular activities
Boys reported a greater rate of regular involvement in sports (65.4%) compared to girls (42.4%) (p=0.002, alternative D=0.63). Further, 57.6% of girls reported spending less than an hour a week engaged in physical activity. Girl adolescents reported greater engagement in dating at nearly three times the rate of boy adolescents (18.9% vs. 6.6%, p=0.018). No other gender differences were observed in extracurricular activities. However, it is worth nothing that 40% of participants reported engagement in regular practice of at least one extracurricular activity. More than 70% of participants reported spending after-school hours with friends. Roughly 9% reported some use of alcohol, and 2.4% reported experimenting with other psychoactive substances (Table 3).
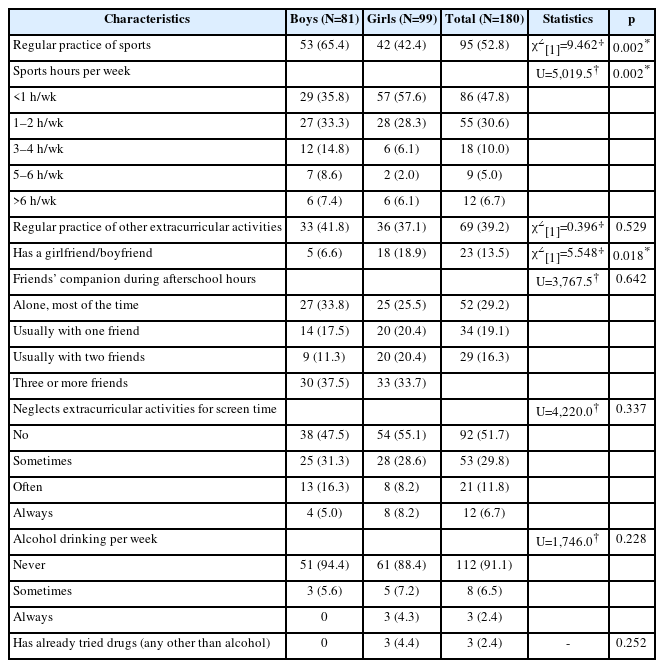
Extracurricular activities and other habits of adolescents in a general pediatric outpatient unit
Binary logistic regression
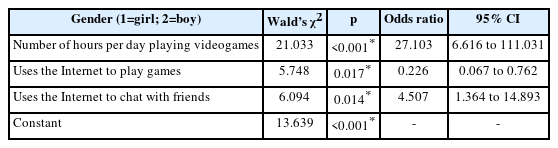
Screen habits and extracurricular activities variables that reached significance at the univariate level were included in a binary logistic regression model alongside the demographic variables that varied between genders in a forward stepwise fashion. The final model (Table 4) suggests that the main differences between girls and boys included video game playing (27 times more frequent amongst boys compared to girls) and Internet chatting (4.5 times more frequent amongst girls compared to boys). The final logistic regression model was significant (p<0.001), with an overall classification accuracy (85.0%), albeit a little higher for girls (92.4%) compared to boys (75.9%). An alternative model was conducted using a backward stepwise method, with no significant material changes in the results. Table 4 shows the main results of the final regression model for comparing screen habits of girls and boys.
Correlates of PIU
Regarding factors that could potentially impact PIU (Table 5), we found no meaningful associations with demographic variables. Interestingly, there was a significant association between the IAT score and the presence of chronic disease, with those who had a chronic disease reporting a lower score than those who had not (p=0.038, Cohen’s d=0.32). The regular practice of sports also appeared to be a protective against PIU, as those who consistently engaged in physical activity scored lower than those who were not (p=0.036, Cohen’s d=0.32). Amongst other extracurricular activities and habits, alcohol use appeared to have an association with PIU, though it did not reach significance (p=0.055, η2=0.048). The most meaningful PIU associations were with screen devices and related habits. IAT scores increased accordingly to the number of hours per day of use of all screen devices such as TV (p=0.017, η2=0.060; moderate-to-large effect size), mobile devices (p<0.001, η2=0.108), videogame (p=0.002, η2=0.089), and computers (p<0.001, η2=0.139). Moreover, the IAT score was significantly associated with watching TV (p=0.009, η2=0.066) and using mobile devices during meals (p<0.001, η2=0.201). Finally, high scores at the IAT were associated with engagement in social networks (p=0.005, Cohen’s d=0.43) and neglect of extracurricular activities (p<0.001, η2=0.157) (Table 5).
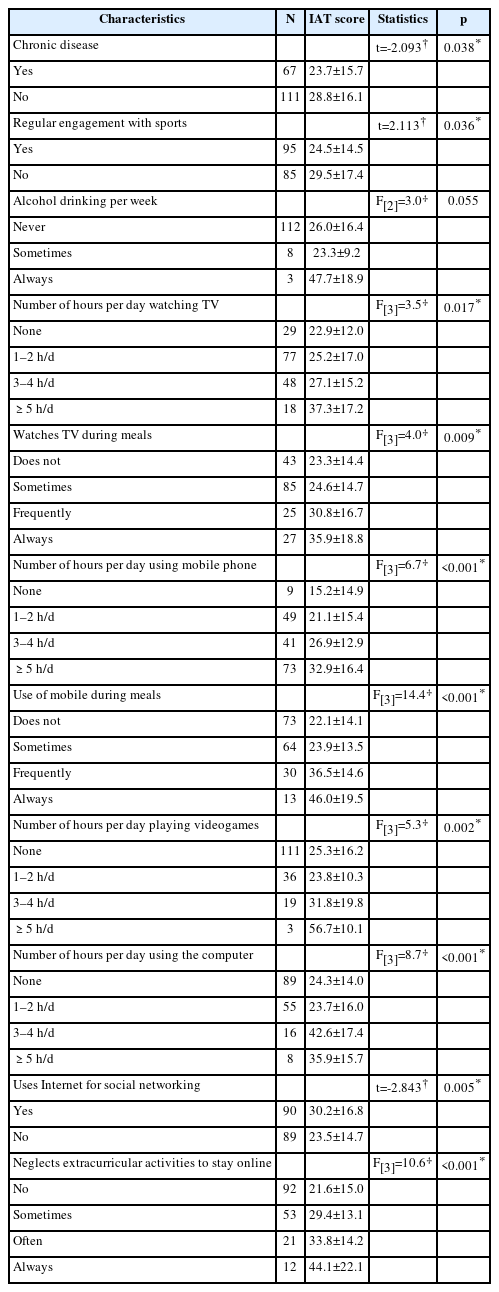
Association between health factors, screen habits, and the Internet Addiction Test (IAT) score
Multiple linear regression
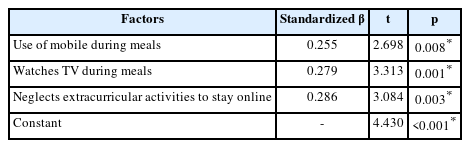
The variables that were statistically significant with the IAT score were entered into a linear regression model in a forward stepwise fashion. The final model (Table 6) was significant (p<0.001), but with a limited proportion of variance (31.5%) (R2=0.315). The factors remaining in the final model were use of mobile during meals (β=0.255, p=0.008), watching TV during meals (β=0.279, p=0.001) and neglect of extracurricular activities to stay online (β=0.286, p=0.003) (Table 6). An alternative model was also built using a backward stepwise method for the factors introduced in the model. The final model was similar to the first (R2=0.386, F[6,100]=10.48, p<0.001), however three additional variables remained including number of hours per day playing videogames (β=0.190, p=0.024), use of Internet to enter social networks (β=0.182, p=0.032), and number of hours per day watching TV, which approached significance (β=0.137, p=0.099).
DISCUSSION
The main goals of the present study were to compare screen and other extracurricular habits among girl and boy adolescents in addition to investigating their potential relationship with PIU. The demographic profiles of boys and girls were similar, with minor differences in age and education. When referring to general screen use no differences were found. However, being a boy was associated with a 27-fold increase in the amount of time playing video games per day, which is in line with previous findings in the literature [16].
There were no significant differences in IAT scores between boys and girls, suggesting that PIU was not associated with gender in our sample. This finding is in contrast with most of the literature suggesting that boy adolescents are at increased risk for developing PIU [21,22]. But then again, most studies reporting greater frequency of Internet-related problems in boys compared to girls fail to discriminate between PIU, IGD, and gaming related problems. While there are valid arguments to approach PIU as an “umbrella” term most authors now emphasize that PIU and IGD are different constructs, perhaps representing different nosological entities [37]. When comparing PIU and IGD, IGD is associated with boy gender and greater time spent playing games, while PIU is associated with online chatting and social networking, which is in line with our findings [38]. Indeed, our study found gender differences within specific Internet behaviors. For instance, girl adolescents were more likely to use the Internet to communicate with their friends, and boys were more likely to play games. These specific findings were both consistent with existing research on gendered Internet use habits [16]. These results were consistent in our multivariate analyses.
We also identified gender differences in extracurricular activities. In this study, boy adolescents spent more time regularly engaging in sports (two-thirds active) compared to girls (two-thirds inactive) which is consistent with previous literature [17]. In contrast, girls were more likely to report being in a relationship (three times more), which is consistent with them being more social. These findings were also supported in the regression model which suggested that girls are five times as likely to use the Internet for socializing compared to boys. However, it is worth noting that this finding may be impacted by the slightly older average age of girls in this sample compared to boys and therefore more advanced puberty as well. Although there were no differences between boys and girls in their neglect of extracurricular activities due to screen time, nearly half the sample (48.3%) indicated that they did it occasionally.
In terms of the relationship between PIU and screen-related habits, using mobile devices during meals and watching TV during meals were both significant predictors of PIU. These results are supported in the literature by Martins et al. [39], who found that adolescents who use the Internet during meals are three times more likely to have PIU. The third main predictor of PIU in this sample was neglecting offline extracurricular activities in favor of online activities. In the alternative backward stepwise linear regression, dedication to video games and social media also remained in the final model. This finding, combined with the previously described differences between boys and girls reinforces the perception that, although we did not find any difference in the IAT score between gender, PIU may be present within the context of certain Internet behaviors, which may be dependent on gender.
Finally, it is worth noting that there was a small-to-moderate effect between the occurrence of chronic diseases and a lower score on the IAT. This factor was ultimately not included in the final regression model so any conclusion about the robustness of this association is speculative. Previous research suggests that involvement in sports and physical activity can protect against PIU [10]. Though the regular practice of physical activity was negatively associated with PIU at the univariate level in this study, it did not significantly contribute to the final regression model. However, the popularity of sports activities among boys suggests that they should be further explored as a strategy to promote time away from the screen and thus prevent complications from their overuse, including PIU.
The present study has several limitations worth noting. The first limitation is the use of convenience sampling methods which can impact generalizability. A potential limitation is the use of the IAT as an instrument for measuring PIU. Though the IAT is still the most widely used test for this purpose, it may be considered outdated (mention of email use etc.) and not representative of the more common Internet behaviors today. Having said that, we used the IAT to assess PIU given that it was the only instrument validated in Brazilian Portuguese [26] at the time the sample was collected. Moreover, the current study used a questionnaire composed of items derived from other instruments, only some of which were validated for use in Brazil. Finally, the degree of variance in PIU accounted for in the final regression model suggests that there are more factors at play to explain PIU in adolescents. Some examples may include psychiatric comorbidities such as affective disorders, anxiety, depression, and attention-deficit hyperactivity disorder [33], in addition to family dynamics and expanded psychosocial context [39,40]. Further, it is important to note that the data used in this study was collected prior to the coronavirus disease-2019 (COVID-19) pandemic. The lockdown measures and implications of social isolation as a result of COVID-19 pandemic are likely to impact Internet use behavior. Finally, the cross-sectional nature of the study design prevents the establishment of causal inferences between the PIU and associated factors.
In conclusion, understanding nuances between boy and girl adolescents across Internet behaviors addresses a gap in the literature identified by Su et al. [16], who stress the importance of examining different types of PIU behaviors rather that exclusively assessing PIU as a whole. Though the results of this study ultimately suggest that PIU is comparable between boy and girl adolescents, they also demonstrate the nuance in the impact of gender on Internet use. Specifically, patterns of Internet use and differences in motivation were identified between genders. Moreover, PIU was associated with increased screen time and neglect of extracurricular activities. Therefore, these findings can serve to inform the development and implementation of prevention measures to protect against PIU and guide future guidelines for a healthy usage of screen devices.
Notes
Availability of Data and Material
The data underlying this present research will be made available upon request. To request data, please email the Faculty of Medicine at University of São Paulo’s Ethics Board (email: cappesq@hcnet.usp.br). The data has not been uploaded in a public repository.
Conflicts of Interest
The authors have no potential conflicts of interest to disclose.
Author Contributions
Conceptualization: Sheila Rejane Niskier, Hermano Tavares. Data curation: Sheila Rejane Niskier. Formal analysis: Hermano Tavares, Hyoun S. Kim. Investigation: Sheila Rejane Niskier, Maria Sylvia de Souza Vitalle, Thiago T. da Silva. Methodology: Sheila Rejane Niskier, Hermano Tavares. Software: Hermano Tavares. Validation: Sheila Rejane Niskier, Hermano Tavares. Writing—original draft: Sheila Rejane Niskier, Lindsey A. Snayshuk. Writing—review & editing: Hermano Tavares, Hyoun S. Kim, Sheila Rejane Niskier, Lindsey A. Snaychuk.
Funding Statement
None