Temperament Clusters in Patients With Panic Disorder in Relation to Character Maturity
Article information

Abstract
Objective
This study explored whether temperament profiles are associated with psychological functioning and whether character maturity affects this association in patients with panic disorders (PD).
Methods
A total of 270 patients with PD were enrolled in this study. Measurements included the Temperament and Character Inventory-revised-short (TCI-RS), a self-report version of the Panic Disorder Severity Scale (PDSS-SR), Beck Depression Inventory-II (BDI-II), and Spielberger State-Trait Anxiety Inventory (STAI). Cluster analysis was used to define the patients’ temperament profiles, and the differences in discrete variables among temperament clusters were calculated using a one-way analysis of variance. An analysis of covariance was conducted to control for the impact of character maturity on psychological functioning among clusters.
Results
We identified four temperament clusters of patients with PD. Significant differences in the PDSS-SR, BDI-II, STAI-state, and STAI-trait scores among the four clusters were detected [F(3, 262)=9.16, p<0.001; F(3, 266)=33.78, p<0.001; F(3, 266)=19.12, p<0.001; F(3, 266)=39.46, p<0.001]. However, after controlling for the effect of character maturity, the effect of cluster type was either eliminated or reduced ([STAI-state] cluster type: F(3, 262)=0.94, p>0.05; SD+CO: F(1, 262)=65.95, p<0.001, ηp2 =0.20).
Conclusion
This study enabled a more comprehensive and integrated understanding of patients by exploring the configuration of all temperament dimensions together rather than each temperament separately. Furthermore, we revealed that depending on the degree of character maturity, the psychological functioning might differ even within the same temperament cluster. These results imply that character maturity can complement inherently vulnerable temperament expression.
INTRODUCTION
Panic disorder (PD) is characterized by recurrent, unexpected panic attacks or episodes of intense fear or discomfort, with at least four of thirteen additional symptoms [1]. Approximately 2%–5% of people suffer from PD, and its prevalence and healthcare expenditures have gradually increased in recent years [2,3]. The Korean National Health Insurance Service reported that the annual number of patients with PD has sharply increased (50,814 in 2010 and 120,366 in 2016), and the associated cost burden has essentially doubled from 15 billion KRW in 2010 to 34 billion KRW in 2016 (Health Insurance Review & Assessment Service, 2010–2016) [4].
Patients with PD vary in the frequency and severity of their panic symptoms, and many researchers have suggested that symptomatic variation and heterogeneity may depend on the association between PD and personality [5-11]. Powers and Westen found that personality constellations in patients with PD showed substantial incremental validity in predicting adaptive functioning and treatment response above and beyond the Diagnostic and Statistical Manual of Mental Disorders-Fourth Edition (DSM-IV) Axis I diagnoses [10]. According to Ozkan and Altindag [12], patients with PD and comorbid personality disorders exhibited more severe symptoms of anxiety, depression, and agoraphobia. Moreover, the age of onset was younger, along with lower levels of functioning. These results suggest that considering comorbid personality disorders or traits is crucial to predict prognosis and plan treatment for patients with PD.
The evaluation of personality pathology is another important issue. Most studies evaluating personality constellations in patients with PD used a categorical approach. For example, Ozkan and Altindag [12] found that high rates of Cluster B and C disorders are common in patients with PD, particularly borderline and dependent personality disorders (22.7%). In this study, personality disorder diagnoses were classified qualitatively and categorically. However, this categorical approach has been criticized, and dimensional models of personality disorders are considered superior to categorical models, particularly for research purposes [7,13,14]. Among various alternative dimensional models proposed for personality disorders, Cloninger’s psychobiological model has received considerable empirical support [7,15]. This model consists of four dimensions of temperament (novelty seeking, NS; harm avoidance, HA; reward dependence, RD; and persistence, P) and three dimensions of character (self-directedness, SD; cooperativeness, CO; and self-transcendence, ST).
In PD, Cloninger’s model has been tested using inventories such as the Tridimensional Personality Questionnaire (TPQ) and the Temperament and Character Inventory (TCI). Most studies using the TPQ—which refers to the first conceptualization of Cloninger [16] and evaluates only temperament dimensions—have found high levels of HA in PD patients [17-21]. Several studies using TCI have confirmed higher levels of HA and lower levels of SD in these patients compared to those in the control group [6,11]. However, although these studies have revealed a difference in the distinct temperament dimensions between the PD and control groups in terms of statistical methodology, no studies have investigated the impact of temperament clusters on the occurrence of PD subtypes. In particular, to the best of our knowledge, character dimensions have rarely been analyzed or interpreted to understand the personality of patients with PD.
In this study, we explored whether temperament profiles determined by cluster analysis are associated with psychological functioning and whether character maturity affects this association in a sample of patients with PD.
METHODS
Participants
We retrospectively reviewed the available electronic medical records of consecutive patients diagnosed with PD. This study included patients diagnosed with PD who visited an outpatient clinic or were hospitalized between October 2018 and December 2019. A clinician diagnosed PD based on the Diagnostic and Statistical Manual of Mental Disorders-Fifth Edition. Patients under the age of 18 were excluded. Individuals with comorbid anxiety disorders, depression, or personality disorders were included only if their symptoms of PD were significant. Patients with other major psychiatric or neurological disorders were excluded from the study. A total of 270 participants met the inclusion criteria, and all data were deidentified and analyzed anonymously. This study was approved by the Institutional Review Board of Konkuk University Medical Center (IRB number: KUMC 2021-03-035), and the requirement for written informed consent was waived due to the retrospective nature of the study.
Measures
The Temperament and Character Inventory-revised-short
The Temperament and Character Inventory (TCI), originally developed by Cloninger et al. [15], consists of two interrelated domains: temperament and character. Temperament, which reflects the biological, innate part of the personality, is four-dimensional: 1) behavior in relation to new or pleasure-producing stimuli (NS); 2) behavioral inhibition in relation to issues that may lead to negative consequences (HA); 3) continuation of behavior that has been successful in the hope of reward (RD), and 4) tendency to maintain certain behavior despite frustration (P). Meanwhile, the three dimensions of character mature in adulthood and influence personal and social effectiveness through insight into and learning about self-concept. Self-concepts vary according to the extent to which a person identifies as 1) an autonomous individual (SD), 2) an integral part of humanity (CO), and 3) an integral part of the universe as a whole (ST) [15]. The Korean version of the TCI-revised-short (TCI-RS) is a 140-item self-report questionnaire based on the original TCI and validated for use in Korea [22]. Respondents rated each item on a 5-point scale (0=definitely false to 4=definitely true). Each subscale’s internal consistencies (Cronbach’s alpha) ranged from 0.83 to 0.90 [22]. This study used four temperament dimensions: NS, HA, RD, and P, and three character dimensions: SD, CO, and ST. Furthermore, the sum of SD and CO was calculated and used to identify character maturity [22].
The self-report version of the Panic Disorder Severity Scale
The Panic Disorder Severity Scale (PDSS) measures all PD dimensions, including panic attacks, anticipatory anxiety, panic-related phobias, wellness, symptom severity, and impairment [23,24]. The self-report version of the PDSS (PDSS-SR) is a 7-item self-report scale of PD symptoms (e.g., “During the past week, how much have you worried or felt anxious about when your next panic attack would occur or about fears related to attacks?”) [25]. Items are rated on a 5-point Likert scale ranging from 0 (none) to 4 (extreme). The Korean PDSS-SR demonstrated good reliability in a previous study [26].
The Beck Depression Inventory-II
The Beck Depression Inventory (BDI) is a 21-item questionnaire designed to assess the degree of depressive symptoms in the last two weeks. Each item is rated on a 4-point Likert scale ranging from 0 to 3, with total scores ranging from 0 to 63, with higher scores indicating more severe depressive symptoms. The BDI was originally developed by Beck in 1961 [27] and was revised into the BDI-II in 1996 in response to changes in the DSM-IV criteria for diagnosing depressive symptoms [28]. The psychometric properties of the BDI-II among Korean adolescents show good internal consistency (Cronbach’s alpha=0.89) and strong concurrent validity with the Patient Health Questionnaire-9 (r=0.75) [29].
The Spielberger State-Trait Anxiety Inventory
The Spielberger State-Trait Anxiety Inventory (STAI) is a frequently used measure of anxiety. It was designed to measure the current level of anxiety and the propensity to experience anxiety. The scale consists of 40 statements requiring individuals to rate on a 4-point scale how they generally feel. Concurrent validity with other anxiety questionnaires ranges from 0.73 to 0.85 [30]. We used the Korean version of STAI, which has adequate reliability and validity [31].
Statistical analyses
A two-step cluster analysis was used to define patients’ temperament profiles [32]. Our cluster model used the three temperament dimensions—NS, HA, and RD—and their percentile scores. First, an agglomerative hierarchical cluster analysis was performed to obtain each cluster’s initial groupings and starting points (cluster means) for each cluster. The squared Euclidean distance was used to measure the distance between individual observations of the clustering variables. Ward’s minimum variance method, which tends to derive more equally sized groups, was used to form clusters [33]. The number of clusters was selected based on the rescaled distances evident in the hierarchical cluster dendrograms, the percentage change in the agglomeration coefficients at each step of the cluster analysis, and conceptual considerations [32]. Four distinct pattern profiles were generated. In the second step of the cluster analysis, the cluster means (centroids) from the hierarchical four clusters were submitted to a nonhierarchical, k-means cluster analysis to refine the initial cluster solution and reduce the risk of cluster misassignment common with hierarchical cluster methods [34].
Following cluster analysis, the differences in discrete variables (PDSS-SR, BDI-II, and STAI scores) among the temperament clusters were calculated. One-way analysis of variance (ANOVA) was performed along with Scheffé’s post hoc test to investigate whether there was a significant difference among the four clusters. Subsequently, configurations of temperament clusters and character maturity covariants were analyzed using an analysis of covariance (ANCOVA) test. Character maturity was evaluated using a composite score, which is the sum of the SD and CO scales in the character dimension [22]. Furthermore, partial eta squared (ηp2) was employed to examine the effect sizes. We defined the effect sizes as small (ηp2=0.01), medium (ηp2=0.06), and large (ηp2=0.14) effects, according to Cohen [35]. All data analyses were performed using the Statistical Package for the Social Sciences, version 17.
RESULTS
Demographic and clinical characteristics and TCI scales of clusters
Based on the TCI-RS temperament dimension percentile scores, the two-step cluster analysis produced four temperament clusters with a fair overall quality. Scores of temperament dimensions above 70 percentiles mean “high,” and scores below 30 percentiles mean “low.” Figure 1 presents the results of the cluster analysis. Cluster 1 included 79 (29.26%) participants with high HA (89.66±13.72) and low NS (27.75±17.36) and RD (18.38±19.11), which was named a “methodical type (MT).” Cluster 2, with 43 (15.93%) participants, was between the 30–70 percentile in all three temperament dimensions (NS: 38.93±24.53, HA: 39.21±23.32, RD: 59.07±28.02), labeled “flexible type (FT).” Cluster 3 included 68 (25.19%) and was named a “sensitive type (ST)” for high NS (76.81±21.82), HA (82.74±18.77), and RD (80.00±14.42). Cluster 4, including 80 (29.63%) participants, was an “explosive type (ET)” for high NS (85.46±12.19) and HA (91.69±13.34), and low RD (19.00±16.13) (Table 1). This designation is based on the TCI-RS manual [22].

Cluster analysis. Mean percentile score for novelty seeking (NS), harm avoidance (HA), and reward dependence (RD). MT, methodical type (Cluster 1); FT, flexible type (Cluster 2); ST, sensitive type (Cluster 3); ET, explosive type (Cluster 4).

Demographic and clinical characteristics and TCI scales of clusters (N=270)
Comparison of clusters for clinical symptoms
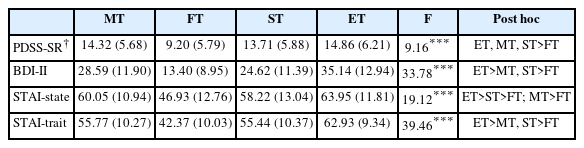
Significant differences in PDSS-SR, BDI-II, STAI-state, and STAI-trait among the four clusters were detected using one-way ANOVA [F(3, 262)=9.16, p<0.001; F(3, 266)=33.78, p<0.001; F(3, 266)=19.12, p<0.001; F(3, 266)=39.46, p<0.001] (Table 2). Concerning the PDSS-SR, post hoc analysis showed that the FT cluster had significantly lower levels than other clusters, indicating that FT patients reported far milder panic symptoms than the others. On the BDI-II, FT patients showed milder depressive symptoms, whereas ET patients had much more depressive symptoms. Regarding state-trait anxiety, patients with FT were much less anxious than other clusters, whereas patients with ET showed much more anxiety. In terms of state anxiety, MT patients felt as anxious as ET patients.
Comparison of clusters for clinical symptoms
In summary, the FT group showed lower overall psychopathology. Depression and anxiety symptoms were milder, and panic symptoms were significantly less severe than in any other cluster. The ET group, characterized by high NS, HA, and low RD, had more severe depressive and anxiety symptoms. The ST group, characterized by high NS, HA, and RD, had lower typical depression and anxiety than in the ET group, but symptoms were worse than in the FT group. The MT group, characterized by high HA and low NS and RD, had more severe depressive and anxiety symptoms than in the FT group.
An ANCOVA was conducted to investigate the impact of character maturity on clinical presentations (Table 3). In the PDSS-SR, the main effect of temperament types remained significant after controlling the effect of character maturity [F(3, 258)=3.35, p<0.05, ηp2=0.04]. In BDI-II and STAI-trait, unlike the result of PDSS-SR, both of the main effects of temperament types [F(3, 262)=4.97, p<0.01, ηp2=0.05; F(3, 262)=4.40, p<0.01, ηp2=0.05] and character maturity [F(1, 262)=66.21, p<0.001, ηp2 =0.20; F(1, 262)=117.81, p<0.001, ηp2 =0.31] were significant. Character maturity had a greater impact than temperament types. Regarding STAI-state, the main effect of temperament type was eliminated after controlling for the effect of character maturity [Cluster type: F(3, 262)=0.94, p>0.05, SD+CO: F(1, 262)=65.95, p<0.001, ηp2 =0.20]. These results show that even patients with PD belonging to the same temperament cluster may have different psychological functions depending on the degree of character maturity.
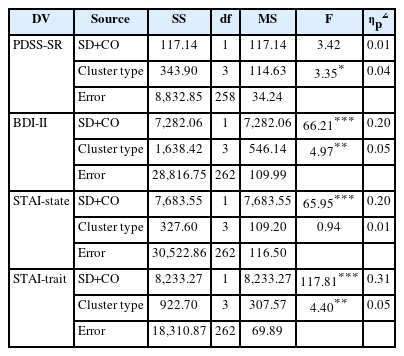
Results of ANCOVAs examining effects of the character maturity along with clusters
DISCUSSION
In the present study, we identified four temperament clusters of patients with PD: FT, ET, ST, and MT. The severity of panic symptoms, depressive mood, and anxiety varied depending on the temperament cluster. The FT cluster showed milder depression and anxiety, and panic symptoms were significantly less severe than that in the other clusters. The ET cluster had more severe depressive and anxiety symptoms than in the other clusters. However, after controlling for the effects of character maturity, the effect of temperament type was either eliminated or reduced. Moreover, character maturity explains a substantial proportion of depression and anxiety in patients with PD.
These results are consistent with those of Choi [36], who explored temperament types in depressive disorders. She identified four temperament types (alienated cowardly, flexible, sensitive, and explosive) and revealed that even the same depressive disorder had different clinical patterns depending on the temperament type. While most studies using the TCI found differences in distinct temperament dimensions between the PD and control groups, Choi’s study and this one are valuable because we analyzed individual profile data on all temperament dimensions using cluster analysis. Exploring the configuration of all temperament dimensions rather than each temperament separately enables a more comprehensive and integrated understanding of patients. Choi’s results, like ours, showed three clusters, with high levels of HA, except for FT, which were more adaptive. She suggested that HA is a predisposition to depression, and our findings showed that it also plays an important role in PD progression. “High HA” level may be an important common etiological factor for depression and anxiety [36-38].
Most studies, including Choi’s, focused only on temperament. They all compared the distinct dimensions between patient and control groups, even if character was studied [6,11]. They conceptualized temperament and character as separate categories and did not consider their interrelations. However, we found an interaction between temperament and character by measuring character maturity with composite scores of SD and CO. We discovered that even within the same temperament cluster, psychological functioning might differ depending on the degree of character maturity. These results demonstrate Cloninger’s psychobiological model, in which personality development is not influenced solely by temperament, but that temperament and character interact. Cloninger et al. suggested that the configuration of temperament dimensions defines the so-called temperament type, thereby, the type of personality disorder [15,22,39]. If a subject shows extremely high or low scores in one or more temperament dimensions, the probability of having a personality disorder increases. If an individual shows such extreme expressions on temperament dimensions, it is likely that he or she has an immature character in terms of low SD and/or low CO and is unable to cope with or control the inconsistencies and extreme behaviors caused by extreme temperament. Character maturity indicates whether an individual has a personality disorder, and temperament configuration determines the type of personality disorder. Cloninger’s assumption of the importance of low SD and CO as substantial constituents of personality disorders corresponds with the suggestion of Fonagy et al. that individuals with personality disorders have an impaired mentalizing capacity, implying an impaired ability to make sense of their own and others’ mental states, causing problematic interpersonal relationships and impairments in self-development [39,40]. This discussion has meaningful therapeutic implications considering that temperament is determined by inherited traits, whereas character is influenced by experiences that grow and change throughout life. Character growth can improve psychological wellness even if a patient has a temperament that predisposes them to mental health problems. In the clinical setting, character maturity should be promoted to treat personality vulnerabilities.
This study had several limitations. First, the data were collected cross-sectionally. The cross-sectional design did not allow for a definitive conclusion as to whether the TCI score was a premorbid trait or a result of the illness. Although TCI is reported to evaluate a relatively independent dimension of mental illness, it is difficult to rule out the possibility that the current symptoms affected the reporting of temperament and character. Second, this study did not consider or control for comorbid disorders that could affect various aspects of PD, particularly personality disorders. Factors such as the type of drug, frequency of recurrence, and the age of onset were also not considered.
Despite the limitations mentioned above, to the best of our knowledge, this is the first study to use cluster analytic techniques to investigate the association between temperament and character maturity in patients with PD. These results imply that character maturity can complement inherently vulnerable temperament expression. As characters can mature throughout adulthood, we propose that psychotherapy to improve character maturity will alleviate the symptoms of patients with PD.
Notes
Availability of Data and Material
The datasets generated or analyzed during the study are not publicly available as they are owned by Konkuk University Medical Center and contain personal information, but are available from the corresponding authors on reasonable request.
Conflicts of Interest
The authors have no potential conflicts of interest to disclose.
Author Contributions
Conceptualization: Seolmin Kim. Data curation: Doo-Heum Park, Seung-Ho Ryu, Jee Hyun Ha. Formal analysis: Doo-Heum Park, Seung-Ho Ryu, Jee Hyun Ha. Investigation: all authors. Methodology: Seolmin Kim. Project administration: Hong Jun Jeon. Supervision: Hong Jun Jeon. Writing—original draft: Seolmin Kim, Sumin Hong. Writing—review & editing: Hong Jun Jeon.
Funding Statement
None