Healthy and Unhealthy Dietary Patterns Are Related to Depression: A Case-Control Study
Article information
Abstract
Objective
Major depressive disorder is the leading cause of disability around the world. The relationship between depression and dietary patterns has been reported in a few studies but with controversial results. This study aimed to investigate this relationship in an Iranian population.
Methods
In our study, 330 depressed patients (cases) and healthy people (controls) (1:2) were individually matched according to age, sex and area of residence. New cases of depression were recruited from two psychiatric clinics in Tehran. Interviewers went to each patient's residential area, and invited qualified individuals to participate in the study as controls. Food intake over the past year was collected using a validated semi quantitative food frequency questionnaire. Dietary patterns were determined by the principal components method. Binary logistic regression was used to test the effect of dietary patterns on depression.
Results
We identified two major dietary patterns by using factor analysis: the healthy and unhealthy dietary patterns. We categorized the scores of these patterns to quartiles. After adjusting for non-depression drug use, job, marital status, children number, and body mass index, the relations of depression and quartiles of two dietary patterns are significant (p=0.04 & p=0.01, respectively). Compared with participants in the lowest quartile, those in the highest quartile had significantly lower odds ratio (OR) for depression in healthy dietary pattern, and higher OR for depression in unhealthy dietary pattern.
Conclusion
This study indicates that healthy and unhealthy dietary patterns may be associated with the risk of depression. The results can be used for developing interventions that aim to promote healthy eating for the prevention of depression.
INTRODUCTION
As a leading cause of disability around the world, depressive disorder affects 121 million people, approximately.1 Depression, based on WHO report, is the fourth most common global burden of all diseases, which might turn into the second most common global burden by the year 2020.23
Major depression contains five of the following symptoms, for at least 2 weeks: sad or blue, feeling depressed; increased or decreased sleeping; absence of interest or enjoyment; increased or decreased appetite together with weight change; feeling of worthlessness or guilt; feeling agitated, feeling unsettled or slowness; low energy; difficulty in concentration; and feeling that life is worthless or suicidal actions.4 The depression risk factors are gender, family history of affective disorders, socioeconomic status, no social support, drug abuse, childhood physical or sexual abuse history, parental loss before the age of 10, gonadotrophin stimulation for infertility treatment in women, oral contraceptives use in women, stress, genetic backgrounds, medical illnesses such as vascular brain changes, cancer, diabetes, and malnutrition.45
The rate of success for depression drug therapy of is estimated at 60-80%. Moreover, maximum 25% of all depressed patients receive drug therapy.1 Due to poor medication compliance in depressed patients, and high rate of recurrence, nutrition related factors might have an important role in the prevention and treatment of major depression.2
The relationship between depression and inadequate nutrient intake has been reported in many studies.2 For example, tryptophan,6 B vitamins group,789 magnesium,1011 zinc,12 Omega 3 long chain polyunsaturated fatty acids.131415
The association between diseases and single or multiple nutrients is the main focus of traditional analyses in nutritional epidemiology. This type of analysis is relatively valuable, but methodologically, it has several limitations. People do not consume one nutrient at a time. The various combinations of nutrients in foods may have diminishing or exacerbating effects. Besides, the effect of a single nutrient may be hard to detect, while at the same time, the collective effects of some nutrients in a dietary pattern are easily measurable. Moreover, single nutrient analysis usually changes by the effect of dietary patterns.16 Furthermore, because of the interaction between dietary components, adjustment for these factors in multivariable analyses may not eliminate all their confounding effects.17
The main focus of this study is to investigate the relationship between depression and dietary patterns, rather than one or more specific nutrients.18 Among different countries, a few studies have shown an association of their diverse dietary patterns with an increased risk of depression,192021 but with controversial results.1920 Moreover, regarding the effects of racial, geographic, environmental, cultural, and social conditions on the relationship between dietary pattern and depression, it is crucial to perform these investigations in various countries.22 Besides, advising people to follow a special dietary pattern seems more feasible than to intake a specific nutrient, such as vitamin D or folic acid. Therefore, in this study, we decided to compare dietary patterns between depressed and healthy people.
METHODS
Study population
We used a case-control observational design. Patients were diagnosed by psychiatrists as major depressive disorder, using the criteria of the Diagnostic and Statistical Manual of Mental Disorders, fourth edition (DSM-IV)23-standardized in Iran24-with no history of depression in the past year. We selected the patients according to our inclusion and exclusion criteria, recruited from two psychiatric clinics in Tehran. For the control group, our criteria was the lack of major depression disorder, based on Beck Depression Inventory questionnaire (BDI-II),25 standardized in Iran.26 They should not have history of depression in the past year. Interviewers went to each patient's residential area, and invited qualified individuals to participate in the study.
The matching of patients with controls was done individually, based on sex, age, and residential area. Each patient with depression was matched with two control people within 10-year age categories. The inclusion criteria were people of 18-65 years, residing in Tehran, with major depressive disorder in patients, and without depression in control group, maximum period of 3 month intervals from onset of five symptoms of depression to the beginning of the study. The exclusion criteria were as follows: suffering from cognitive impairment or other psychotic illnesses diagnosed by a psychiatrist, severe depression or lacking ability to cooperate and answer the questions, starting any anti-depression drugs or treatments, suffering from hormonal disorders like Addison's, Cushing's disease, hyperthyroidism or hypothyroidism, and hyperparathyroidism, suffering from chronic diseases like cancer, heart disease, diabetes, stroke, fibromyalgia, kidney or liver failure, multiple sclerosis and Parkinson disease, history of trauma, cuts, fractures, bleeding, burns, accidents and other similar events in the past 3 months, that resulted in unconsciousness and hospitalization, suffering from chronic and infectious diseases like HIV, mononucleosis, tuberculosis, viral hepatitis and pneumonia in the past 2 weeks, addiction to alcohol and drug at the time of the study or in the past 3 months, BMI ≥40 kg/m2, pregnancy and lactation at the time of the study or in the past year, using any type of special diet in the past 2 months, and using any type of special diet for more than 2 months in the past year.
Sample size was calculated as 110 depressed subjects and 220 control subjects, using the software open Epi, with two sided confidence.2728 The investigators provided subjects with all related information, understandable to the subjects. A written informed consent form was signed and dated by subjects and investigators. This study has been approved by the Ethics Committee of Tehran University of Medical Sciences.
Assessment of covariates
A general questionnaire was used for collecting general information, and data on medication use and some confounders. Anthropometric measurements, including weight, height and BMI were done for all participants. Beck Anxiety Inventory, standardized in Iran,29 was used for a quantitative measure of anxiety as a confounder. A classified physical activity questionnaire, based on the metabolic equivalent hours per day (MET-h/day), was utilized. This consists of nine levels of activity, from rest and sleep (MET=0.9) to vigorous activity (MET ≥6). The questionnaire has been prepared in previous studies in Europe and was validated with the daily physical activity questionnaire and the CSA Accelerometer (Model 7164 Ambulatory Monitor).30 Validity and reliability of the questionnaire have been confirmed in the study of Kelishadi et al. in Iran.31 A valid and reliable semi-quantitative food frequency questionnaire was applied to determine food intake in the previous 12 months.32 Data from the questionnaire was transformed into actual food intake (g/day).
Statistical analysis
Simple logistic regression was used to examine the relationship between depression and the characteristics of individuals, such as physical activity, BMI, and other variables. Dietary patterns determined by exploratory factor analysis. We entered extracted food groups into the factor analysis and used a principal components method to determine number of factors or dietary patterns. We used orthogonal varimax rotation to identify major dietary patterns, based on number of food groups. To determine the number of dietary patterns, we used the eigenvalue and Scree plot. The Scree plot is a plot of the eigenvalues of derived factors and its value was equal to 1.5. The factor score for each pattern was calculated by summing intakes of food groups weighted by their factor score matrix. The derived factors (two dietary patterns) were labeled on the basis of our interpretation of the data and of the earlier literature.
Since each participant received a factor score for each explored dietary pattern, we categorized participants into quartiles of dietary pattern scores. To determine the associations of depression with quartile of dietary patterns, we used simple logistic regressions and estimated ORs. The first quartile of dietary patterns score was considered as a reference. Subsequently, we developed multiple logistic regression model, and the relationships of dietary patterns to depression were adjusted by the confounders that had p values <0.2 in simple logistic regression. We checked a goodness of fit by using Hosmer and Lemeshow Test, simultaneously.
RESULTS
In this study, we extracted two dietary patterns (healthy and unhealthy). We considered qualitative and quantitative variables, and potential risk factors as confounders. Age (p=0.9) and sex (p=0.8) were not different between two groups, because we matched cases and controls based on these variables. There was no significant difference between two groups, in family size, birth rank, years of education, smoking cigarettes and hookah per week, weight, height, marital and menopausal status, roommate addicted to alcohol, depressed friend, and daily energy intake. However, other covariates were significantly different among case and control groups (Table 1 and 2). The mean of physical activity and years of education in patients were less than in healthy people, but the mean of previous depression morbidity and anxiety score in patients were more than in healthy people. The frequency of family history of depression, childhood history of traumatic events, history of evil events in the last 6 months, and non-depression drugs intake in patients were more than in healthy people. Depression risk is the least in the families with 2 children compared with families with 0, 1 and ≥3 children. In addition, this risk is the most in subjects with periods of unemployment more than 6 months in the last 5 years, and in house workers and retired participants. Moreover, a decreased depression risk was found by increasing BMI.
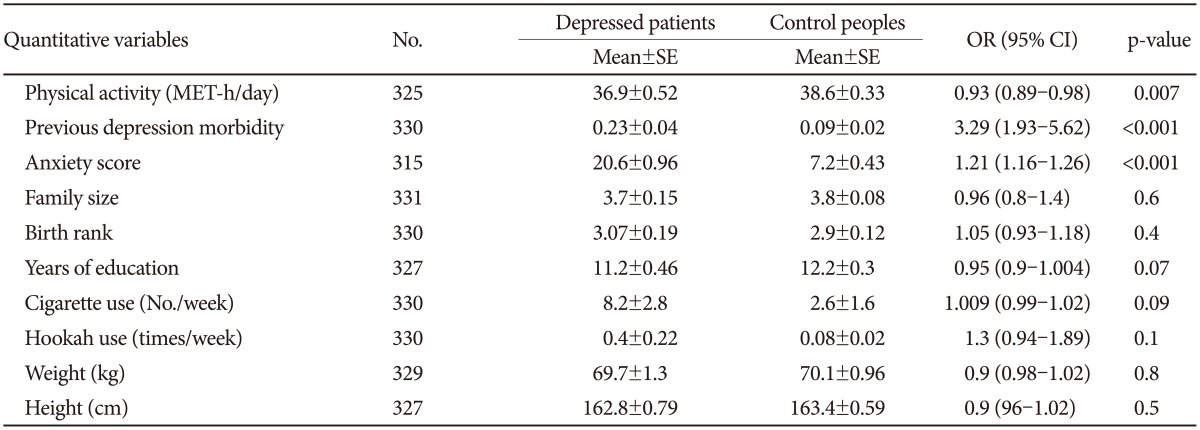
Simple logistic regression results for testing relation between depression and covariates

Simple logistic regression results for testing relation between depression and covariates
We defined 26 food groups (Table 3), and assigned each food item in these groups, on the basis of nutrients content similarities. By using factor analysis, we identified two major dietary patterns: the healthy dietary pattern (high in fruits, cruciferous, yellow, green leafy and other vegetables, low fat dairy, whole grains, nuts, and olives) and unhealthy dietary pattern (high in refined grains and breads, high fat dairy, solid oils, liquid oils and mayonnaise, pickle, snacks, soft drinks, industrial fruits and juice, red meats, poultry, processed meats, sweets). The factor-loading matrixes for these dietary patterns are shown in Table 4.
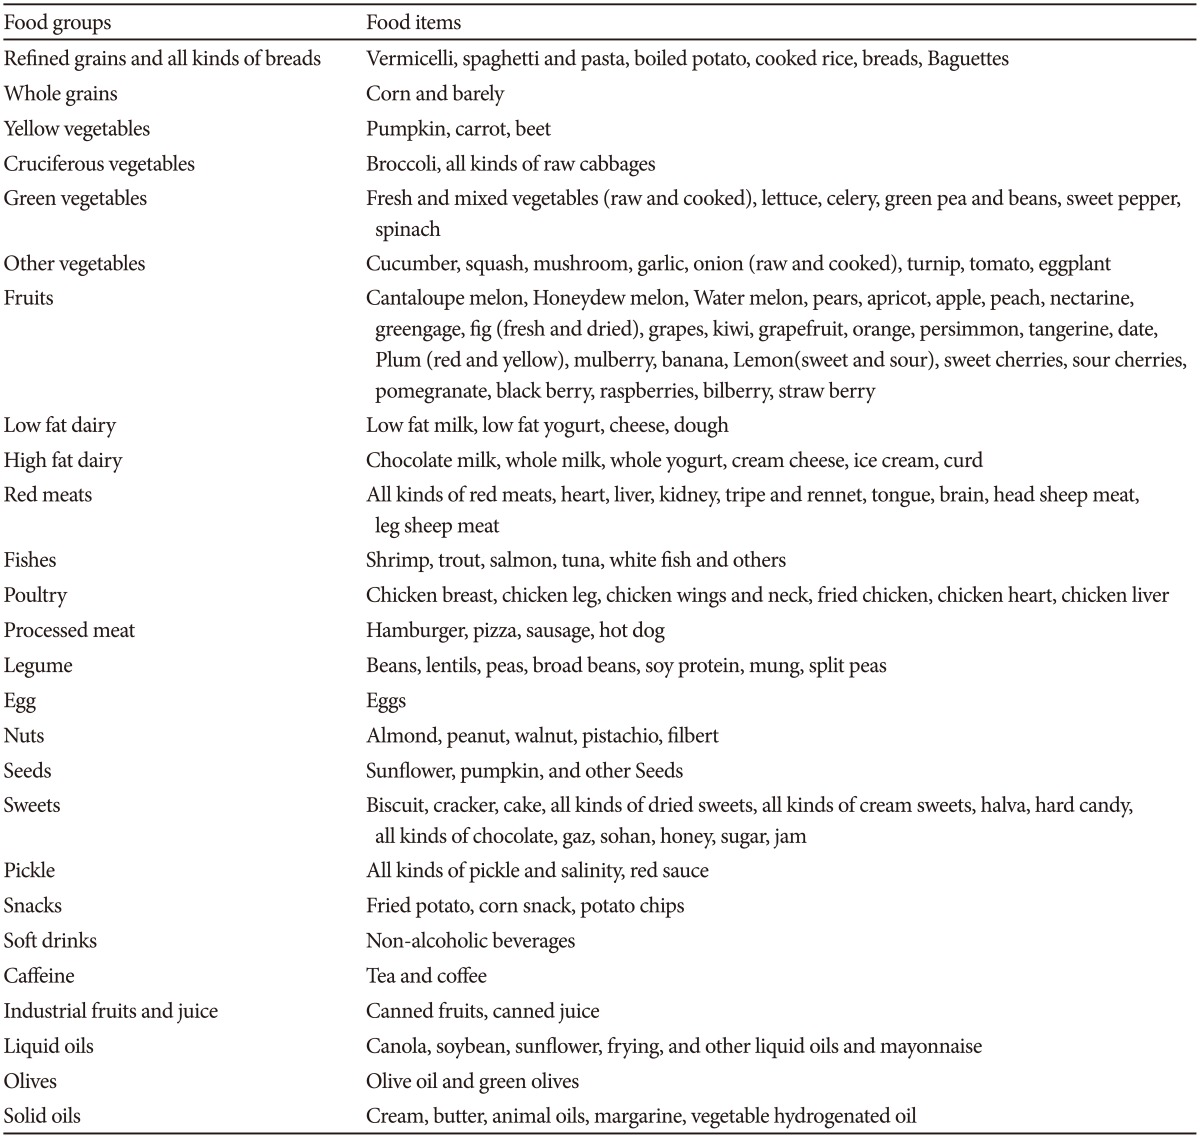
Food grouping used in the dietary pattern analyses
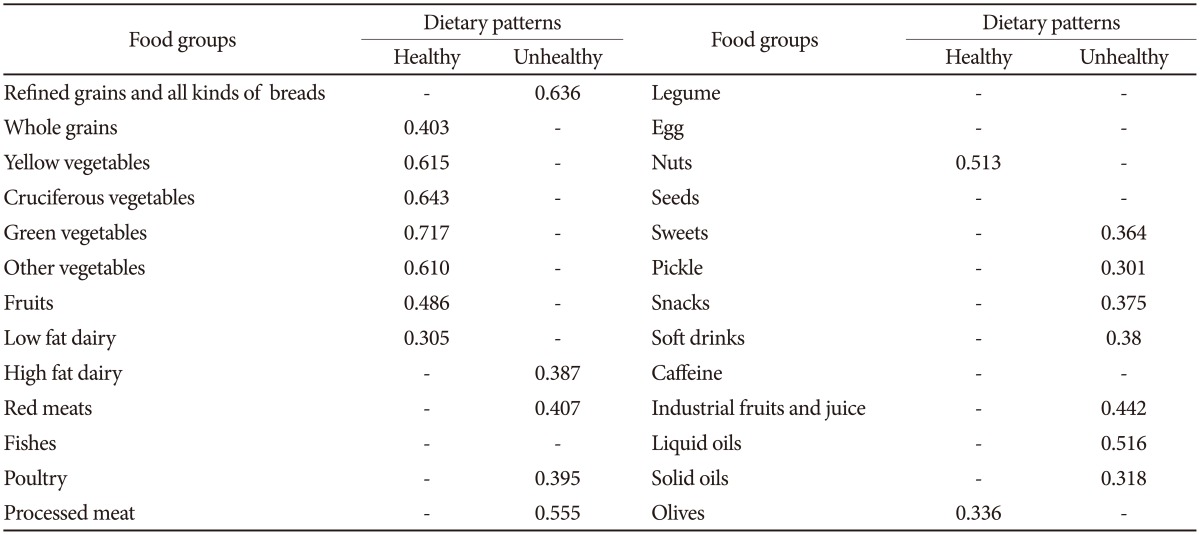
Factor loading matrix for major dietary patterns
Compared with participants in the lowest quartile, those in the highest quartile had significantly lower OR for depression in healthy dietary pattern, and higher OR for depression in unhealthy dietary pattern (Table 5). It should be noted that p trend for healthy and unhealthy dietary pattern quartiles are significant (p trend=0.010, OR=0.756, CI: 0.61-0.935 & p trend=0.003, OR=1.382, CI: 1.116-1.71 respectively).
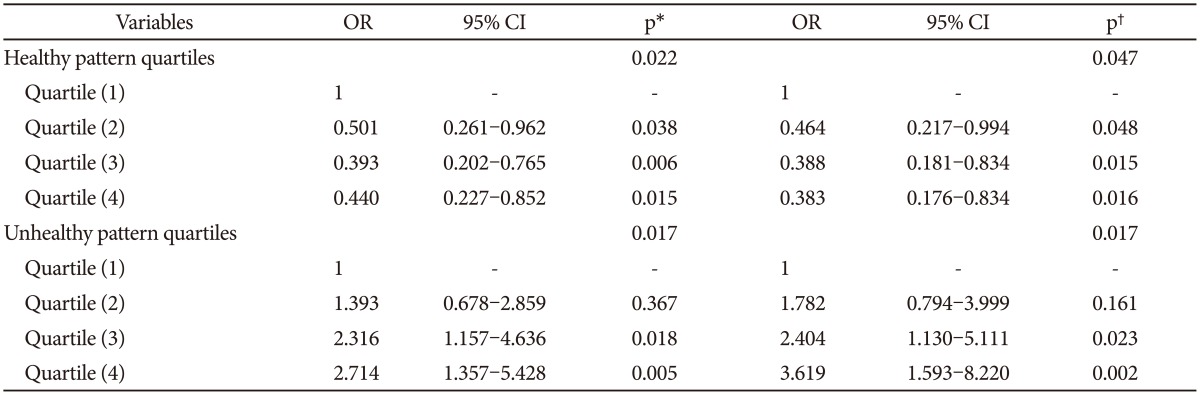
Results for testing the association between depression and quartiles of healthy and unhealthy dietary patterns
All variables with p values<0.2 in simple logistic regression were comprised in multiple logistic regression models, including physical activity, previous depression morbidity, anxiety score, years of education, cigarette use, hookah use, previous history of depression, family history of depression, childhood history of traumatic events, history of evil events in the last 6 months, non-depression drugs intake, having depressed friend, job, periods of unemployment, children number, body mass index, and marital status. This adjusted model remained significant with five of these variables including non-depression drug use, job, BMI, children number, and marital status (Table 5). Hosmer and Lemeshow tests were performed to check goodness of fit (p value=0.8). Moreover, the p trend was significant for healthy and unhealthy dietary patterns, respectively (p trend=0.01, OR=0.73, CI: 0.571-0.940 and p trend=0.002, OR=1.479, CI: 1.149-1.905).
DISCUSSION
We detected two dietary patterns including "Healthy" and "Unhealthy" and studied the association between depression and dietary patterns. We found that the odds ratio of depression was decreased by adhering to healthy dietary patterns, and conversely increased by the consumption of unhealthy dietary patterns.
The content of exploratory dietary patterns is close similar to the results of Rashidkhani study,33 and to some extent in parallel with dietary patterns obtained in other investigations in Iran.3234
In comparison with the investigations in other populations, there was a strong similarity between the content of dietary patterns in the current study and Mediterranean dietary patterns,2035 traditional and western dietary patterns,19 and also dietary patterns whole food and processed food.36 In the cross-sectional study of Crawford37 and the study of Sanchez-Villegas,38 more consumption of fast food was associated with the higher risk of depression.
In spite of all the similarities, fish was not included in any of our dietary patterns, due to the low consumption of fish in our population. In our study, there were some unexpected food groups in each dietary pattern. For instance, since frying oils have high percentages of SFA, and almost all of our participants consumed very high amount of these oils, this food group contains a greater amount of frying oils instead of other beneficial kinds of liquid oils. Therefore, liquid oils food group was included in unhealthy dietary pattern.
In addition, the presence of poultry food group in unhealthy dietary pattern does not mean that poultry are an unhealthy food group by itself. In fact, the individuals who adhere to the unhealthy dietary pattern, along with high intakes of unhealthy foods, eat higher amounts of poultry.33
According to our results and Sanchez-Villegas et al.,20 the red meat was placed in a dietary pattern which accompanied with higher odds of major depression. However, according to Jacka et al.,19 the subjects with traditional diet, which includes red meat, had lower odds of major depression and anxiety as compared to those with the western diet.
This comparison highlights that the interaction between diverse food and nutrients could manipulate the independent effect of red meat. Consequently, this interaction is only observable in case of studying the dietary patterns, not nutrients intake. It also could be the result of cultural, social, and economic differences among people in different communities.28
In the cohort study of Le Port et al.,39 low fat dietary pattern was associated with the higher odds of depressive symptoms. This result is not in consistent with our results and other studies in terms of fat content of foods.19363738 In addition, the type of fat might be an important issue in low fat dietary pattern. Most of healthy dietary patterns with lower probability of depressive symptoms contain olive oil.2021 In Le Port et al. study, olive or olive oil was not considered as a food group. In one prospective study in 2011, there was a dose-dependent and converse significant relation between PUFA and MUFA intake and depression. Subjects with the highest Trans FA intake showed significantly highest risk for depression.40 Therefore, different types of oils should be considered to study the relation between depression and fat intake.
In the cross-sectional studies of Nanri et al.41 and Suzuki et al.42 in Japan, healthy dietary pattern and balanced Japanese dietary pattern were associated with fewer depressive symptoms and depressive and anxiety disorders, respectively.
The common point of the current study and others is the inverse relationship between depression and healthy dietary pattern. According to previous studies, a number of nutrients such as omega 3 fatty acids, vitamins D, E, B6, B12, and folate, magnesium, zinc, iron, copper, calcium, and tryptophan are important in the prevention and treatment of depression, and all of food groups in healthy dietary pattern including vegetables, fruits, dairy products, nuts, olive oil and green olive, fish, legumes and whole grains are rich in these nutrients 2. A specific mechanism is proposed for each nutrient, or a group of nutrients. For example, tryptophan, as a dietary amino acid, is the precursor of brain serotonin. The individuals with lower level of brain serotonin are considered to be vulnerable to affective disorders, such as depression. Synthesis of serotonin is limited by the inaccessibility of tryptophan.44
Omega 3 long chain polyunsaturated fatty acids produce anti-inflammatory eicosanoids, which reduce the levels of pro inflammatory cytokines in depressed patients.45 Also they have a role in brain functioning and serotonin neurotransmission (e.g., providing fluidity to neurons cell membrane).39
The direct effect of nutritional factors on neural physiology is been discussed. In experimental studies, brain-derived neurotrophic factor (BDNF) levels were lowered by an unhealthy diet within a short period of time. This effect was independent of obesity or nutritional deficits. BDNF is assumed to have a central role in depressive illness. It also protects neurons from oxidative stress and encourages the neurogenesis. Therefore, diet may influence psychiatric status through regulation of the BDNF expression.19 In conclusion, an inverse association between depression and healthy dietary patterns is largely expected.
Regarding the relationship between depression and unhealthy dietary pattern, a significant association has been observed in this study and in several other studies, although with few exceptions.1946 The latter might stem from the small amounts of unhealthy foods in these populations.
Unhealthy dietary patterns with high consumption of soda, sweets, and saturated fatty acids and low consumption of vegetables and fruits usually have inadequate amount of folate, magnesium, and n-3 unsaturated fatty acids. These nutrients are beneficial against depression. Besides, these patterns accompany with high levels of trans and/or saturated fatty acids47 and very poor level of dietary fibers,48 which their negative effect is been proven on health.
As the study limitations, like all case control studies, we could not determine the temporal relationship between dietary patterns and depression. Also, we exclude those who were addicted to alcohol. Moreover, due to the cultural limitation, we did not question the rate of alcohol consumption in people with casual drinking.
This study was the first case control study in which the relationship between depression and dietary patterns was evaluated with a sufficient sample size, and adjusted for many confounders and depression risk factors in a developing country. We also recruited the controls from healthy population, instead of clinics or hospitals, and matched them by our patients. We also specified all inclusion and exclusion criteria very carefully.
For future studies, we recommend to focus more on dietary patterns, rather than nutrients intake. In addition to our method, extraction of dietary patterns for future studies could be applied with other methods, such as Reduced Rank Regression (Triple R) and Latent Classification Analysis (LCA).
Acknowledgments
This research has been supported by Tehran University of Medical Sciences & health Services grant No. 19374-161-03-91.