Impairment of Concept Formation Ability in Children with ADHD: Comparisons between Lower Grades and Higher Grades
Article information
Abstract
Objective
We investigated executive functions (EFs), as evaluated by the Wisconsin Card Sorting Test (WCST), and other EF between lower grades (LG) and higher grades (HG) in elementary-school-age attention deficit hyperactivity disorder (ADHD) children.
Methods
We classified a sample of 112 ADHD children into 4 groups (composed of 28 each) based on age (LG vs. HG) and WCST performance [lower vs. higher performance on WCST, defined by the number of completed categories (CC)] Participants in each group were matched according to age, gender, ADHD subtype, and intelligence. We used the Wechsler intelligence Scale for Children 3rd edition to test intelligence and the Computerized Neurocognitive Function Test-IV, which included the WCST, to test EF.
Results
Comparisons of EFs scores in LG ADHD children showed statistically significant differences in performing digit spans backward, some verbal learning scores, including all memory scores, and Stroop test scores. However, comparisons of EF scores in HG ADHD children did not show any statistically significant differences. Correlation analyses of the CC and EF variables and stepwise multiple regression analysis in LG ADHD children showed a combination of the backward form of the Digit span test and Visual span test in lower-performance ADHD participants significantly predicted the number of CC (R2=0.273, p<0.001).
Conclusion
This study suggests that the design of any battery of neuropsychological tests for measuring EF in ADHD children should first consider age before interpreting developmental variations and neuropsychological test results. Researchers should consider the dynamics of relationships within EF, as measured by neuropsychological tests.
INTRODUCTION
The search for accurate and reliable measures of attention-deficit hyperactivity disorder (ADHD) symptoms has not yielded a litmus test, and the heterogeneity of the disorder itself preclude any one test from claiming pinpoint accuracy, and AD-HD-related evaluation incorporates a wide variety of psychological and neuropsychological tests.1 One of the most prominent neuropsychological theories of ADHD suggests that its symptoms arise from a primary deficit in executive functions (EF), defined as neurocognitive processes that maintain an appropriate problem-solving set to attain a later goal. However, moderate effect size (ES) and lack of universal EF deficits among ADHD individuals suggest that EF weaknesses are neither necessary nor sufficient to cause ADHD,2 and furthermore, EF deficits are typical of developmental disorders in general.3 EF develops throughout childhood and adolescence and plays an important role in a child's cognitive functioning, behavior, emotional control, and social interaction. Attentional control appears to emerge in infancy and to develop rapidly in early childhood. In contrast, cognitive flexibility, goal setting, and information processing experience a critical period of development, between 7 and 9 years of age, and are relatively mature by 12 years of age.4 Furthermore, EF, as a concept, has had serious problems,5 and it is not single skill. As a result, an individual's ability to perform the non-executive requirement of a task can contaminate that individual's performance on EF tasks.6 In addition to showing the overall reliability and validity of EF tests' results, it is important to show that not only do specific executive-function tasks differentiate clinical from non-clinical populations, but they effectively discriminate among various clinical populations.7
The facts that not every person with ADHD is impaired on every test and some individuals with ADHD perform within the normal range on all or most measures demonstrate AD-HD heterogeneity. They also show potential moderators of AD-HD neuropsychological heterogeneity are family history, comorbid disorders, ADHD subtypes, and developmental differences.8 Heterogeneity in ADHD9-11 is evident in the expression of the two ADHD symptom domains: neuropsychological impairments and comorbid behavior problems.12 Wåhlstedt et al.12 pointed to the importance of viewing ADHD as a heterogeneous condition with regard to both neuropsychological functioning's and comorbidity's differential impacts on different ADHD symptom groups and the two ADHD symptom domains.
With regard to developmental differences, although there are more than a hundred studies examining neuropsychological functioning in childhood ADHD, there are relatively few studies examined such functioning in ADHD preschoolers, adolescents, and/or adults.13 Although many researchers have extensively studied elementary school-age ADHD children's neuropsychological functioning, such studies have not considered these children's neurodevelopment characteristics.
Given that executive processes are dependent on the frontal lobe systems' integrity, it is likely that EF skills demonstrate functional improvements, which research can align with neuropsychological developments within the prefrontal cortex.4 In this study, EFs showed ongoing developmental functioning, not yet fully developed. Furthermore, some EFs were not yet, or were slowly, developing in lower grades (LG) elementary children as opposed to higher grades (HG) elementary children. Furthermore, we found it suggestive that EF measures had more inter- or intra-differences in LG elementary children than HG elementary children. Therefore, we compared EF, especially concept formation ability, evaluated by the Wisconsin Card Sorting Test (WCST), and established at late childhood, according to neurodevelopment stages of the children. Also, before comparison, we controlled for possible effects of age, gender, comorbid disorders, ADHD subtype, and intelligence between the two groups. Finally, we explored the relationships between WCST performance and other EFs in ADHD children.
METHODS
Participants sampling
We sampled participants from outpatient units in Y University Hospitals in Korea over a period of 3 years, from March 1, 2006 through June 30, 2008. Research psychiatrists diagnosed the participants per the Diagnostic and Statistical Manual of Mental Disorders, 4th edition, Text Revision (DSM-IV-TR) criteria.14 Our inclusion criteria were diagnosis of ADHD and age 7-12 years. Institutional Review Board reviewed and approved the protocol. With regard to ADHD diagnosis, at least two clinicians interviewed the patients to ensure that they met DSM-IV-TR diagnostic criteria for ADHD, as evidenced by the presence of at least 6 of 9 inattention symptoms (with or without 6 of 9 hyperactive/impulsive symptoms) and as ascertained in a semi-structured interview, using a DSM symptom checklist. The study excluded participants who had an intelligence quotient (IQ) below 70, by the Wechsler Intelligence Scale for Children-3rd edition (WISC-III);15,16 a prior history of more than 1 month of ADHD medication treatment; a present or past history of substance abuse or addiction (except nicotine abuse/addiction); a present or past history of psychiatric disease (axis I or II diagnosis other than ADHD); a neurological disease; a medical condition that could alter cerebral functioning (i.e., cardiovascular, endocrinological, oncological, and autoimmune diseases); and/or head trauma with loss of consciousness of more than 30 min.
Group classification and verification of sampling biases
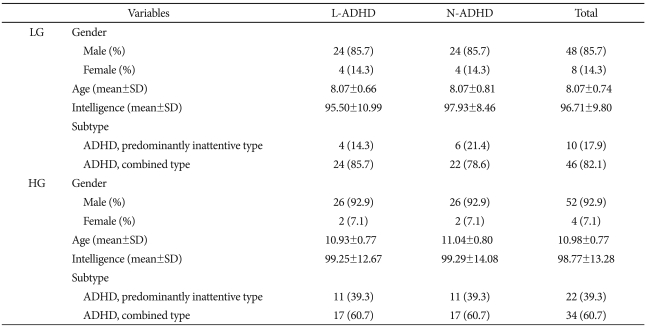
We classified the participants into four groups, based on their number of completed categories (CC) on the WCST and their age (LG 7-9 years vs. HG 10-12 years). WCST performance classification criteria were age-referenced to WCST norm values,17,18 and ADHD participants performing lower in one or more categories than the age reference norm were the lower performance group (L-ADHD). ADHD participants performing the same as the age-referenced norm were the normal performance group (N-ADHD). Finally, we divided participants into the LG and HG. We matched numbers of ADHD participants, mean age, and gender ratio, and ADHD subtype and verified these by statistical analyses.
There were 28 L-ADHD and 28 N-ADHD participants in the LG group, and 4 (14.3%) of the participants in each of these L-ADHD and N-ADHD sections were female. The remainder, 24, were male (85.7%). In the LG group, mean age (8.07±0.74) and intelligence (96.71±9.80) did not vary significantly between the L-ADHD and N-ADHD sections.
With regard to the overall ratio of ADHD subtypes, there were 10 predominantly inattentive-type participants (17.9%); the remainder (46) were combined type (82.2%). The subtype ratio did not vary significantly between L-ADHD and N-ADHD participants.
There were 56 matched participants in the HG group, selected for the same ratio as in the LG group (28 L-ADHD; 28 N-ADHD), and 2 (7.1%) of the participants in each of these L-ADHD and N-ADHD sections were female. The remainder, 26, were male (92.9%). In the HG group, mean age (10.98±0.77) and intelligence (98.77±13.28) did not vary significantly between the L-ADHD and N-ADHD sections.
With regard to the overall ratio of ADHD subtypes, there were 22 predominantly inattentive-type participants (60.7%); the remainder (34) were combined type (60.7%). The subtype ratio did not vary significantly between L-ADHD and N-ADHD participants. In comparing the LG to the HG group, the gender ratio, intelligences, and ratio of ADHD subtypes did not vary significantly; of course, age did (Table 1).
Demographic data
Procedures
All participants completed the behavioral rating scales, Korean Personality Inventory for Children (K-PIC), K-WISC-III, and EF tests before their final diagnoses and medications. Three licensed clinical psychologists administered the tests, after we randomly, blindly, and singly assigned the participants.
Materials
K-WISC-III15,16
The WISC was the first published intelligence test by Wechsler.19 The third edition was published 1991, and the Korean version of the WISC-III was published by Kwak et al.16 This test comprises ten core subtests and five supplemental ones. These subtests then generate Full Scale IQ, Verbal IQ, and Performance IQ, as well as four composite scores known as indices: Verbal comprehension, Perceptual organization, Freedom from distractibility, Processing speed.
K-PIC20,21
The PIC is an objective multidimensional test of child and adolescent emotional and cognitive status, first published by Wirt et al.20 The Korean version of the PIC was published by Kim et al.21 The administrative booklet consists of 255 items to be completed by the child's parents, or some other rater who knows the child well. The 16 KPI-C's subscales consist of 4 validity scales, the ego resilience scale, and 11 clinical scales (Verbal, Performance, Anxiety, Depression, Somatization, Delinquency, Hyperactivity, Family, Social interaction, Psychoticism, and Autism scales).
Evaluation of EF
We evaluated EF via computerized neuropsychological tests in the Computerized Neurocognitive Function Test-IV (CNT).22 CNT's reliability and validity for adults,23 children18,24 and people with ADHD25 are well-established. In the attentional control domain, we evaluated attention ability by a visual and auditory continuous performance test (CPT) and inhibition ability by the Stroop color-word interference test (Stroop test). In the cognitive flexibility domain, we evaluated conceptual transfer ability by the Trail Making Test (TMT) A & B. In the goal setting domain, we evaluated concept formation ability by the WCST. In the information processing domain, we evaluated speed of processing by reaction times for each neuropsychological test. Finally, we evaluated verbal and visual working memory (WM) and memory process by Digit span test (DST) and Visual span test (VST): forward and backward, the Verbal learning test (VLT), and the Visual recognition test (VRT).
The WCST26-29 was originally developed to assess abstraction ability in normal persons.26,27 However, it is now gaining increasing popularity as a clinical neuropsychological instrument28 and is expanding into childhood uses.29 The test used 8 main scores: numbers of CC, total trials, numbers to complete 1st category, total errors, perseverative responses, perseverative errors, non-perseverative errors, maintaining set failure.
Other EFs included the Visual and auditory CPT (VCPT & ACPT), a psychological test that measures a person's sustained and selective attention and impulsivity. There are 4 main scores. Correct response indicates the number of times the subject responded to the target stimulus (pressed the button at number 3). Reaction time measures the amount of time between the presentation of the stimulus and the participants' response. Omission errors indicate the number of times the target was presented, but the subject did not click the response key or button. Commission errors indicate the number of times the participant responded but no target was presented (pressed buttons at numbers other than 3). The Stroop test is based on the observation that individuals can read words much faster than they can identify and name colors. The cognitive dimension tapped by the Stroop test is associated with cognitive flexibility, resistance to interference from outside stimuli, creativity, and psychopathology. The TMT requires a subject to "connect-the-dots" of 25 consecutive targets on a computer screen. Two versions are available: 1) in which the targets are all numbers (1, 2, 3, etc.), and 2) in which the participant must alternate between numbers and letters (1, A, 2, C, etc.). The goal is to finish the test as quickly as possible, and the primary performance metric is the time taken to complete the test. The Digit span test (DST) is an adaptation from the Wechsler battery (the intelligence scale and memory scales), in which the participant must recall a series of digits of increasing length by touching the digits on a screen, in order. For the reverse digit span, the subject is asked to touch the digits on the screen in reverse order. The VST is an adaptation of the Corsi block-tapping test;30 after white circles blink in a prearranged sequence on a touch monitor, the participant must attempt to copy this blinking pattern. The VLT is a modified Rey Auditory VLT and assesses immediate and delayed verbal memory; the format of the test follows the Rey Auditory VLT, but the word lists were in Korean. The test consists of a learning phase, with 5 presentations of a 15-word list (list A), an interference phase, with another 15-word list (list B), a short-term delayed recall (A6) of the first list, and a long-term delayed test, after 20 minutes, which consists of both recall and recognition. Outcome measures include trial A1 (number of words recalled in the first trial), trial A5 (number of words recalled in the fifth trial), distracter recall (B6), 6th trial (short-term delayed recall; A6), delayed recall (A7; recall after 20 minutes), recognition (number of words correctly identified on the cued recall trial), total recall (total number of words correct, from 1st to 5th trials), learning index (A5-A1; number for trial A5 minus number for trial A1), proactive interference [(A1-B)/A1] and retroactive interference [(A5-A6)/A5]. The VRT follows the format of the Rey Auditory VLT. Fifteen different target figures, composed of circles, squares, triangles, lines, and dots, display separately for 1 second each, and a participant must select these target figures from a pool of the target figures and 15 interference figures. The test consists of a learning phase, with 5 consecutive presentations of the 15 figures, and a delayed recognition test after 20 minutes. Outcome measures include trial A1 (number of figures recognized correctly in the first trial), trial A5 (number of figures recognized correctly in the fifth trial), delayed recognition (A6; recognition after 20 minutes), total recognition (total number of figures correctly recognized, from 1st to 5th trials), and learning index (A5-A1; number for trial A5 minus number for trial A1).
Statistical analysis
We used the Chi-square test (ADHD, subtypes), Fisher exact test (gender), and t-test (age, education, IQ, and WCST scores) for verification of sampling biases. We used the t-test for our analysis of EF scores between the groups and correlation analysis and stepwise multiple regression analysis for the relationship between WCST and other EFs. We analyzed the data were analyzed using the Statistical Package for the Social Sciences (SPSS) for Windows, version 17.0 (SPSS Inc., Chicago, IL, USA) with a significance level of 0.05. The ES were calculates according to the method of Cohen. The ES index for the t-test of the difference between independent means is d, the difference repressed in units of (i.e., divided by) the within-population standard deviation. An ES of 0.2 was considered of a small effect and an ES of 0.5 was considered a medium effect, 0.8 was considered a large effect.31
RESULTS
Comparisons of WCST and K-PIC scores by group classification
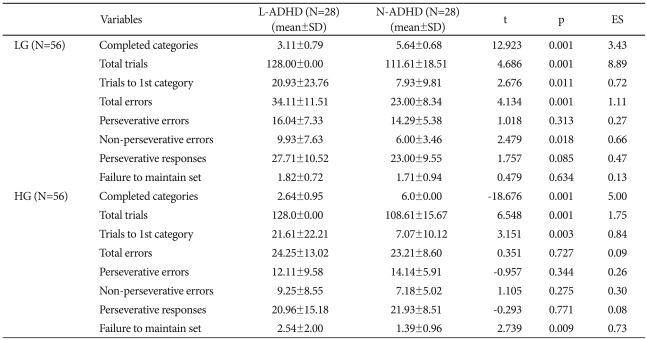
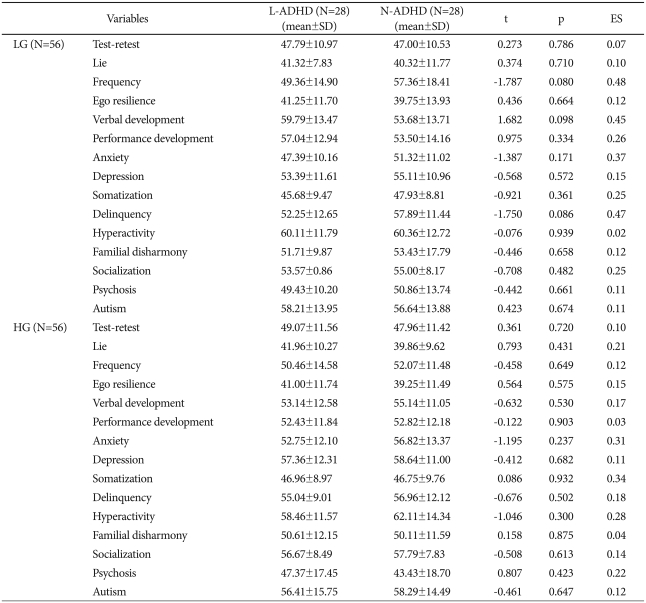
The LG group's WCST performance showed the L-ADHD's CC were significantly lower than those of the N-ADHD (L-ADHD, 3.11±0.79; N-ADHD, 5.64±0.68, t=-12.92; p<0.01; ES=3.43). The L-ADHD section showed significantly higher performances on total trials (L-ADHD, 128.00±0.00; N-ADHD, 111.61±18.51; t=4.69; p<0.01; ES=8.89), trials to 1st category (L-ADHD, 20.93±23.76; N-ADHD, 7.93±9.81; t=2.68; p<0.05; ES=0.72), total errors (L-ADHD, 34.11±11.51; N-ADHD, 23.00±8.34; t=4.13; p<0.01; ES=1.11) and non-perseverative errors (L-ADHD, 9.93±7.63; N-ADHD, 6.00±3.46; t=2.48; p<0.05; ES=0.66), but no significant difference on the other variables. Meanwhile, the HG group's WCST performance showed the L-ADHD's completed category results were significantly lower than those of the N-ADHD (L-ADHD, 2.64±0.95; N-ADHD, 6.00±0.00; t=-18.68; p<0.01; ES=5.00). The L-ADHD section also showed significantly higher performances on total trials (L-ADHD, 128.00±0.00; N-ADHD, 108.61 ±15.67; t=6.55; p<0.01; ES=1.75), trials to 1st category (L-ADHD, 21.61±22.21; N-ADHD, 7.07±10.12; t=3.15; p<0.01; ES=0.84), and failure to maintain set (L-ADHD, 2.54±2.00; N-ADHD, 1.39±0.96; t=2.74; p<0.01; ES=0.73). However, the groups did not differ significantly in total errors or the other variables (Table 2). The LG group's KPI-C subscale scores showed that the groups did not differ significantly on the validity and clinical scales. Also, the HG group's L-ADHD section KPI-C scores showed no significant difference from the N-ADHD section on the validity and clinical scales (Table 3).
Comparisons of WCST performance between L-ADHD and N-ADHD in each age group
Comparisons of Korean personality inventory scores between children impaired and non-impaired by ADHD in each age group
Comparisons of EFs scores between L-ADHD and N-ADHD in LG ADHD and HG ADHD
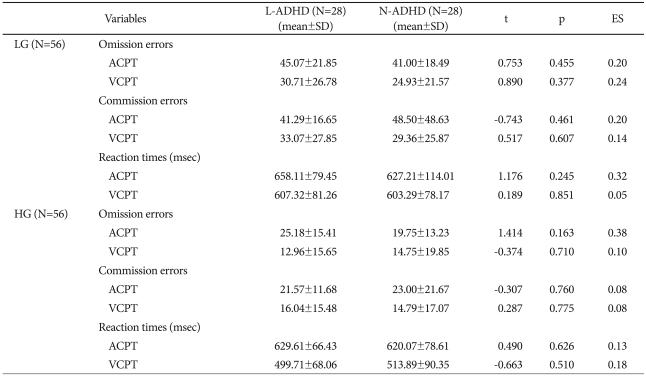
On CPT performance, the LG group's L-ADHD section did not differ significantly from the N-ADHD section on omission errors, commission errors, and reaction times for the ACPT and VCPT. These sections also did not differ significantly in the HG group (Table 4).
Comparisons of CPT performance between L-ADHD and N-ADHD sections in each age group
On the DST, the LG group's L-ADHD section did not differ significantly from the N-ADHD section on the forward subtest, but the L-ADHD section scored significantly lower than the N-ADHD on the backward subtest (L-ADHD, 3.18±0.94; N-ADHD, 3.82±0.86; t=-2.66; p<0.05; ES=0.71). On the VLT, the groups did not differ significantly on either subtest. The LG group's L-ADHD section scored significantly lower on the distracter recall (L-ADHD, 3.79±2.17; N-ADHD, 5.00±2.11; t=-2.13; p<0.05; ES=0.57), delayed recall (L-ADHD, 7.18±2.31; N-ADHD, 8.82±2.87; t=-2.36; p<0.05; ES=0.63), delayed recognition (L-ADHD, 11.21±3.10; N-ADHD, 12.82±1.72; t=-2.40; p<0.05; ES=0.64), and total recall, but the sections did not differ significantly on the other index. Also, the sections did not differ significantly with regard to the VRT index. Furthermore, in the HG group, the sections did not differ significantly on forward and backward subtests of the DST, VST, VRT, and all indices of the VLT (Table 5).
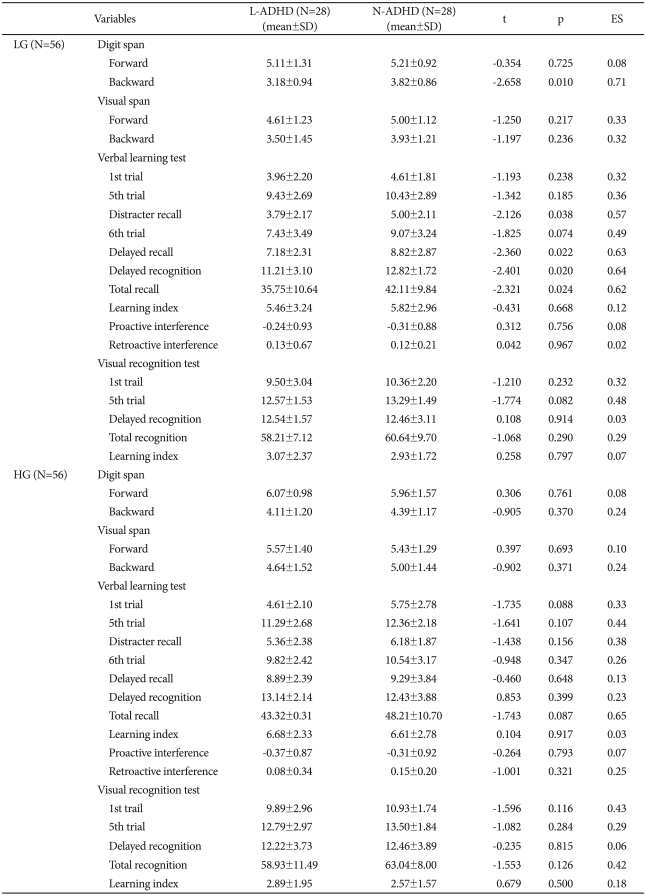
Comparisons of digit span, visual span, verbal learning test, and visual recognition test performance between L-ADHD and N-ADHD sections for each age group
On TMT type A and B, the sections did not differ significantly in the LG group. Also, there was no significant difference in the response time for Word reading, a subtest of the Stroop test, but the L-ADHD section performed significantly slower than the N-ADHD did on Color reading (L-ADHD, 32.55±11.55; N-ADHD, 26.49±7.53; t=2.32; p<0.05; ES=0.62), Word reading of Color word (L-ADHD, 19.93±6.04; N-ADHD, 16.72±3.43; t=2.44; p<0.05; ES=0.65), and Color naming of Color word (L-ADHD, 25.79±9.83; N-ADHD, 21.38±5.97; t=2.03; p<0.05; ES=0.54). The HG group's sections, on the other hand, did not differ significantly in response times on TMT type A and B and the subtests of the Stroop test (Table 6).
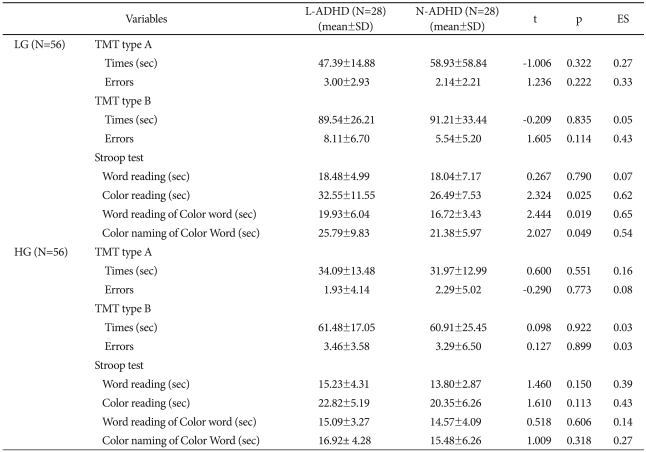
Comparisons of TMT type A & B and Stroop test performances between L-ADHD and N-ADHD sections in each age group
Relationships between CC and EFs scores in LG ADHD and HG ADHD
The results of the correlation analysis of the number of CC and EFs variables in the L-group showed that the number of CC was positively related to response time on the DST backward subtest (r=0.460, p<0.001) and on the VST (r=0.340, p<0.05). In addition, the number of CC was positively correlated with 5th trial (r=0.297, p<0.05), distracter recall (r=0.340, p<0.05), 6th trial (r=0.356, p<0.05), delayed recall (r=0.356, p<0.01), delayed recognition (r=0.334, r<0.05), total recall (r=0.349, p<0.01), which is an index of the VLT, and 5th trial (r=0.286, p<0.05), which is an index of VRT. The number of CC was negatively correlated with errors on the TMT type A (r=-0.322, p<0.05) and B (r=-0.273, p<0.05), color reading (r=-0.354, p<0.01), word reading of color word (r=-0.368, p<0.01), and color naming of color word (r=-0.361, p<0.01) in the Stroop test. On the other hand, there was no correlation between the number of CC and EFs variables in the H-group (Table 7).
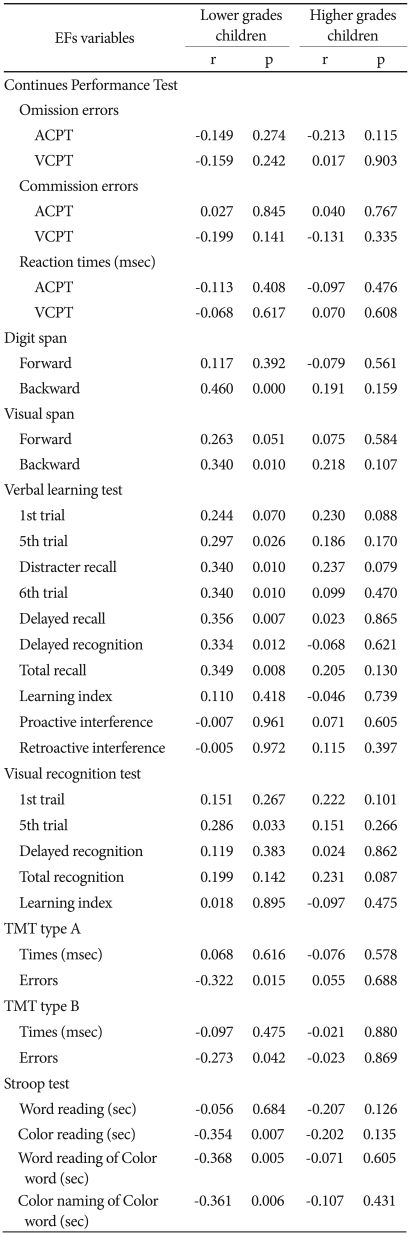
Correlation matrix between numbers of completed categories and EF variables EFs variables
We conducted stepwise multiple regression analyses to compare the relative contribution of the EF variables to the number of CC. The results showed that, in L-ADHD participants, the number of CC was significantly predicted by a combination of the backward test on the DST and VST (R2=0.273, p<0.001). Tests of the individual predictors revealed that the backward tests of the DST (t=3.81, p<0.01) and VST (t=2.12, p<0.05) contributed significantly to the regression equation (Table 8).

The stepwise multiple regression analysis results for the number of completed categories by EF variables
DISCUSSION
Researchers have studied the neuropsychological functioning of elementary-school-age ADHD children since the early 1970s, and, while not all studies showed positive results, in their entirety these studies indicated that, as a group, children with ADHD exhibit sub-average or relatively weak performance on various tasks of vigilance, verbal learning (particularly encoding), WM, and EF (such as set-shifting, planning and organization, complex problem-solving, and response inhibition).13 If a cutoff of 1.5 standard deviations (based on the control samples) on performance of some EF measures defines EF impairment, then, on any individual measure, between 3.7% and 56.7% of Korean children with ADHD are EF impaired,32 between 16% and 51% of ADHD children are EF impaired (on other measures). However, a comparison of multiple deficits revealed only 10% of ADHD children showed deficits across all five domains (stop signal reaction time, reaction time variability, Stroop color-word interference effect, Continuous Performance Task commission errors, and TMT B time). By contrast, 21% of children with ADHD (and 53% of controls) were unimpaired on all five measures.33
One of the challenges for understanding EF in children is that EF skills develop rapidly through childhood, with the suggestion that progression is not necessarily linear, but may occur in spurts. Further, it appears that components of EF might demonstrate different developmental trajectories, adding to the complexity of the domains.4 Within EF, EF skills such as information processing, cognitive flexibility, and goal-setting ability develop rapidly when children are between 7 and 10 years of age.34-36 Such EF can be evaluated by various neuropsychological tests. In particular, the WCST is a commonly-used measure with both clinical and research utility.37 The most commonly-reported WCST performance indices are the number of CC and the number of perseverative errors. In a meta-analytic review of age-related differences in old age,38 the perseverative error measure was marginally more sensitive to age differences, compared with categories achieved. Thus, it may be a better metric of EF, if a single WCST score is to be used. Meta-analytic study results of WCST with children37 suggest that, across all of the studies, children with ADHD fairly consistently exhibited poorer performance as compared to children without clinical diagnoses of ADHD, as measured by percent correct, number of CC, total errors, and perseverative errors, but there were variations in ESs both across studies as well as within WCST variables, and poor performance is not sufficient for a diagnosis of ADHD. In a study of factor analysis and developmental WCST performance trends in Korean elementary school children, Ko et al.17 and Lee et al.18 showed WCST scoring variables had a important difference in developmental trends, and three factors (conceptual formation, perseveration, and ability to sustain attention) effectively explained the nature of these differences. However, the studies showed some differences. Ko et al.17 and Lee et al.18 used the computerized version of the WCST, but the WCST performance instructions and feedback differed in language and modalities. There were no age effects in failure to maintain set17 or the number of perseverative errors.18 However, one factor (concept formation), including the number of CC, accounted for more of the common variance than other factors did.17,24 Therefore, we adopted number of CC for the WCST performance index.
Meta-analysis for demonstrating sensitivity and specificity for identifying those EF deficits associated with ADHD suggested that across all of the studies, individuals with ADHD fairly consistently exhibit poorer performance on the WCST, as compared to individuals without clinical diagnosis, as measured by percent correct, number of CC, total errors, and perseverative errors. Notably, various clinical groups have performed more poorly than ADHD groups in a number of studies. Thus, while impaired performance on the WCST may be indicative of an underlying neurological disorder, most likely related to frontal lobe function, poor performance is not sufficient for a diagnosis of ADHD.37 Developmental norms by age for an unselected sample of normal children in grades 1 through 6 indicated that children make rapid gains in the number of CC and significantly reduce the number of perseverative errors with advancing age, such that, by 10 years of age, their performance on the WCST is indistinguishable from that of adults.39 Therefore, tests such as the WCST may be inappropriate for young children since the prefrontal regions, and especially the dorsolateral areas, do not become fully functional until later in development.40 Furthermore, the cognitive activities mediated by the prefrontal regions do not begin to develop until adolescence, and a disorder of the frontal area can be symptomless until age 12-15 or even older.41 Lesions in the prefrontal areas, therefore, may appear "silent' before the age of 7, since perseveration seems to be the norm. However, by age 7, children surpass the performance of adults with focal frontal lesions but not those with focal nonfrontal lesions, suggesting that at this age the frontal regions are beginning to become operational, although they are not yet functionally mature.39
WM is critical to conscious thought, because it permits internal representation of information, to guide decision-making and overt behavior during an activity so that behavior is not dominated by the immediate sensory cues in the environment.42 WM is likely crucial for performance on the WCST, given that the participant must keep in mind information about previous sorts while simultaneously processing information to determine the next sort.43,44 Therefore, age differences on the WCST may be a function of reduced WM, a capacity with well-established age-related deficits.45 The fact that LG ADHD perform more poorly on the WCST than LG normal children might be due or related to WM or verbal memory ability, but the lower WCST performance of HG ADHD children compared to HG normal children was not explicable by any other EF. This means WCST performance in LG ADHD was related to developmental variations of EF and did not show an impaired EF only. However, HG ADHD children showed impaired EF of requiring from WCST performance discrete to other EFs. In line with the views of Alexander and Stuss,46 EF matures at different rates, especially cognitive flexibility (the ability to cope with multi-dimensional switching tasks), and planning and organizing skills develop rapidly between 7 and 9 or 10 years of age 34-36 compared to other EFs.4 These means that we did not assess fully established EF in LG ADHD and could not differentiate these EF impairments from developmental cognitive delay or other variations.
The Stroop test measure of cognitive control assesses the ease with which a person can maintain a goal in mind and suppress a habitual response in favor of a less familiar one. In children, the Stroop interference effect is minimal when they are just beginning to learn to read and increases (in the first few grades) as children gain in reading fluency. Thereafter, it declines gradually as children gain control over the automatic response of reading.47 As with WCST performance, WM contributes to Stroop interference effects, and individual differences in WM capacity predict performance on the Stroop task, indicating the importance of goal maintenance in the face of competition from habit.48 After all, the Stroop interference effect is affected by WM ability, but the Stroop test evaluates EF differently than the WCST or TMT B.49,50 EF weakness in ADHD children compared to normal children is neither necessary nor sufficient to draw such a distinction because of other confounding or unknown contaminating factors. The administration and interpretation of age-inappropriate neuropsychological tests have caused controversy in research and clinical practice. The WSCT is a commonly-used measure in both research and clinical practice, 37 and 75.5% of neuropsychologists have reported using the WCST as part of their battery.51 However, ADHD individuals fairly consistently exhibit poorer performance on the WCST, compared to individuals without any such clinical diagnosis as measured by some indices.37 Moreover, the causes of poor WCST performance are different, especially in elementary-school-age children. The cause of poorer performance than normal in lower-grades children with ADHD was not shown by WCST alone; other EF, such as verbal and visual WM ability, explained 27.3% of the variance. This suggests that a neuropsychological test battery design for measuring EF in ADHD children should consider age first. For developmental variations, and in interpretation of neuropsychological tests results, researchers should consider the dynamic relationships of EF measured by neuropsychological tests, but a separate domain of EF-oriented interpretation would not be preferable.