The Association between Economic Status and Depressive Symptoms: An Individual and Community Level Approach
Article information
Abstract
Objective
The study was conducted to investigate the association between economic status and depressive symptoms by comparing the prevalence rates of depressive symptoms at community level and analyzing the possibility of depressive symptoms at individual level.
Methods
A survey was conducted from November, 2006 to November, 2007 on 966 and 992 representative subjects recruited by stratified clustered sampling in two regions located in Seoul. We used a standardized questionnaire including the Center for Epidemiologic Studies-Depression and questions on the socioeconomic characteristics. The adjusted prevalence rates of depressive symptoms were compared at community level, and multiple logistic regression analysis was performed to determine the association between depressive symptoms and economic statuses at individual level among each region.
Results
The adjusted prevalence of depressive symptoms was higher in the region with a high socioeconomic status (23.1%) than in the region with a lower economic status (16.6%)(p<0.001). However, logistic regression analysis of individual level revealed that a higher economic status was significantly associated with a lower possibility of depressive symptoms among the females in the low economic status region. This tendency was not observed among the males in both of the regions.
Conclusion
The association between economic status and depressive symptoms was found to be different when it was approached at community level or individual level. In addition, the association of two variables was different by gender at individual level. Further studies that consider the third mediators are needed to determine the association between the two variables.
INTRODUCTION
Socioeconomic health inequalities mean that differences in health exist according to the socioeconomic status such as the educational status, the job status and the income level.1 Research conducted in major advanced countries has found that a population with socioeconomically poorer conditions showed worse health conditions, like a high death rate and high disease morbidity, and this tendency has recently became severer.2-5 In Korea, the Korea National Health and Nutrition Examination Survey reported that a population with a low educational status and poorer job conditions showed higher morbidity from chronic diseases.6 In particular, a study reported that an income gap accounted for 30% of the direct factors that made a difference in heath.7
This tendency has been similarly shown for psychiatric disorders, and a low socioeconomic status has generally been observed to be related with high psychiatric morbidity. According to a meta-analysis conducted by Lorant et al.8 a low socio-economic status was found to be related with the prevalence of depression. In a study on the association between depression and socioeconomic status in Korea, Cho et al.9 reported a result from a nationwide sample analysis that was similar to those of the previous studies in foreign countries.
However, the results of the current research on the association of depression, among different psychiatric disorders, with the economic status seem to be controversial. Dohrenwend & Dohrenwend10 reviewed the literature on psychiatric disorders, and they found that although the overall rate of psychopathology was higher in the group with a low economic level, depressive neurosis showed a different result. Kohn et al.11 also reported that the relation between depression and economic status was controversial and they suggested that further study was needed.
As to association between economic status and depressive symptoms, not depressive disorder, Kim et al.12 found that the prevalence of depressive symptoms was different according to monthly income and the educational status in a study on community dwellers. Research by Kahng & Kwon13 also revealed that persons with a relatively low socioeconomic status such as low income, a low educational background and being female showed a high level of depression. However, association of depressive symptoms and economic status needs to be studied more, considering the controversial association of depressive disorder and economic condition.
Most of the previous studies analyzed data by using an individual level approach to determine the risk factors for depressive symptoms. Therefore, this study took two types of approaches to determine the association between economic characteristics and depressive symptoms. We compared the prevalences of depressive symptoms in the level of regions with low and high economic statuses, and then analyzed the association of two variables in the level of individuals in each region
METHODS
Subjects and the sampling method
Residents living in two regions (or 2 Gus) of Seoul were recruited as the subjects of this study. One out of the two regions (or 2 Gus) has a population of about 430,000 and it has the highest level of financial independence and the highest mean monthly income of the residents among the 25 regions (or Gus) of Seoul. The other region (or gu) with a population of around 400,000 showed middle levels of financial independence and an average mean monthly income of the residents.14 However, one community (or a dong) in this latter region has a high average monthly income that raises the overall economic status of the region and the economic status of other communities (or dongs), and except for this dong the other communities have a relatively low economic status. Through stratified clustered random sampling of the two regions, households were selected and in a chosen household a family member with the earliest date of birth was recruited as the subjects of this study. A 'Dong' in each region was stratified into three strata or six strata in the A Gu and the B Gu, respectively, and one or two 'Dong' was selected randomly from each strata with the 'Dong' as a primary sampling unit. With 'Ban' as a secondary sampling unit, the 'Ban' was chosen in proportion to a number of households from the selected 'Dong' through systematic random sampling, and five households were randomly selected from the chosen 'Ban'. When the number of samples was calculated under the conditions of a 95% confidence interval and a ±5% margin of error to estimate the prevalence of depressive symptoms of a population, the minimum sample size of each 'Gu' was 854. The number of subjects finally examined in this study was 966 and 992 in the A 'Gu' and B 'Gu', respectively.
Measurements
The questionnaire used in this study consisted of five questions concerned with socioeconomic characteristics such as gender, age, the monthly family income, the educational status and marital status, a question about residence and then there were 20 questions to detect depressive symptoms. The scale used to screen depressive symptoms was the Center for Epidemiologic Studies-Depression (CES-D) scale and among its three standardized Korean-versions, a tool standardized by Cho and Kim15 was utilized for this study. It is a self-reporting scale that consists of 20 questions. These questions are scored with 0-3 points and the total score is 0-60 points. Using 21 points as a criterion, which has been reported to be an optimal cut-off point for an epidemiological survey in a community, the persons recording 21 or more points were classified as a depressive symptom group.
Data collection
For data collection, a trained researcher and a community resident as a team visited the selected households from November, 2006 to November, 2007. After confirming the subject in each household, the standardized questionnaire was given to him/her and he/she answered it by himself/herself. If a subject could not read the questionnaire because of illiteracy or weak eyesight, then the questionnaire was answered via an interview. When it was returned, the researcher checked whether or not there were some missing answers. A survey manager reviewed the questionnaires every three days for the researcher to reexamine for missing values or illogical answers.
Data analysis
After dual entry of the collected data was performed by two trained persons, the entry errors were found and corrected and the missing values were replaced by using the nearest neighbor imputation methods. For the regional level analysis on the association between economic status and depressive symptoms, the prevalence of depressive symptoms in each region was compared using χ2 tests. The effect of economic status on depressive symptoms at individual level was analyzed with multiple logistic regression analysis by stratifying the subjects according to gender, and the analysis was adjusted for age, the educational status and the marital status in each region.
This study was approved by the Institutional Review Board (IRB) of the Catholic University of Korea.
RESULTS
Socioeconomic characteristics
The socioeconomic characteristics of the subjects are presented in Table 1. Gender and marital status did not show any significant difference between the two regions. For age, the percentage of a population aged less than 40 years was higher in the low economic status (ES) region than in the high ES region (45.9% and 35.9%, respectively) while the percentage of a population aged in the 40s was higher in the high ES region than in the low ES region (28.2% and 22.3%, respectively). As the percentage of a population aged 50 or older was also higher in the high ES region than in the low ES region, the age in the high ES region was found to be older overall than that of the other region (p<0.001).
Socio-demographic characteristics of the subjects (N=1,958)
The average monthly family income tended to be higher in the high ES region than in the low ES region. Although the subjects with an income of over 4 million won/month accounted for less than 20% of the total subjects in the low ES region, the subjects with the same income level accounted for about 50% of the total subjects in the high ES region. While the subjects with an income of less than 2 million won/month were about 40% in the low ES region, those with the same income level exceeded 20% in the high ES region (p<0.001).
The rates of high school graduates and college, university or higher educational institution graduates were 36.1% and 47.9%, respectively, in the low ES region and 16.1% and 75.9%, respectively, in the high ES region and the educational status was also relatively higher in the high ES region than that in the low ES region.
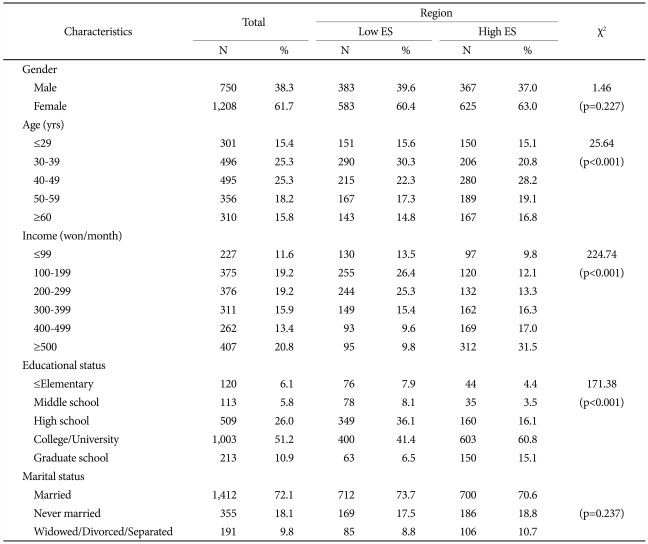
Crude and standardized prevalence of depressive symptoms among the subjects in the high and low-economic status regions
The prevalence of depressive symptoms in the high ES region was 23.1% and that of the low ES region was 16.3%, so the prevalence of depressive symptoms was higher in the region with a better economic status (p<0.001).
Because the difference in the crude prevalence of depressive symptoms between the regions with high and low economic statuses could be caused by the difference in the composition of the population, the prevalence rates, as standardized by gender and age, were compared. As a result, the adjusted prevalence of depressive symptoms in the region with a high economic status was also higher than that of the other region (23.1% and 16.6%, respectively), the same as the crude prevalence (Figure 1).
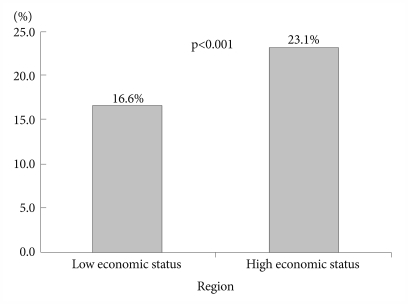
Prevalence of depressive symptoms adjusted by gender and age.
Association of economic status and depressive symptoms at individual level
The gender, age, educational status and marital status of all the subjects were controlled and the association between economic status and the depressive symptoms was analyzed. With using a group with an average monthly family income of less than a million won/month as the reference group, an increase by a million won/month of income significantly reduced the possibility of depressive symptoms {odds ratio (OR): 0.582-0.321} as a whole. According to the results of the analysis performed by stratifying the subjects by gender, among the males, only the group with the highest average monthly family income showed such a tendency, and among the females, a higher income level was associated with a lower possibility of depressive symptoms for all income groups (OR: 0.559-0.349).
When the association between economic status and depressive symptoms was investigated after stratifying by region, the region with a low economic status showed a trend that was similar with the results of all the subjects. But the region with a high economic status showed a different result. In other words, the possibility of depressive symptoms of only the two groups with the highest income was lower significantly than that of the reference group. But the analysis stratified by gender revealed that males showed no significant difference in the possibility of depressive symptoms according to their economic status (Table 2).

Association of economic status and depressive symptoms [Odds ratio (95% CI)]
DISCUSSION
Various rates of the prevalence of depression have been reported for different countries. The National Comorbidity Survey (NCS) in the U.S. reported that the lifetime prevalence of major depression was 16.2%,16 and the prevalence of major depression in Korea, Taiwan and Canada was reported to be 5.6%,17 1.1%18 and 8.6%,19 respectively, so there was a large difference in the prevalence of major depression around the world. These studies used structured diagnostic scales like the Present State Examination (PSE), the Diagnostic Interview Schedule (DIS) or the Composite International Diagnostic Interview (CIDI) to investigate the prevalence of depression. Although these scales can diagnose the disease as their advantage, it takes a long time to assess subjects using these tools and it is expensive. Therefore, it is not easy to apply them to community studies.
On the contrary, the CES-D and Beck's Depression Inventory (BDI) cannot diagnose depression, but they are easy to use for a survey and the time needed to assess subjects is short as a self-administered form, so these tools can be viewed as an economical approach to screen depressive symptoms. In particular, the CES-D is a scale designed for performing an epidemiological survey in a general population and it has been widely used for population surveys around the world.20 The prevalence of depressive symptoms reported in the research using the CES-D tends to be higher than that of studies using diagnostic scales, but the two prevalence rates using these tools have still been fairly consistent.21
Studies using the CES-D have shown relatively variable prevalence rates of depressive symptoms even though a same cut-off point was applied. As for the research with the cut-off point of 16, the Hispanic Health and Nutrition Examination Survey (H-HANES) in the U.S. revealed that 12.9% of the subjects had depressive symptoms22 and the research of Madianos et al.23 performed in Greece found that 17.6% of the community adults showed depressive symptoms. Cho et al.21 reported that the prevalence of depressive symptoms was 25.3% in their nationwide community-based study. Our study used 21 points as the cut-off by following the suggestion of Cho et al.15 who said that an optimal cut-off point for the primary screening of depressive symptoms was 21 points in a community-based epidemiological survey in Korea. We found that the prevalence rates of depressive symptoms in the two regions were 16.6% and 23.1% after adjusting for gender and age.
This study compared the prevalence of depressive symptoms in a high-economic status region with that of a low-economic status region by using same tool, the CES-D, during the same time period. Out of the two regions, the region with the higher economic status was called 'the richest Gu' out of the 25 Gus in Seoul with 75.5% of the families being financial independence and the average monthly family income is 4.81 million won. On the contrary, the other region with a low economic status showed a middle level of financial independence and an average monthly family income level at 66.9% and 3.97 million won, respectively. Because one 'dong' in the low-economic status region significantly contributed to the total economic status, the overall level of this region, except the one wealthy 'dong', had lower financial independence and a lower average monthly family income.14
When the prevalence of depressive symptoms in the two regions was compared, the prevalence of depression in the better economic status region was higher than that of the other region (23.1% and 16.3%, respectively). This finding was similar with the results of comparison between the prevalence of depressive disorder according to countries. As was mentioned above, when the nationwide prevalence rates of depression were compared in the U.S, the NCS reported that the lifetime prevalence of depression, as investigated with a diagnostic scale, was 16.2%16 and in Korea a nationwide survey conducted by using the same scale (the 2005 Epidemiological Survey of Psychiatric Illnesses) reported that the prevalence of depression was 5.6%.17 So, the prevalence of depression in a country with a better economic status was observed to be relatively high. Two reports that measured the prevalence rates of depression with the DIS around the same time also showed this tendency, as the lifetime prevalence of depression in New Zealand in 1990 was 12.6% and this was higher than that of Puerto Rico in 1987 (4.6%).24 As for the studies that focused on the prevalence of depression using the PSE, Camberwell in England (1981) and Canberra in Australia (1979) reported that the prevalence of depression was 7.1% and 6.1%, respectively, and there was not a large difference.25 Like this, the economically more advanced countries have tended to show a relatively higher prevalence of depression, but this is somewhat uncertain because the subjects, the survey time and period, the scales and the diagnostic criteria of the studies were not the same. A study by Wang on the rural-urban differences in the prevalence of major depression asserted that the difference of the prevalence of depression between rural and urban areas was related with a geographical region, and they carefully suggested that the different cultural and social contexts in each region could affect the development of depression.26 If the result of our current study was interpreted in this context, there was a possibility that the different socio-cultural atmosphere in the two regions could affect the factors or frequencies of feeling depressive symptoms. Such a possibility could be supported not only by comparing the prevalence of depressive symptoms at a regional level, but also by making such a comparison at individual level.
When the odds ratio of depressive symptoms according to the economic status level in each region was calculated at individual level, the possibility of depressive symptoms tended to decline according to an increase of every million won/month among the females in the low economic status region. However, among the females in the high socioeconomic status region this trend was observed only in the two groups with the highest average monthly family income. In other words, females with a same average monthly family income had a higher possibility of depressive symptoms in the high-economic status region than in the other region. This is the similar trend as that of a study by Weich et al.27 They reported that individual income interacted with a regional unequal distribution of income to affect the severity of a psychiatric disorder. The reason for this result could be because the differences in the socio-cultural atmosphere according to region provoked differences in the subjective emotion felt by residents in each region even though they had same economic conditions.
Interestingly, the different possibility of depressive symptoms according to the average monthly family income was found only for females. After controlling for age, the educational status and the marital status, the possibility of depressive symptoms among females was significantly different according to their income level, but that of the males was not significantly affected by the income level. Like this, more and more research has suggested that a third factor works on the association between the income level and depressive symptoms. Kahng & Kwon13 reported that although the prevalence of depressive symptoms was lower in individuals with a high income level than that of those individuals with a low income level, this tendency was clearly observed among the subjects aged 40 years or older, but the difference became smaller among the subjects aged less than 40 years, so age showed interaction in the relationship between the two variables. The same interaction was also reported in a study by House et al.28 The result of this study showed that multi-dimensional factors should be considered when choosing interventions to solve problems related with the inequalities of psychiatric health.
The studies on the association between the economic status and depressive disorder have generally reported that a higher socioeconomic level was related with a lower prevalence of depression.29-33 Such relationship can be explained by the stress theory. According to this theory, personal resources such as coping style, self-esteem and locus of control reduce the impact of stress on depression, and individuals with a high socioeconomic level have more resources.34,35 In the meantime, the strain theory emphasizes the effects of community features like values, social welfare, social cohesion and public health policies.36,37 However, the reported evidence for contextual effects on psychiatric disorders is rather controversial.38,39
The results of this study that analyzed the association of economic status and depressive symptoms, not depressive disorder, support the stress theory in the individual level analysis, but the results somewhat conflict with the strain theory in the community level analysis. Therefore, further study on the association between the socioeconomic level and depressive symptoms with using strain theory is needed.
Acknowledgments
This study was supported by a grant of the Korea Healthcare Technology R&D Project, Ministry for Health and Welfare, Republic of Korea (A10-2065).