Differences in Performance of ADHD Children on a Visual and Auditory Continuous Performance Test according to IQ
Article information
Abstract
Objective
Continuous performance tests (CPTs) are frequently used in clinical practice to assess the attentiveness of ADHD children. Although most CPTs do not categorize T scores by intelligence, there is great diversity of opinion regarding the interrelation between intelligence and CPT performance. This study aimed to determine if ADHD children with superior IQs would perform better than ADHD children with average IQs. Additionally, we aimed to examine the need for CPTs' to categorize according to IQ.
Methods
Participants were 326 outpatients, aged 5-15 years, diagnosed with ADHD. All participants completed the Wechsler Intelligence Scale for Children-Revised and a CPT. After excluding those who meet exclusion criteria, we had 266 patients for our analysis.
Results
The "Highly Intelligent Group" (HIG), patients with IQs 120 and above, performed superiorly to the "Normally Intelligent Group" (NIG) patients, with IQs between 70 and 120, with regard to omission and commission errors on the visual-auditory CPT, even after controlling for age and gender. The HIG had higher ratios of subjects with T scores <65 on the visual and auditory CPT variables than the NIG did.
Conclusion
The results of this study suggest this CPT is not sensitive for discerning ADHD in children with superior IQs; thus, there is a need to standardize the variables based on IQ, as well as on age and gender. Moreover, clinicians need to pay attention to the effect of IQ in interpreting CPT scores; that is, a "normal" score does not rule out a diagnosis of ADHD.
INTRODUCTION
Attention Deficit-Hyperactivity Disorder (ADHD) is one of the most common neurobehavioral disorders in children, causing sufferers significant problems in daily life, academic performance, and school adjustment. Children with ADHD present heterogeneous symptoms in addition to the cardinal symptoms of inattention, hyperactivity, and impulsivity.
The ADHD diagnosis and assessment process requires a variety of methods, including taking the child's history, performing clinical observation, administering various scales, and considering the child's academic performance measures and intelligence, as well as examining the child on neuropsychological tasks and computerized performance tests.
Of these tests, clinical practices have frequently made use of some Continuous Performance Test (CPT) to measure vigilance, response inhibition, and signal detection.1,2 There are a variety of CPTs, the more common ones being the Conner's CPT, the Gordon Diagnostic System (GDS), the Test of Variables of Attention (TOVA), and the ADHD Diagnostic System (ADS).3-5 Clinicians mainly analyze CPT results with regard to omission errors, commission errors, response times, and the standard deviations of response times.
Some studies have shown that ADHD children commit more omission errors and commission errors than normal children do and that the number of errors increases as symptom intensity increases in severity.6 Researchers have also reported that such children cannot attend to target stimuli; respond more to non-target stimuli; show, over time, more responses that are impulsive; and commit more errors at the presentation of obscure stimuli.7-10 Researchers suggest certain factors, such as age, gender, and intelligence, which can affect the performance score, deserve consideration when one is interpreting a CPT score for a possible diagnosis of ADHD. Many studies have demonstrated older children have a tendency to perform better than younger children on CPTs.4,11-16 Furthermore, most CPTs' T scores are categorized by age.
On the one hand, few CPTs categorize T scores by IQ, and some controversy exists regarding whether IQ influences CPT performance.17-22 Some studies argued IQ considerably influences CPT performance and that children who were higher in IQ performed better on CPTs than did those who were not, leading to the reliability issue.23,24 On the other hand, certain other studies reported no correlation between CPT performance and IQ.12,25,26 Although whether intelligence influences CPT performance seems obviously important for determining the causes of, and therapeutic approaches to, ADHD children's lack of attentiveness, studies have shown inconsistent results, and most of them focused on visual CPT only, leaving auditory CPT insufficiently examined.
The present study investigated whether children with ADHD perform differently on any or all CPT variables according to their intelligence. Additionally, we examined the potential need to categorize CPTs scores according to IQ. We hypothesized that ADHD children with superior IQs would show higher CPT performances than would ADHD children with average IQs.
The Ethics Committee of Seoul Saint Mary's Hospital approved this study protocol.
METHODS
Subjects
Participants were 326 psychiatric outpatients, aged 5-15 years, who visited St. Mary's Hospital, The Catholic University of Korea, Seoul, from June 2001 to December 2007. Each patient's ADHD diagnosis was made by a psychiatrist, according to the criteria of the Diagnostic and Statistical Manual of Mental Disorders (DSM-IV).27 All subjects completed the Korean Educational Developmental Institute-Wechsler Intelligence Scale Children (KEDI-WISC; a Korean-version of the WISC-R) and ADS, the chosen CPT. After excluding those patients having an IQ score of less than 70 on the KEDI-WISC Full-scale IQ (FIQ), a psychosis, a severe affective disorder, a pervasive developmental disorder, a documented traumatic brain injury, or a treatment including a psychoactive drug, we had 266 patients left for our analysis.
We clustered the participants into two groups, based on KEDI-WISC FIQ score. Studies and the literature vary regarding a specific cut-off for a "high" IQ. In this paper, we adopted the definition of Lovecky and Silverman (members of the National Institute of Health ADHD Consensus Conference Panel) that a superior IQ is FIQ ≥120.28 Statistically speaking, high-IQ individuals account for 10 percent of a population.29 The "Highly Intelligent Group" (HIG) consisted of 64 patients with FIQ at 120 and above, and the "Normally Intelligent Group" (NIG) consisted of 202 patients with FIQ below 120. At each participant's first visit, a psychiatrist measured their ADHD symptom severity on the Clinical Global Impression-Severity scale (CGI-S).
Measures
Korean Educational Developmental Institute-Wechsler Intelligence Scale for Children (KEDI-WISC)
The KEDI-WISC is the Korean version of the WISC-R, applicable for use with persons between 5 and 15 years of age.30 The KEDI-WISC evaluates FIQ, Verbal IQ (VIQ), and Performance IQ (PIQ) and consists of 12 subscales.
ADHD Diagnostic System (ADS)
The ADS is a CPT consisting of a set of visual-auditory stimulation tests, which takes 15 minutes to complete. ADS is widely used as a performance measure in Korea and was developed to assess attention and response inhibition in Korean children over 5 years of age. The target stimulus's ratio of presentation is 22% for the first section, 50% for the middle section, and 78% for the last section. The stimulus presentation time is 100 ms, and the interval between the presentations is 2,000 ms.5 ADS presents four variables as age-adjusted T scores: omission errors, commission errors, response time, and response time variability. An omission error indicates the patient did not respond to a target stimulus that should have elicited a response. This measures the patient's sustained attention.31 A commission error indicates the patient responded to a non-target stimulus, which should not have elicited a response. This measures impulsivity,11 self-regulation, and inhibitory control.32 Response time reflects the response preparation components of executive function.33 The standard deviation of the response times measures the inconsistency in the patient's responses.5 To the extent that it measures the standard deviations of correct response times, it also reflects response preparation.34
According to the ADS guidelines, a T score above 65 on visual-auditory variables represents some probability of ADHD. Therefore, we used a T score of 65 as our cut-off score for distinguishing between normal and abnormal performances.
Clinical Global Impression-Severity scale (CGI-S)
The CGI-S presents the clinician's impression of a patient's current illness state; it is often used both before and after treatment. Scores on the Severity of Illness subscale range from 1 (not at all ill ) to 7 (severely ill).35
Statistical analysis
We conducted chi-square tests and Student's t-tests to compare the categorical and the continuous variables, respectively. To determine possible correlations between the variables, we used Pearson's correlation. In addition, to adjust for covariates, we used the analysis of covariance test (ANCOVA). Initially, p-values less than 0.05 were considered statistically significant. Then we applied Bonferroni corrections to the multiple comparisons. We performed these statistical analyses using the SPSS 12.0 (version 12.0, SPSS Inc., Chicago, IL, USA).
RESULTS
Of the 266 children, there were 220 boys (82.71%) and 46 girls (17.29%), with a mean age of 9.23 (SD=2.53). The subjects' average FIQ was 108.29±15.25 (VIQ, 106.53±15.18; PIQ, 108.85±16.38). The HIG's average FIQ was 125.92±7.54 (VIQ, 122.09±6.60; PIQ, 125.92±7.54), and the NIG's average FIQ was 102.71±13.05 (average VIQ, 101.60±13.73; average PIQ, 103.44±14.62). The HIG and NIG were not significantly different in their symptom severity per the CGI-S (HIG, 4.98±1.38 vs. NIG, 4.73±1.43, p=0.297), or in their gender composition (p=0.084) and age distribution (p=0.433).
Table 1 summarizes the differences in CPT performance according to IQ group.
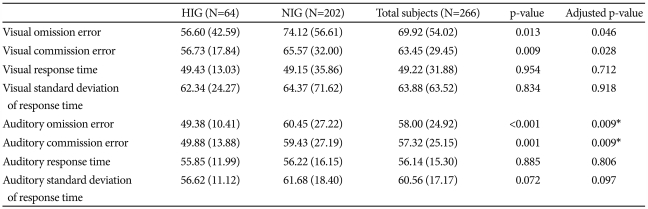
Differences in CPT performance according to IQ group
On this visual-auditory CPT, the HIG's performance was superior to the NIG's with regard to omission and commission errors, after controlling for age and gender. Even after correcting for multiple comparisons, the HIG's performance was superior to the NIG's with regard to auditory omission and auditory commission errors. FIQ showed a significantly negative correlation with variables such as visual omission errors (r=-0.208, p=0.001), visual commission errors (r=-0.196, p=0.002), auditory omission errors (r=-0.289, p<0.0001), auditory commission errors (r=-0.219, p=0.001), and auditory standard deviation of response time (r=-0.240, p<0.0001). Even after correcting for multiple comparisons, FIQ showed significant negative correlations with all these variables.
Moreover, considering verbal IQ and performance IQ separately, 64 participants in the HIG had verbal IQs not less than 120, and 109 participants in the HIG had performance IQs not less than 120. On the visual-auditory CPT, the verbal HIG's scores were superior to those of the NIG's with regard to visual omission errors (p=0.009), visual commission errors (p=0.010), auditory omission errors (p=0.017), auditory commission errors (p=0.003), and auditory standard deviation of response time (p=0.005) after controlling for age and gender. Even after correcting for multiple comparisons, the HIG's showed performances superior to those of the NIG's with regard to visual omission errors, visual commission errors, auditory commission errors, and auditory standard deviation of response time.
Additionally, the performance HIG's scores were superior to those of the NIG's with regard to visual omission errors (p=0.038), visual commission errors (p=0.024), auditory omission errors (p=0.007), auditory commission errors (p=0.003), and auditory standard deviation of response time (p=0.028), after controlling for age and gender. Even after correcting for multiple comparisons, the HIG's performance was superior to that of the NIG's with regard to auditory omission errors and auditory commission errors.
When we controlled for intelligence and age, two variables showed significant differences between the genders: visual commission errors (boys, 65.66±31.28; girls, 52.30±12.77, p=0.006) and visual response times (boys, 46.75±33.31; girls, 61.67±19.28, p=0.018).
Even after correcting for multiple comparisons, visual commission errors showed significant differences between the genders. There were no significant differences among the auditory variables.
Table 2 shows the differences in the number of participants who obtained CPT T scores less than 65 and the positive predictive values according to IQ group.

Differences in numbers of subjects obtaining CPT T scores less than 65 and positive predictive values according to IQ group
Regarding participants with T scores below 65 on the visual and auditory ADS variables, the HIG had higher ratios of participants with T scores below 65 than the NIG had, on all variables. Of these differing ratios, those of the visual omission error, visual commission error, visual response time, visual standard deviation of response time, auditory omission error, auditory commission error, auditory standard deviation, and all auditory variables were significant. Even after correcting for multiple comparisons, the differences between the two groups regarding these ratios remained significant regarding visual omission error, visual commission error, visual response time, visual standard deviation of response time, auditory omission error, and all variables. If we consider a child with a diagnosis of ADHD who obtained a T score less than 65 on all 4 ADS variables (omission and commission errors, response time, and standard deviation of response time) as a false negative result, the visual and auditory ADS variables had positive predictive values for the NIG of 60.89% and 69.80% and for the HIG of 48.43% and 54.58%, respectively.
Considering all visual-auditory variables, we found a positive predictive value of 80.19% for the NIG and 67.18% for the HIG.
DISCUSSION
As we hypothesized, the present study indicates that high-IQ ADHD children performed significantly better than similar children of average IQ did on the ADS, a widely used visual-auditory CPT in Korea. Our results are consistent with previous findings showing children with superior IQs have a tendency to perform better on the CPT than do normal-intelligence children.4 Earlier studies suggested that children with superior IQs made fewer errors due to a ceiling effect.18,23 In similar findings, intelligence potentially affected CPT performances of the child and adolescent patients in psychiatric hospitals36 and also of patients with attention and learning problems.37
Recently, interest in an auditory CPT has increased, because an auditory CPT would measure the concentration defect more specifically, it could have superior discriminating power over visual tests, the attentiveness required for school as well as daily life is more closely related to auditory measures,38 and there are differences between ADHD and normal children in the auditory event-related evoked potential.39-42 However, few studies have investigated whether an auditory CPT would be more helpful than a visual CPT at measuring the difference between performances due to pure attentive concentration and would experience less interference from IQ. In this study, the differences in CPT performances between groups were more prominent in the auditory CPT than in the visual CPT, contrary to prior expectations.
Regarding omission errors on the visual-auditory ADS, the significant difference between the HIG and NIG may connect to an IQ subitem that is closely related to sustained attention. The subitems of arithmetic, digit span, and coding are called inattention-memory factors43 or distractibility factors.44,45 Previous studies suggested ADHD children's scores on these subitems are lower than the scores of normal children.43
Commission errors reflect the inhibitory control of executive functioning24 and support the idea that the key to ADHD is that it is an inhibition problem rather than an attention problem.46-48 Such errors also support the idea that ADHD children frequently have defects in executive functioning.49-54 In a similar opinion, Mahone et al. reported average-IQ children may show differences in executive functioning between ADHD patients and controls, but children with superior IQs do not show these differences. They also assumed that the greater influence on executive function is, not ADHD diagnosis, but superior or inferior IQ.23,24
In this study, the differences in response times and in standard deviations of response times between the HIG and NIG were not significant. From this result, we suppose there is a relatively low tendency for IQ to affect response preparation in executive functioning.
This study's results also showed a difference in, not auditory variables, but visual variables, between girls and boys. Our findings coincide with the previous studies showing CPT performance varies by gender, because boys have more impulsiveness, less variability, and faster response time.11,55 However, we recommend further investigations to find out why there are no differences in auditory variables, and why girls are sensitive to auditory variables and boys to visual variables.
The limitations of this study are 1) all participants were children with ADHD, with no control group of normal children, so it could not investigate the problem of false positive cases or the possible CPT performance differences between superior-IQ and average-IQ normal children; 2) it had an insufficient number of subjects and could not examine the tendencies between more subdivided levels of IQ and performance on a CPT; 3) in spite of comorbidity's great importance in ADHD patients, this study, being a retrospective chart review, utilized only an AXIS-I diagnosis on the DSM-IV, as described by clinicians at each patient's clinical interview, and had no structured interview for examining comorbidity; and 4) it evaluated subjects' symptom severity only via the CGI-S, rather than a more specific rating scale for ADHD symptoms, such as DuPaul's ADHD rating scale56 or Conner's ADHD rating scale.57
The results of this study suggest that a CPT is not a sensitive measurement for ADHD children with superior IQs; thus, there is a need to standardize the variables based on IQ, as well as age and gender. Because the ADS gives higher false-negative rates and has a lower positive predictive value for children with superior IQs,46 a "normal" score should not rule out a diagnosis of ADHD.58 In addition, clinicians need to pay attention to the effect of IQ in interpreting CPT scores; that is, they must keep in mind that the results of neuropsychological tests and patients' real-world difficulties will not be coincident.23
Acknowledgments
The point of this article was presented as a poster at the American Academy of Child and Adolescent Psychiatry (AACAP) in Honolulu, Hawaii, on October 30, 2009.