G1/S Cell Cycle Checkpoint Defect in Lymphocytes from Patients with Alzheimer's Disease
Article information
Abstract
Objective
We compared the cell responsiveness of activated lymphocytes to rapamycin, which blocks the G1/S transition, between patients with Alzheimer's disease (AD) and normal controls to assess the early phase control defect in cell cycle.
Methods
Blood samples of 26 patients with AD and 28 normal controls were collected to separate peripheral lymphocytes. We measured the proportion of each cell cycle phase in activated lymphocytes using flow cytometry and evaluated the responsiveness of these lymphocytes to rapamycin.
Results
The patients with AD were older than the normal controls (AD 74.03±7.90 yr vs. control 68.28±6.21 yr, p=0.004). The proportion of G1 phase cells in the AD group was significantly lower than that in the control group (70.29±6.32% vs. 76.03±9.05%, p=0.01), and the proportion of S phase cells in the AD group was higher than that in control group (12.45±6.09% vs. 6.03±5.11%, p=0.001). Activated lymphocytes in patients with AD were not arrested in the G1 phase and they progressed to the late phase of the cell cycle despite rapamycin treatment, in contrast to those of normal subjects.
Conclusion
The patients with AD probably have a control defect of early phase cell cycle in peripheral lymphocytes that may be associated with the underlying pathology of neuronal death.
INTRODUCTION
A defect in cell cycle control appears early in Alzheimer's disease (AD) pathogenesis, when patients are not yet clinically demented.1,2 Cellular pathology in patients with AD is not restricted to neurons3,4 and can be observed as a defect in cell cycle control in peripheral nucleated cells.5-7 We found previously that cell viability of lymphocytes in patients with AD decreases more rapidly after phytohemagglutinin (PHA) stimulation than that in a normal control.8 PHA is a lectin found in plants and is used as a mitogen to trigger lymphocyte cell division.
Re-entry of differentiated neuronal cells into the cell division cycle in the brain is followed by a cell cycle regulation defect in patients with AD.9-11 During healthy aging, the regulatory mechanisms that inhibit the G1/S transition in the cell cycle, the "point of no return", beyond which the cell is committed to dividing, are activated, so the neuronal cell division cycle does not progress beyond the G1 phase. However, the G1/S regulatory mechanism seems to be dysfunctional in patients with AD, and the neuronal cell cycle is allowed to progress as far as the G2 phase. As neurons are not capable of undergoing mitosis and completing the cell cycle, these cells may die via apoptosis or produce AD-related pathologies.10,12
We hypothesized that this known cell cycle regulation defect at the G1/S checkpoint may be reflected in peripheral lymphocytes. To assess the function of the G1/S transition checkpoint, we compared the responsiveness of activated lymphocytes to a G1/S transition inhibitor between patients with AD and normal controls.
METHODS
Subjects
Patients with AD from the Clinical Trials Program at the Geropsychiatric Clinic at Samsung Medical Center were included in the study. These patients were a completely separate sample from our previous report.8 Patients were diagnosed as "probable Alzheimer's disease" using the NINCDS-ADRDA (The National Institute of Neurological and Communicative Disorders and Stroke and the Alzheimer's Disease and Related Disorders Association) diagnostic criteria. All patients underwent a neuropsychological evaluation, routine laboratory tests, a neurological examination, and neuroimaging (brain magnetic resonance imaging) to rule out other causes of dementia. The Korean version of the Mini Mental State Examination (K-MMSE),13 Clinical Dementia Rating (CDR),14 Seoul-Instrumental Activity of Daily Living (S-IADL),15 and Seoul-Activity of Daily Living Scale (S-ADL)16 were administered. Patients with other significant psychiatric, neurological, or medical illnesses were excluded.
The normal control subjects consisted of elderly volunteers who responded to an advertisement. They were evaluated by a psychiatrist based on the Health Screening Exclusion Criteria17 to ensure the absence of medical, neurological, and psychiatric problems. All subjects met the following inclusion criteria: 1) free of memory and cognitive disorders; 2) lived independently without difficulty; 3) no active psychiatric illness, alcohol/drug history; and 4) no active medical or neurological disorder including human cytomegalovirus infection, hypoxia, and certain cancers that could potentially affect cognition and the G1/S transition.18-21 In addition, the K-MMSE, the 7 Minute Screening Test,22 S-IADL, and S-ADL were administered by an independent clinical psychologist.
With the approval of the Institutional Review Board at the Samsung Medical Center, 26 patients with AD and 28 normal controls participated and completed this study. Signed informed consent was obtained from all participants.
Separation and culture of peripheral lymphocytes
Blood samples from the patients and normal controls were collected to separate peripheral lymphocytes. Blood samples were heparinized, stored at 4℃ immediately after venipuncture, and assayed within 24 hr. Peripheral blood mononuclear cells were isolated by centrifugation at 300×g for 15 min on a Ficoll-Hypaque (Pharmacia Biotech, Uppsala, Sweden) density gradient. The cells were washed twice with phosphate buffered saline (Sigma, St. Louis, MO, USA), and the lymphocytes were separated in Hank's balanced salt solution (Sigma). We defined this point as T0 (baseline). After 20 µg/mL of PHA (Gibco, Grand Island, NY, USA) was added to reactivate the cell cycle, the lymphocytes were cultured in RPMI1640 (Gibco) containing 10% fetal bovine serum at 37℃ with 5% CO2 for 24 hr. These lymphocytes were then treated with 100 ng/mL rapamycin (Sigma) and cultured for an additional 24 hr under the previous conditions. We defined this point as T48. Rapamycin is an immunosuppressant drug used to prevent organ transplant rejection. It prevents lymphocytes from activating by inhibiting their response to interleukin-2. We assumed that rapamycin would inhibit the G1/S transition.23 We measured cell numbers in the cell cycle stages, as indicated below, to assess the G1/S transition control at T0 and T48.
Assessment of G1/S transition checkpoint function
The cultured lymphocytes were fixed in 70% ethanol at 4℃ for 10 min to measure cell number in each stage. The samples (1×10⁶ cells for each) were washed twice with ice-cold phosphate buffered saline, and incubated with RNase, DNA intercalating dye, and 2.0 mL of DAPI (Cystain DNA 1step, Partec, Görlitz Germany). We used a PAS flow cytometer (Partec) and the ModFit LT 3.0 Partec software to measure the proportion of cells in each cell cycle phase (Fig. 1A). At least 1×10⁴ events were analyzed, and the assay was repeated twice. We evaluated the proportion of G1 and S phases at T0 and T48 from the patients with AD and the normal controls.
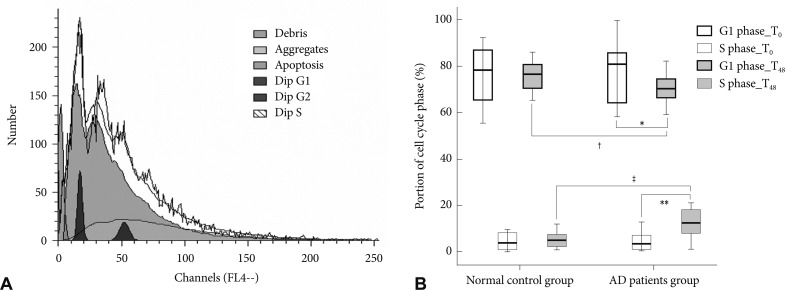
A: Analysis of the cell cycle phase using a PAS flow cytometer. This figure is a graph obtained by the PAS flow cytometer produced during an assay of peripheral lymphocytes. It shows the distribution of cells according to their DNA. Each cell was categorized as G1 or S phase based on DNA content, and the proportions of the cell cycle phases were calculated using ModFit LT 3.0 Partec software. B: Comparison of the cell cycle between patients with Alzheimer's disease and normal control subjects. Mean value of the proportion of cells in the G1 and S phase by the cell cycle analysis of peripheral lymphocytes. *the proportion of cells in the G1 phase at T48 was lower than that at T0 (p=0.02), **the proportion of cells in the S phase at T48 was higher than that at T0 (p=0.002) in patients with AD, †the proportion of G1 phase cells at T48 in patients with AD was lower than that in the normal control subjects (p=0.01), ‡the proportion of S phase cells in the patients with AD was higher than that in the normal control subjects (p=0.001). Dip: diploid, AD: Alzheimer's disease.
Statistical analysis
We used the independent two-sample t-test and the Mann-Whitney test with Bonferroni's correction to evaluate the difference in the proportion of G1 and S phase cells between the patients with AD and normal controls at each point. Pearson's partial correlation and Spearman's partial correlation analyses were applied to adjust for age. The paired t-test and Wilcoxon's signed-rank test with Bonferroni's correction were used to evaluate the differences in the cell cycle phase between T0 and T48 in each group. The relationships between the proportion of G1 phase cells at T48 and the clinical scores reflecting disease severity (CDR, K-MMSE, S-IADL, S-IADL, and duration of illness) in patients with AD were tested using Pearson's correlation and Spearman's correlation analyses. We divided the patients with AD into three groups according to their CDR score (CDR score 0.5 or 1, CDR score 2, and CDR score 3). The differences in the proportion of G1 phase cells at T48 among these groups were evaluated using the Kruskal-Wallis test.
RESULTS
Subject characteristics
No significant differences were observed in the female/male ratio (AD 16/10 vs. control 19/9, p=0.62) or educational status (AD 8.76±5.42 years vs. control 10.39±4.21 yr, p=0.22) between the patients with AD and normal controls. The patients with AD were older than that of the normal controls (AD 74.03±7.90 yr vs. control 68.28±6.21 yr, p=0.004), so all results were adjusted for age. The patients with AD had mild to severe dementia with a mean K-MMSE score of 17.34 (SD, 6.26). Sixteen patients had CDR scores of 0.5 or 1, eight had a CDR score of 2, and two had a CDR score of 3 (Table 1). A total of 24 patients received cognitive enhancers [donepezil (n=7), galantamine (n=13), or memantine (n=4)] and two patients received sertraline. We divided the patients into subgroups according to their medications. No significant differences were observed for gender, age, education, K-MMSE, or CDR scores among the subgroups taking cognitive enhancers, as well as among the four subgroups taking any medication.
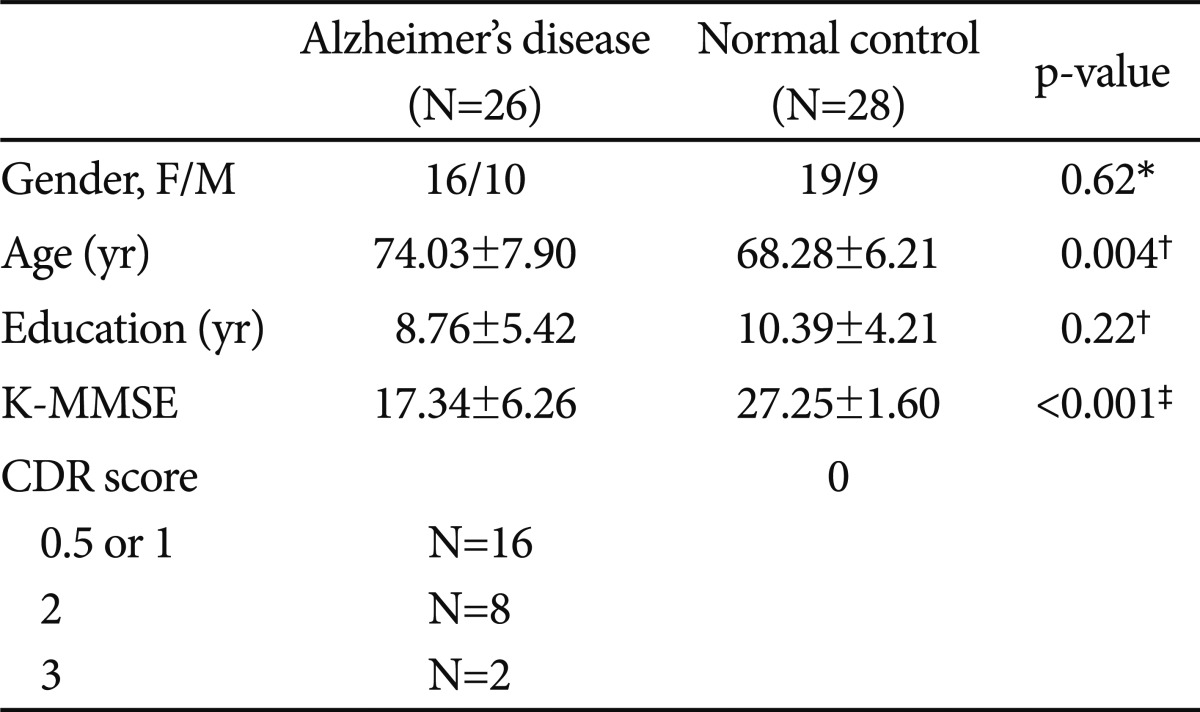
The baseline demographic and clinical characteristics of the patients with Alzheimer's disease and normal control subjects
Analysis of cell cycle phase at T0 and T48
We found (i) A 24 hr PHA incubation followed by a 24 hr rapamycin incubation resulted in no net change in the G1 and S phases in control subjects; (ii) there was evidence of activation of the cell cycle (fewer in G1 and more in S phases) in patients with AD. The cell cycle analysis at T0 did not show any differences between the AD and control groups (G1 phase; p>0.99, S phase; p>0.99). After cell cycle reactivation at T48 and following the rapamycin treatment, the proportion of G1 phase cells in the AD group was lower than that in the control group (70.29±6.32% vs. 76.03±9.05%, p=0.01) and the proportion of S phase cells in the AD group was higher than that in the control group (12.45±6.09% vs. 6.03±5.11%, p=0.001) after adjusting for age (Table 2 and Fig. 1B).
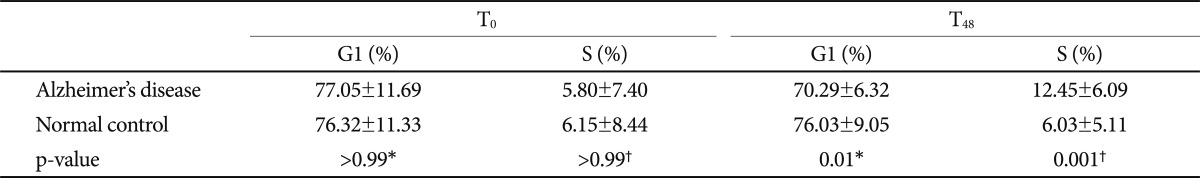
The proportion of cells in the G1 and S cycle phases in patients with Alzheimer's disease and normal control subjects
We compared the cell cycle between T0 and T48 in each group. The cell cycle in the control group at T48 was not different from that at T0 (G1 phase; p>0.99, S phase; p>0.99). The proportion of G1 phase cells at T48 in the AD group was significantly lower than that at T0 (70.29±6.32% vs. 77.05±11.69%, p=0.02), and the proportion of S phase cells at T48 was higher than that at T0 (12.45±6.09% vs. 5.80±7.40%, p=0.002) (Fig. 1B). We also compared the cell cycle at T0 and T48 in each subgroup according to the medications to exclude the influence of medication, and no significant differences in the cell cycle analysis were observed among the subgroups.
Disease severity and G1/S transition control
No correlation was found between the proportion of G1 phase cells at T48 and the clinical scores reflecting dementia severity (CDR, K-MMSE, S-IADL, S-ADL, and duration of illness) in the AD group (CDR, ρ=0.14, p=0.49; K-MMSE, r=0.25, p=0.22; S-IADL, r=-0.19, p=0.34; S-ADL, ρ=-0.05, p=0.80; duration of illness, r=-0.13, p=0.53).
DISCUSSION
When peripheral lymphocytes from patients with AD were activated with PHA and then treated with the G1/S transition inhibitor rapamycin, the cells displayed a significantly greater proportion of late S phase stage cells in comparison to cells from control subjects. This demonstrates that the peripheral lymphocytes from patients with AD were less responsive to rapamycin. These data support the hypothesis that the known defect in the G1/S checkpoint in neurons from patients with AD is reflected in peripheral lymphocytes. These results correspond with a previous study that reported poor responsiveness to rapamycin by peripheral lymphocytes from patients with AD.6 That previous study analyzed the relative lengthening of the G1 phase of the cell cycle, which was calculated based on many assumptions. We validated their findings by evaluating the proportion of G1 and S phase cells in the cell cycle based on flow cytometry.
We assumed that there might be some defect in cell cycle control in peripheral lymphocytes as well as in neurons from patients with AD. The fate of cells that are unable to complete mitosis depends on the phase in which the cycle was arrested.10 Cells in early G1 phase are able to exit the cycle and redifferentiate. However redifferentiation is no longer possible if the cells have reached the G2 phase24 and the cells then have one of two fates; they either die via a mechanism that resembles apoptosis or survive and produce AD pathology.25 The dysregulation of the G1/S transition checkpoint is necessary for AD pathogenesis.6
We found that G1/S transition control had no correlation with clinical scores reflecting disease severity. Nagy et al.6 suggested that the lymphocyte response in subjects showing neuropsychological signs of preclinical AD is similar to that seen in patients with AD. This indicates that a defect in G1/S transition control in peripheral lymphocytes of patients with AD is not affected by the disease course and may represent the disease entity of AD. Thus, G1/S regulatory failure detected in peripheral lymphocytes might be an early biological manifestation of AD. Our results support the possibility that peripheral lymphocytes may reflect the situation in the brain. An increasing body evidence indicates that peripheral lymphocytes may be exploited as a neural and possible genetic probe in psychiatric disorder studies.5,7 The use of brain biopsies of living patients is unrealistic for biochemical studies, and lymphocytes may be a convenient and accessible alternative. Numerous studies on psychiatric disorders have shown that alterations in metabolism and cellular function in the central nervous system, as well as disturbances in the main neurotransmitter and hormonal systems are concomitant with altered cellular and metabolic functions in peripheral lymphocytes.26,27
We tried to minimize other influences by excluding patients with other significant psychiatric, neurological, or medical illnesses. Our results do not identify the mechanism of the G1/S dysregulation that was manifested as a poor response of peripheral lymphocytes to rapamycin. Further research must be conducted to elucidate the nature of the G1/S regulatory failure, particularly on the cell cycle regulatory proteins and genetic components that are responsible for such a defect. Additionally, prospective studies will be required to evaluate the diagnostic potential of these findings.
Acknowledgments
This study was supported by a grant from the National Research Foundation of Korea funded by the Korean government (MEST, R0A 2007-000-20129-0) and the Korea Health 21 R&D Project funded by the Ministry of Health & Welfare (A030001), Republic of Korea.