Reliability and Validity of the Korean Version of the Impaired Control Scale
Article information
Abstract
Objective
The aim of this study was to examine the reliability and validity of the Korean version of the Impaired Control Scale (K-ICS), a scale to screen patients with alcohol use disorder.
Methods
Participants were 173 inpatients with alcohol use disorder (AUD), and 174 normal controls (NC). Both AUD and NC groups completed the K-ICS as well as the Alcohol Dependence Scale (ADS), the Alcohol Abstinence Self-Efficacy Scale (AASES), the Brief Self-Control Scale (BSCS), and the Hospital Anxiety and Depression Scale (HAD).
Results
The internal consistencies of K-ICS were good in both AUD and NC. A good convergent validity was clearly shown by significant correlations with the ADS and the AASES, respectively. But the K-ICS had no or weak correlations with the BSCS and the HAD. The ROC curve analyses indicated that the optimal cut-off points of failed control (FC) and predicted control (PC) were estimated as >15 and >13, respectively. Hierarchical multiple regression analysis suggested that FC is a robust predictor of the severity of AUD.
Conclusion
The K-ICS, especially FC subscale of it appears to be a valid and reliable measure of impaired control among both clinical and non-clinical sample.
INTRODUCTION
Alcohol use disorder (AUD) is characterized by a very high relapse rate. For example, the AUD relapse mostly occurs within 3–4 months after treatment, with 80% of inpatients suffering a relapse within six months after being discharged, while no more than 14.5% and 12.4% of them are known to remain abstinent from alcohol for more than 1 and 2 years, respectively [1]. Thus, as an addiction disorder, AUD has long been defined as a chronic self-regulation failure [2-5]. By the same token, DSM-5 [6] included in the key symptoms of AUD the “a persistent desire or unsuccessful efforts to cut down or control alcohol use,” describing AUD as a serious mental illness causing physical, emotional, social and occupational dysfunctions with the self-regulation failure and the repeated and chronic alcohol use [7].
Thus, examining the cause of the high relapse rate of AUD based on theories and empirical findings relevant to self-regulation may have significant clinical implications. Researchers on self-regulation define human self-regulation as “a process to change or override a dominant reactive tendency to regulate one’s own emotion, thinking or behavior.” [8-10] Specifically, according to the behavioral neurological decision-making system hypothesis, which is one of the overarching theories in research on self-regulation [11], the repeated relapse of AUD may be explained by the overactivation of impulse system and the under-activation of executive decision-making system. Therefore, AUD patients find it challenging to become free from alcohol use problems as they can hardly stay focused on their goals, set up and implement specific action plans to achieve the goals, and tend to impulsively react to positive or negative emotional stimuli. In addition, delay discounting referring to one’s preference for a short-term smaller reward to a long-term larger reward is often manifested in AUD patients [12-14].
Although definitions of self-regulation vary, they include goals in common as an important aspect of self-regulation [7,15]. In particular, the commitment of AUD patients to their alcohol abstinence goals is possibly an important predictor of the relapse. For example, AUD patients increase their alcohol consumption after a certain period of alcohol abstinence, which is called an abstinence violation effect [16,17]. The abstinence violation effect is a very useful concept for explaining the behavioral aspect of AUD patients who think of a single mistake as a ‘complete failure’ and diverge from the existing abstinence goals. Thus, in treating and preventing the relapse of AUD, precisely measuring the chronic alcohol self-regulation failure referring to the divergence from abstinence goals overrides anything else. Without doubt, alcohol abstinence self-efficacy [18] is known to be highly important to alcohol self-regulation. Conceptually, the alcohol abstinence self-efficacy is considered a cognitive trait and defined as a positive expectation of the extent to which one can cope with diverse situations that require self-regulation including negative emotion, social pressure, physical pain, withdrawal and craving. Many researchers agreed the alcohol abstinence self-efficacy was an important predictor of AUD relapse [16,19,20]. Yet, in that the alcohol abstinence self-efficacy predicts the relapse based on a cognitive variable, or an individual’s expectation about certain situations in near future, it may have limitations as an objective measure of the chronic self-regulation failure at present. Hence, it is necessary to develop an instrument for measuring the behavior of AUD patients so that they can check their drinking habits whether those habits are related to surroundings or learned.
Heather et al. [21-23] developed the Impaired Control Scale (ICS) to measure the reversible intermittent ‘impaired control’ instead of the irreversible fixed ‘lost control’ based on the concept of alcohol dependence symptoms suggested by Edwards and Gross [24]. The ICS is comprised of three parts designed to measure the severity of impaired control episodes over the past six months and in the future, i.e., Part 1 with 5 question items on attempted control (AC) (e.g., “During the last 6 months, I tried to limit the amount I drank”), Part 2 with 10 question items on failed control (FC) (e.g., “During the last 6 months, I found it difficult to resist drinking, even for a single day”), and Part 3 with 10 question items on predicted control (PC) in the future (e.g., What do you think would happen now? “It would start to drink, even after deciding not to”), adding up to 25 items in total. The FC and PC are composed of identical items excluding the point of time of the impaired control. Each item of the ICS is rated on a 5-point scale (0–4). The subscale scores are not totaled in the ICS. The ranges of subscale scores are 0–20 for AC, and 0–40 for FC and PC. Notably, in Part 2 (FC), in case one has not attempted any control, the AC is replaced by the responses to the PC items. The reliability and validity of the ICS have been verified in both clinical and non-clinical samples [23]. Also, Marsh et al. [5] conducted a confirmatory factor analysis and confirmed each sub-factor was a single factor in both social drinker and AUD patient samples.
Moreover, a study on adolescent’s alcohol consumption [25] used the ICS as the criterion-related scale. Particularly, the FC was used as an important factor in predicting the effects of the controlled drinking treatment on adult AUD patients [22], and proved to predict the alcohol-related problems better than the weekly alcohol consumption in undergraduate samples [26]. Also, a cross-sectional study found the FC was negatively correlated with general self-regulation [27], whilst a study on adult binge drinking demonstrated the PC mediated the relationship between impulsivity and alcohol problems [28]. A longitudinal study following up undergraduates for three years established the FC was a significant predictor of future alcohol-related problems. Also, a large-scale neuroimaging study on binge drinkers [29] found significantly positive correlations between the FC and bilateral amygdala, left dorsolateral prefrontal cortex and left nucleus accumbens.
Given the ICS has consistent reliability and excellent validity, predicts alcohol use problems in many studies, and is widely used to verify the effects of addiction treatment, a standardized Korean version of ICS would have substantial clinical benefits. Thus, this study adapted the ICS in Korean, and verified its reliability and validity, so as to present the cut-off points for distinguishing the AUD patient group from the general population based on the K-ICS, and shed light on the clinical benefits of the K-ICS by determining its predictability about the severity of symptoms in the AUD patient group.
METHODS
Subjects
The subjects of this study were AUD patients (n=173) and normal controls (n=174). Both groups consisted of males aged 20–69. The AUD patients were recruited at four sites including 2 alcohol addiction centers run by an alcohol clinic in Gwangju Metropolis and a psychiatric hospital in Gyeonggido, respectively, and an alcohol addiction center attached to a general hospital in Daejeon Metropolis. The AUD patients were inpatients who met the criteria for diagnosing AUD as per DSM-56 and were diagnosed with AUD by psychiatrists. Among those who were willing to participate in the study, those who met at least one of the following criteria were excluded: 1) expressing severe aggressiveness and hostility, 2) being unable to read and write Korean, 3) being unable to respond to the self-report questionnaire due to organic issues such as visual impairment and brain injury, and 4) having other psychiatric disorders such as major depressive disorder, bipolar disorder, and so on.
The normal control group was recruited at diverse sites, e.g., local communities, religious groups and companies, through public notices seeking study participants. The criteria for selecting the normal control group included those who had not been diagnosed with AUD, scored no more than 11 out of 40 on the Korean Version of Alcohol Use Disorder Test (AUDIT-K) in accordance with the criterion as suggested by Lee et al. [30], and scored no more than 12 out of 49 on the Alcohol Dependence Scale developed by Lee et al. [31] The present study was approved by Ajou University Institutional Review Board (IRB No. 201412-HR-SB-002-02). All subjects were fully informed of the study objective and process prior to signing the consent form. Subjects provided their demographics and history of alcohol use and completed the following subscales.
Measures
Korean Version of the Impaired Control Scale
To measure the alcohol self-regulation failure, the ICS [21,23] developed to measure the impaired control manifested in AUD was used in this study. The ICS was translated by a clinical psychologist and a psychiatrist and was proofread by a bilingual person proficient at Korean and English before the adaptation. In addition, a question item selection committee comprised of the first author and 10 graduate students majoring in psychology assessed the fidelity of the translation and the readability of question items before selecting the final items.
Korean Version of Alcohol Use Disorders Identification Test
To screen the alcohol use problems in the normal control group, the AUDIT-K, Korean version of AUDIT [32] standardized by Kim et al. [33], was used in this study. The total score of the AUDIT-K is within the range of 0–40, where 12+ is rated as ‘problem drinking.’ In the current study, the cutoff score required to be qualified for the normal control group was 11 or under on the AUDIT-K.
Alcohol Dependence Scale
To determine the severity of alcohol problems in the normal control group and to verify the convergent validity of the K-ICS, the Alcohol Dependence Scale (ADS) developed by Skinner and Allen [34] was used. The ADS, standardized for Koreans by Lee et al. [31], is a self-report scale composed of 25 items: 5 on obsessive compulsive drinking, 8 on alcohol-related behavior control disorder, 6 on alcohol-related physical withdrawal, and 6 on alcohol-related perceptual withdrawal. The total score on the ADS is within the range of 0–49, where the criteria for mild, moderate and severe dependences are 13 or under, 14–21, and 22 or over, respectively. In this study, the cutoff score for the normal control group was 12 or under on the ADS.
Alcohol Abstinence Self-Efficacy Scale
The Alcohol Abstinence Self-Efficacy Scale (AASES) is a self-report test composed of 20 question items developed by Diclemente et al. [18] and standardized by Kim [35] in Korean. Specifically, the AASES is designed to test the extent to which one is confident about not drinking alcohol in diverse situations including negative emotion, social pressure, physical pain, withdrawal and craving. This study used the instrument to confirm the convergent validity of the K-AASES.
Brief Self-Control Scale
To verify the discriminant validity of the K-ICS, we used the Brief Self-Control Scale (BSCS) designed to measure the general self-control. The BSCS is a self-report scale composed of 13 question items adapted to Korean respondents by Hong et al. [36] from the Self-Control Scale (SCS) developed by Tangney et al. [37]
Hospital Anxiety and Depression Scale
Zigmond and Snaith [38] developed the Hospital Anxiety-Depression Scale (HAD), which is a self-report test designed to simultaneously measure depression and anxiety before respondents see doctors. The HAD consists of 14 question items, where 7 odd-numbered and 7 even-numbered items are anxiety and depression subscales, respectively. Each item is rated on a 4-point scale (0–3). The total anxiety and depression scores are within the range of 0–21, respectively. In a study on the standardization of the Korean version, Oh et al. [39] reported the cutoff score of each subscale was 8. The present study used the HAD to verify the discriminant validity of the K-ICS.
Statistical analysis
Collected data was analyzed in the following order. First, to verify the homogeneity of the two groups, the demographics including age and education and the age at first alcohol use underwent independent samples t-test. Second, to determine the validity of the constructs of the K-ICS, the exploratory factor analysis was conducted, and the item-total correlation and internal consistency were calculated. As for the size of the factor loading, whether to select each item was determined based on 0.40 as suggested by Kline [40]. Third, to verify the convergent and discriminant validity of the K-ICS, the K-ICS, ADS, AASES, BSCS, and HAD scores underwent the Pearson’s correlation analysis. In accordance with Cohen [41], correlation coefficients (r) are interpreted as follows: under 0.20 as a weak correlation, 0.20–0.40 as a moderate correlation, 0.40–0.60 as a relatively strong correlation, 0.60–0.80 as a strong correlation, and over 0.80 as a very strong correlation. Fourth, the inter-group differences on the K-ICS were determined with the analysis of covariance, where age and education were set as covariates, while the optimal cutoff scores were found with the receiver operating characteristic (ROC) curve analysis. Finally, to verify the criterion-related validity of the K-ICS in the AUD group, we conducted the hierarchical multiple regression analysis and calculated the incremental explanatory power of the K-ICS after setting the ADS as a dependent measure and controlling for education, BSCS and AASES. When the correlation between variables is high in the hierarchical multiple regression analysis, the multicollinearity issue may arise that the accuracy of results decreases with the increasing variance of regression coefficients. Therefore, to determine if the multicollinearity occurred, we took into account the tolerance (≤0.1) and the variance inflation factor (VIF>10).
IBM® SPSS® version 23.0 (IBM Corp., Armonk, NY, USA) and Medcalc® verion 17.6 (MedCalc Software, Ostend, Belgium) were used for data and ROC analyses, respectively. The statistical significance level was <0.05 based on the two-sided test.
RESULTS
Characteristics of subjects
The mean age at first alcohol use showed no significant difference between NC and AUD groups (Table 1). To secure the demographic homogeneity between the two groups, we attempted to have their age and education match. Yet, the mean age of the AUD group was significantly older than that of the NC group (t =-7.141, p<0.001), while the education level of the former was significantly lower than that of the latter (t=10.254, p<0.001). Although the demographic difference between the NC and AUD groups was well documented [5,42], this study increased the external validity of its results by using the two variables as control variables in the verification of the inter-group difference on the K-ICS and the analysis of criterion-related validity.
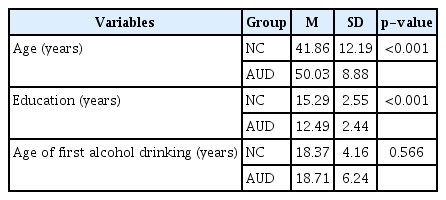
Demographic and clinical characteristics of subjects
Factor analysis and item-total correlation
The exploratory factor analysis was conducted of the three subscales of the K-ICS (Table 2). The factor loadings of the AC, FC and PC exceeded 0.40 as suggested by Kline [40], respectively, in both NC and AUD groups. Also, the explanatory variance of each subscale exceeded 40%, which means each subscale properly explains the entire scale.

The factor loadings and items-total correlations of the K-ICS
The item-total correlation of each item exceeded 0.40 in both NC and AUD groups. Also, in the NC group, the AC, FC and PC showed high internal consistency of 0.853, 0.903, and 0.919, respectively, which indicates high reliability. In the AUD group, the internal consistency of AC, FC, and PC was 0.770, 0.907, and 0.931, respectively.
Convergent and discriminant validity of K-ICS
In the NC group, the AC was correlated with neither FC nor PC, whereas the FC and PC were strongly correlated (Table 3). This finding suggests the AC could be an independent variable in the alcohol self-regulation. Both FC and PC had strong positive correlations with the ADS, which indicates the good convergent validity and the comparable correlation sizes. Still, the AC was not correlated with the ADS but positively correlated with AASES. Both FC and PC showed significantly negative correlations with the AASES. The AC was not significantly correlated with BSCS, HAD-D, and HAD-A, whilst the FC and PC showed relatively weak correlations with BSCS, HAD-D, and HAD-A, which indicates the good discriminant validity.
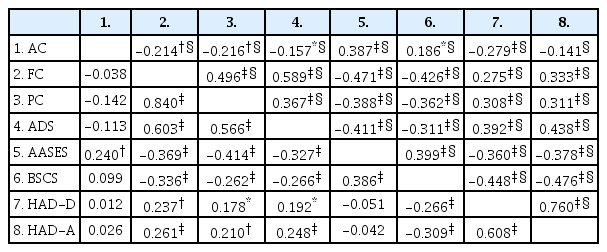
Correlations among variables of interest
In the AUD group, the AC showed a weak negative correlation with the FC and PC. Also, a relatively strong correlation was found between the FC and PC. The FC showed a relatively strong positive correlation with the ADS, whereas the PC had a weak correlation with the ADS. That is, the convergent validity of the FC was largely high, whereas that of the PC was rather low. Meanwhile, the weak negative correlation between the AC and ADS suggests the AC could be a variable independent of the ADS. Also, the FC had a relatively strong negative correlation with the AASES, whereas the PC had a weak negative correlation with the AASES. The AC had a weak positive correlation with the AASES.
As in the NC group, the AC had a weak positive correlation with the BSCS, whilst the HAD-D had a weak negative correlation with the HAD-A (in the AUD group). In addition, the FC had a relatively strong negative correlation with the BSCS, whilst the PC had a weak negative correlation with the BSCS. Thus, the FC converges on general self-regulation, whereas the PC has a relatively low degree of convergence. Meanwhile, both FC and PC showed largely weak correlations with HAD-D and HAD-A, which indicates the good discriminant validity.
Inter-group difference on K-ICS
Prior to the ROC curve analysis, we verified the differences in the three subscale scores on the K-ICS between AUD and NC groups. To that end, we conducted the analysis of co-variance with the age and education level set as covariates. As shown in Table 4, the AC showed no significant inter-group difference, whereas the FC and PC showed significant intergroup differences. Given η2 ≥0.14 as per the criterion suggested by Cohen [41], the group effects were substantially large. That is, although the control attempted by the AUD group paralleled that by the NC group, the former showed higher failure rates and presumed future control failures.

Comparison of K-ICS scores between AUD and NC group
ROC curve analysis
Since the AC showed no significant inter-group difference in the foregoing analysis of covariance (ANCOVA), the ROC curve analysis was applied to the FC and PC, not AC (Table 5 and 6). The ROC curve analysis found the optimal cutoff score of the FC was 15 or over (AUC=0.962, SE=0.010, 95% CI=0.936–0.980, p<0.001) (Figure 1), whilst that of the PC was 13 (AUC=0.913, SE=0.016, 95% CI =0.877–0.940, p<0.001) (Figure 2).

The values of accuracy indices according to various cutoff scores of K-ICS-FC

The values of accuracy indices according to various cutoff scores of K-ICS-PC
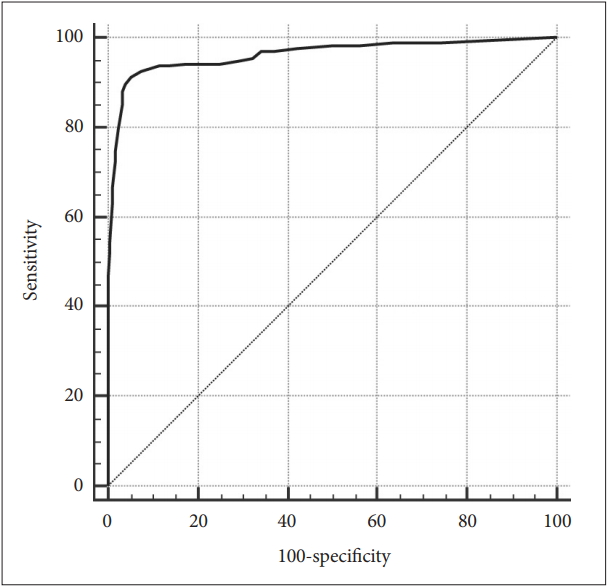
Receiver operating characteristic curves of the Korean version of the Impaired Control Scale-Failed Control.
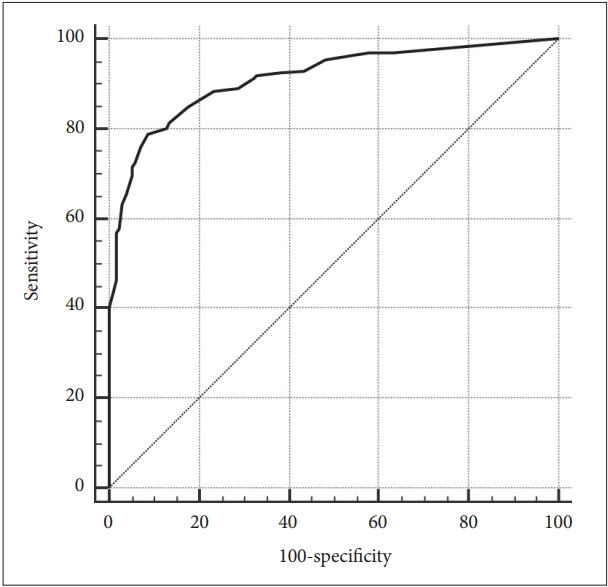
Receiver operating characteristic curves of the Korean version of the Impaired Control Scale-Predicted Control.
Criterion-related validity
To determine the criterion-related validity of the K-ICS, we conducted the hierarchical multiple regression analysis, where the ADS was set as the dependent variable, while age, education, general self-regulation (BSCS) and abstinence self-efficacy were set as control variables. As shown in Table 7, the three subscales of the K-ICS explained the ADS by extra 20.8% even when age, education, general self-regulation (BSCS) and abstinence self-efficacy were controlled. In particular, among the subscales of the K-ICS, the FC had the greatest explanatory power about the ADS, whereas the AC and PC had no significant explanatory power.

Results of hierarchical multiple regression analysis of K-ICS on ADS among AUD group
DISCUSSION
Developed by Heather et al. [21,23] to assess the impaired self-regulation in AUD, the ICS has been widely used abroad in research on youths and adults with alcohol use problems to determine the predictors of alcohol use problems, the measures of treatment effects, and the criterion measures of neurobiologically abnormal reactions relevant to AUD. Despite the empirical grounds supporting the utility of the ICS, the ICS had not been standardized in Korea.
Therefore, the present study adapted the ICS in Korean to test the impaired self-regulation in AUD, and verified its reliability, validity and clinical utility. The present findings highlighted the following.
First, each item of the three subscales of the K-ICS showed a very high factor loading and a satisfactory explanatory power in both NC and AUD groups. In brief, the K-ICS appropriately reflected the constructs of AC, FC, and PC.
Second, the AC, FC, and PC showed good internal consistency overall in both groups. In particular, the FC (NC: 0.903, AUD: 0.907) and PC (NC: 0.919, AUD: 0.931) had the internal consistency higher than that reported in Heather’s research on cross-validation [23] or comparable to the result reported by Marsh et al. [5] By contrast, in the AUD group, the internal consistency of AC (α=0.770) was relatively lower than that reported in previous research. This finding may be attributable to the fact that the present study included long-term inpatients in the AUD group (mean frequency of hospitalization: 6 times, range: 1–40 times), whereas the previous studies included not only inpatients but also outpatients and patients in day hospitals [23], or to the relatively mild AUD with 72% of subjects having been treated for less than 6 months [5].
Third, the K-ICS had good convergent and discriminant validity overall. Particularly, in both NC and AUD groups, the FC showed a strong correlation with the ADS, and a relatively strong correlation with the AASES, indicating the high convergent validity. In contrast, the FC showed a relatively weak correlation with the BSCS, inconsistent with the general self-regulation. In addition, in both groups, the FC showed a very weak correlation with each of the two subscales, i.e., depression and anxiety, of HAD which specifies emotional problems, and indicated good discriminant validity.
Fourth, the inter-group difference in the AC was not significant in the ANCOVA. This finding disagrees with Marsh et al. [5] result that the AC was significantly higher in their AUD patient group in comparison to their social drinker group. Yet, the disagreement between the two studies may be attributable to the fact that the subjects Marsh et al. [5] included in their AUD group were not inpatients. That is, the AUD patients included in the present study had been treated for addiction and thus attempted to control their alcohol use like the NC group. With age and education controlled, the FC and PC showed significant inter-group differences. That is, compared to the NC group, the AUD group had failed to control the alcohol use over the past 6 months, and was expected to do so in the coming months.
Fifth, in the ROC curve analysis of FC and PC, but not AC because of the inter-group differences in the subscales of the K-ICS, the AUD group scored over 0.90 in the FC and PC, which indicates a high discriminant power between the AUD and NC groups. Also, the optimal cutoff scores for the FC and PC were minimum 15 and 13, respectively.
Finally, in the analysis of criterion-related validity with the effects of control variables eliminated, the K-ICS showed an incremental explanatory power by 21% or so. Notably, even after the effects of control variables were taken into account, the FC showed an excellent predictive power about the ADS. Yet, the AC and PC showed no significant incremental explanatory power about the ADS. That is, in predicting the alcohol use problems, behavioral variables such as self-monitoring of one’s past behavior are likely to be a stronger predictor of the PC than cognitive variables such as presumptions. This is why the FC was primarily used among the three subscales of the ICS in previous studies on treatment effects and neuroimaging [22,26,29].
The present study has the following limitations. First, other variables such as family history and medication that could impact on the subjects’ self-regulation of alcohol were not duly considered. Second, the self-report ratings in the AUDIT-K and ADS used to select the normal controls may have triggered some positive biases. Hence, future studies need to conduct indepth interviews with mental health specialists in selecting the normal controls. Third, this study used the ADS as the only criterion variable of the K-ICS. Thus, future studies need be based on actual behavioral measurements such as alcohol consumption when subjects sleep out or go out to test the convergent validity of the K-ICS. Fourth, this study did not measure the test-retest reliability of the K-ICS, failing to secure the consistency of the K-ICS over time, although the consistency of results over time may be less required of the K-ICS which measures individuals’ behavioral aspects or states for a certain period of time instead of their general tendencies or traits.
Despite the foregoing limitations, the present study should be noted in that it verified the objectivity and validity of the K-ICS as an instrument for measuring the impaired self-regulation of alcohol in both normal control and clinical samples in research on AUD. Particularly, the finding that the predictive power of FC over the past six months outstripped that of PC in predicting the severity of alcohol dependence suggests behavior-oriented approaches need be taken in research on AUD in lieu of cognitive approaches.
The present study adapted the ICS widely used abroad to measure the impaired self-regulation of alcohol into the KICS and verified its reliability, validity and clinical utility. Hence, the proposed cutoff scores of the FC and PC are deemed conducive to duly screening people for alcohol problems, regularly monitoring clinical patients for impaired self-regulation of alcohol, and ultimately preventing the relapse of AUD. Furthermore, the limitations of the present study warrant further studies.