Reversed Hand Movement during Sleep in Patients with Obstructive Sleep Apnea
Article information
Abstract
Objective
Previous findings suggest that hand movement laterality is reversed during sleep. The present study aimed to verify this phenomenon and evaluate whether the extent of reversal is correlated with the severity of sleep apnea.
Methods
A total of 184 participants (mean age: 44.5±13.0 years; 81.5% males) wore actigraphs on both hands during sleep, and nocturnal polysomnography was simultaneously performed.
Results
Actigraphic indices of hand movement were significantly higher for the left hand than those for the right hand (p<0.001), including total activity score, mean activity score, mean score in active periods and fragmentation index. Additionally, calculated differences between the fragmentation index for the left versus right hands were significantly correlated with the apnea-hypopnea index (AHI, r=0.149, p=0.032). The AHI was not significantly correlated with differences in hand movement between both hands movement assessed by total activity score (r=0.004, p=0.957), mean activity score (r=0.011, p=0.876), mean score in active periods (r=-0.080, p=0.255).
Conclusion
More severe symptoms of obstructive sleep apnea was associated with larger degree of hand movement reversal at night. This result support the theory that homeostatic deactivation occurs in the dominant hemisphere during sleep.
INTRODUCTION
Handedness depends on cerebral hemispheric laterality, which is innately determined. Approximately 7–11% of the general population is right hemisphere dominant, which is expressed as left-handedness [1]. It is well known that the dominant hand moves far more frequently than the non-dominant hand during the day [2], however, previous studies suggested that the laterality of hand movements changes during sleep. This phenomenon was first reported by Jovanovic, who conducted electromyography in 20 participants during nocturnal sleep and found that the non-dominant hand moved approximately twice as often, regardless of REM/non-REM phases [3,4]. It has repeatedly been shown that the laterality change occurs during sleep in subsequent studies which used actigraph [4,5] or electroencephalograph (EEG) [6-8]. Previous studies tried to find out how laterality changes during sleep by observing specific sleep periods [7-9], meanwhile, some of them used more sophisticated methods such as behavioral tasks to evaluate underlying mechanism [10].
Three main hypotheses have been suggested to explain this reversal of laterality during sleep. First, the homeostatic hypothesis, also called the use-dependent recovery hypothesis [11], emphasizes the restorative function of sleep, which is generally accepted as one of its most critical functions. Based on this hypothesis, the dominant hemisphere shows greater need for sleep than the non-dominant hemisphere since the dominant hemisphere is more active during waking. There are a few studies that support this hypothesis, including the work of Violani et al., in which 16 right-handed participants were observed, using actigraphy on both hands for 57 hours. Right hand dominance was observed during the day, but laterality was reversed during nocturnal sleep. The authors suggested that the reversal phenomenon may be closely related to restoration of the dominant hemisphere because they found that the reversal mainly occurred during the early phases of sleep, in which slow-wave sleep is primarily observed [12].
A second hypothesis focuses on the unique functions of the non-dominant hemisphere and is termed the arousal hypothesis. A study by Casagrande and Bertini [10] provided evidence for this theory by assessing response speed on a bimanual finger-tapping test. The authors found that the left cerebral hemisphere dominance that occurred when participants were awake was clearly reversed during the hypnagogic phase as well as with experimentally induced awakening from sleep. Based on their findings, authors suggested that the nondominant hemisphere might produce better performance during states of reduced arousal, compared to the dominant hemisphere.
A third hypothesis proposes that changes in hand movement laterality during sleep occur because the cerebral hemispheres have different circadian rhythms. Previous studies reported earlier onset of sleep in the left hemisphere compared to the right hemisphere of right-handed participants and these findings were thought to be consistent with use-dependent recovery hypothesis [13,14]. However, a subsequent study found that changes in the laterality of hand movements during sleep did not occur in left-handed participants [4]. The author concluded that lack of shift in motor activity levels from the dominant to the non-dominant hand during sleep in left-handed subjects indicates a different circadian phase relationship between the two hemispheres.
Studying laterality reversal during sleep in patients with obstructive sleep apnea (OSA) would have two advantages. First, as patients with OSA move more during sleep compared to participants without OSA [15], a larger data set would be obtained. Second, examination of the relationship between the severity of OSA and the extent of laterality changes may provide insight into the physiological significance of this phenomenon. The goals of the present study were to verify the reversal of hand movement laterality in patients with obstructive sleep apnea and to examine whether any observed reversal is correlated with the severity of OSA
METHODS
Study design and participants
The present study was a prospective study and conducted at the Konkuk Medical Center, Seoul, Republic of Korea. It was approved by the Institutional Review Board of the Konkuk University Hospital (KUH1050080) and all participants provided written informed consent. Data from 237 righthanded participants who were diagnosed with OSA by nocturnal polysomnography (PSG) between 2008 and 2013 were analyzed. Exclusion criteria included any sleep disorders other than OSA or a history of major neuropsychiatric illness. The participants ranged in age from 18–79 years [mean±standard deviation (SD): 44.3±12.8 years]. A total of 196 participants were men (42.5±12.9 years, range: 18–79 years) and 41 participants were women (53.5±9.6 years: range, 24–68 years).
Apparatus
To measure activity in both hands, actigraphic recordings were obtained using octagonal motionlogger Actiwatch® devices (Mini-mitter Co, Inc., Bend, OR, USA). Actigraphs were initialized for zero crossing, with a 30-s epoch and 40-V threshold.
Computerized polysomnography (Medcare-Embla®, Reykjavik, Iceland) included EEG, electrooculography, mandibular electromyographs (EMG), lower limb EMGs, electrocardiography, nasal/mask pressure, and chest/abdominal movements. Airflow was measured by a thermistor and a nasal pressure cannula. Oximetry sensors recorded pulse and Oxygen saturation (SpO2) and were worn on both hands to remove artifacts and to control for sensitivity.
Data analyses
Polysomnographic data were scored according to standard criteria [16] by two experts. Sleep stages were manually recorded within a 30-s epoch, and the following variables were calculated: time in bed (TIB), sleep period time (SPT), total sleep time (TST), sleep latency (SL), and sleep efficiency (SE). The severity of OSA was mainly evaluated using the apneahypopnea index (AHI), defined as the number of apnea and hypopnea events per hour. Additionally, ODI was calculated by dividing the total oxygen desaturation (4% decrease in SpO2) by the total sleep duration (hours). Average SpO2 and the lowest SpO2 were also measured in terms of OSA severity. Participants with AHI <15 were classified as snorers, participants with AHI ≥15 and <30 were classified as having mild to moderate OSA, and participants with AHI ≥30 were classified as having severe OSA. Actigraphic data were analyzed automatically by an Actiware® program (version 3.4, Minimitter Co, Inc.). Calculated activity parameters included the following: total activity score (summation of all activity counts during the sleep period), mean activity score (the magnitude of activity on a per-epoch basis during sleep, determined by dividing the total activity score by the number of epochs during the assumed sleep period), mean score in active periods (the average activity score in those epochs where scores of greater than zero were recorded during the assumed sleep period), and the fragmentation index (an index of restlessness calculated by summing the percent of minutes moving and the percent immobility phases during 1 min). The extent of the reversal of laterality was calculated by subtracting values of right hand actigraphic indices from values of left hand actigraphic indices.
Procedure
Participants stayed overnight in the sound and temperature controlled sleep room. To compare movements between the left and right hands in one individual, the same exact sensitivity of the two actigraphs is required. This can be tested by attaching both actigraphs to a precision pendulum, and comparing activity variables measured by each actigraph [17]. However, this procedure has not been commercialized yet. Therefore, to control for possible discordance between the sensitivities of the actigraphs, we assigned the participants to one of two groups (Groups A and B), based on the dates of participation. Actigraph I was worn on the left wrist, and actigraph II was worn on the right wrist in Group A, whereas actigraph II was worn on the left wrist, and actigraph I was worn on the right wrist in Group B. We matched the two groups based on age, sex, and OSA severity, while blinded to their actigraphic data, resulting in 92 participants in each group, for a total of 184 participants. Fifteen participants were classified as snorers, 39 as having mild OSA, 40 as having moderate OSA, and 90 as having severe OSA. The mean age±SD and the men to women ratio for each group were as follows: Group A (44.5±13.2 years, M:W=75:17), Group B (44.6±13.0 years, M:W=75:17), and all participants (44.5±13.0 years, M:W= 150:34).
Statistics
We compared demographic variables and polysomnographic indices between the two groups as well as the actigraphic indices of the left and right hands between groups and across all participants, using Student’s t-tests or ANOVAs, as appropriate. Correlations between the actigraphic indices and AHI were analyzed using Pearson correlations. All statistical analyses were conducted using the statistical software package, SPSS for Windows, version 18 (SPSS Inc., Chicago, IL, USA). Two-tailed p-values less than 0.05 were considered statistically significant.
RESULTS
Demographic data for the two groups are presented in Table 1. There was no significant difference between groups for age, body mass index, or handedness. Systolic and diastolic blood pressures were higher in Group A; however, the difference was modest. When polysomnographic data were compared between Group A and Group B (Table 1), there were significant differences in diastolic blood pressure (p=0.040), TIB (p=0.004), SPT (p=0.005), percentage of stage 2 sleep (p<0.001), percentage of slow-wave sleep (p<0.001), and mean SpO2 values (p=0.022).

Descriptive characteristics of the participants
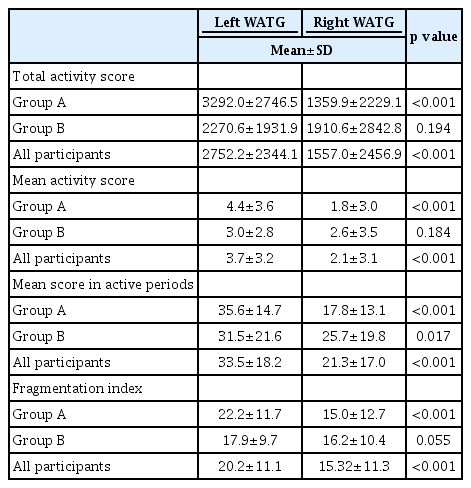
As shown in Table 2, movement differences between the left and right hands were larger in Group A than in Group B, for all four actigraphic indices. In Group A (participants wore actigraph I on the left wrist), a significant difference (p<0.001) was observed in all measured variables (total activity score, mean activity score, mean scores in active and fragmentation index), whereas in Group B (participants wore actigraph II on the left wrist), there was no significant difference for any of the variables. When the data from both groups were combined, hand movements were significantly greater in the left hand than in the right hand for all indices (Figure 1).
Comparison of the left and right actigraphic indices
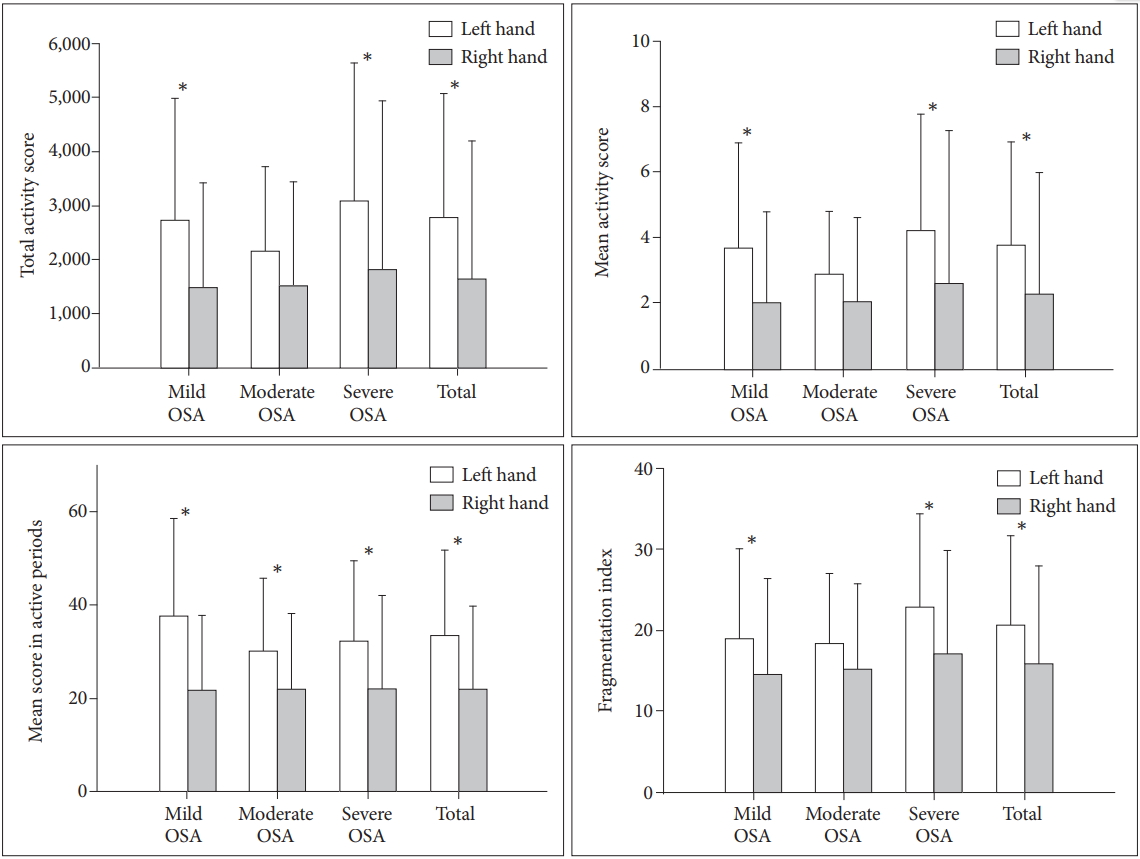
Comparison between the left and right actigraphic indices for all participants. Histograms show that the left hand actigraphic indices are significantly higher than those of the right hand, except for some measurements in participants with moderate OSA. *p<0.05. OSA: obstructive sleep apnea, AHI: apnea-hypopnea index.
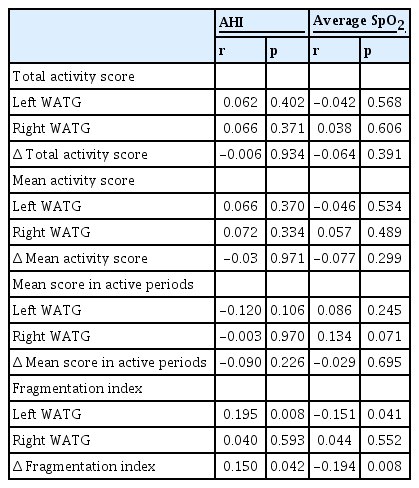
A correlational analysis was conducted to investigate the relationship between sleep apnea severity and movement in each hand as well as with movement differences between hands (Table 3). We found that AHI (r=0.150, p=0.042) and average O2 saturation (SpO2; r=-0.194, p=0.008) values were significantly correlated with the Δ fragmentation index (Figure 2).
Correlation analyses between hand movements and severity of OSA
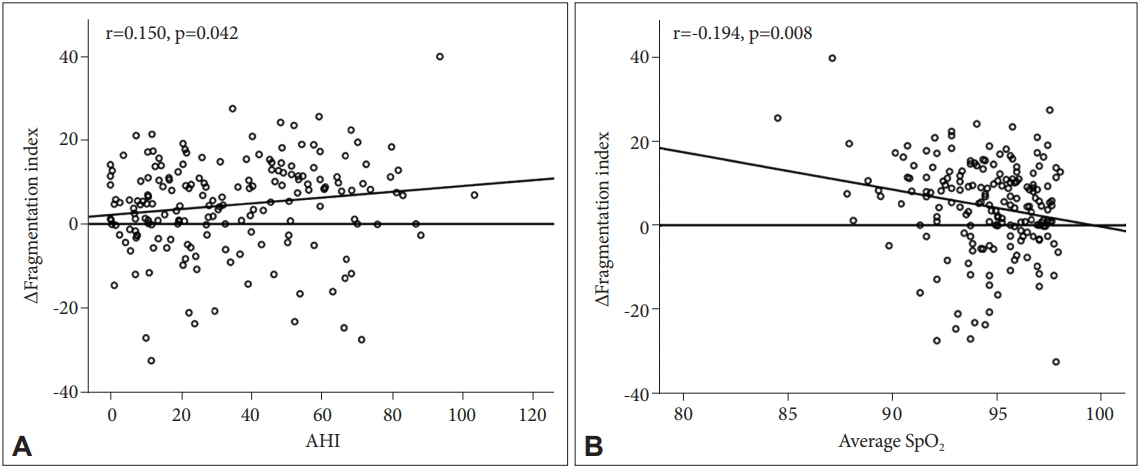
Correlation between Δfragmentation index and AHI (A); and average SpO2 (B). Scattered plot show that the Δfragmentation index is correlated with apnea-hypopnea index and average oxygen saturation. AHI: apnea-hypopnea index, SpO2: oxygen saturation.
DISCUSSION
In the present study, we showed that the left hand moves more actively than the right hand during sleep in right-handed OSA subjects. Furthermore, the difference in movement of both hands was significantly correlated with OSA severity in terms of AHI, ODI and average SpO2. To our knowledge, this is the first study to analyze the relationship between OSA severity and the difference in movements of both hands in patients with OSA. Having participants wear an actigraph on each hand while simultaneously performing nocturnal polysomnography enabled us to verify the left-hand dominance in hand movement during sleep and to evaluate the contribution of OSA to this phenomenon.
We showed that the values of all four actigraphic indices that quantitatively measured hand movement (total activity score, mean activity score, mean score in active periods, and fragmentation index) were markedly higher in the left hand than those in the right hand. This result is consistent with previous studies that reported the inversion of motor asymmetries during sleep [4,12,13]. Given the established association between the frequency of hand movements and handedness [14], the left dominance of hand movements in right-handed subjects during sleep observed in the present study is presumed to represent change in handedness; in other words, change in cerebral hemispheric laterality. Previous EEG data also support the idea that the laterality of the cerebral hemisphere occurs during at least some part of sleep. Sekimoto et al. [6] suggested right dominance of delta waves in the frontal and central regions during all-night sleep based on their observation in 20 right-handed subjects. In addition, several studies reported changes in hemispheric asymmetry in EEG activity during specific periods in the sleep/wake cycle, such as the sleep onset period [18,19], NREM sleep [20] or REM sleep [9]. Since we did not assess the motor activity of hands in terms of sleep phases, it was not possible to verify whether this change in laterality lasts throughout the whole sleep period or is localized to the specific sleep phases based on the results of the present study.
Patients with OSA frequently experience hypoxemia during sleep, and consequently, they conduct their daily activities under the lingering effects of it. They complain of sleepiness, tiredness, and fatigue during the day at higher levels than individuals without OSA. Moreover, the prevalence of neurocognitive impairments is higher in patients with OSA, especially in language, declarative memory, and executive functioning, which are mainly governed by the dominant hemisphere [21,22]. Therefore, the dominant hemisphere of patients with OSA may need greater restoration during sleep than individuals without OSA. In the present study, we showed that the AHI, ODI, and SpO2 were correlated with the Δ fragmentation index, which indicates the extent of the laterality reversal, and this result is presumed to support the idea that the laterality reversal phenomenon is a consequence of homeostatic deactivation of the dominant hemisphere. The results of several past studies that experimentally increased the burden to the human brain are consistent with this “homeostatic hypothesis”; Archermann et al. showed right hemispheric dominance of frontal EEG power after sleep deprivation in 8 right-handed healthy subjects [23], and Kattler et al. [24] found greater delta power in the left hemisphere in the first hour of sleep after applying vibratory stimulation on the right hand prior to sleep. In the present study, however, only the difference in the fragmentation index was significantly correlated with OSA severity among the 4 actigraphic variables indicating hand movements. This might be because the OSA severity was not evenly distributed in our sample. Of the 184 total participants, 90 had severe OSA, 79 had mild to moderate OSA, and only 15 were simple snorers. Including more participants who had severe symptoms than who had mild symptoms may have contributed to negative results on the other 3 variables.
Limitations should be noted in addition to those already mentioned. First, we tried to minimize and control for differences in sensitivity between the two actigraphs. Though, it is still possible that sensitivity differences influenced our results. Second, we matched the two groups based on demographic data and OSA severity, however, there were differences in several polysomnographic variables between two groups. Lastly, since we did not assess the motor activity of both hands during the waking state, we could not directly observe the laterality shift in our sample. Despite these limitations, we verified reversal of hand movement laterality during sleep by assessing hand movements in patients with OSA, and we think our results support the hypothesis that this phenomenon results from homeostatic deactivation of the dominant hemisphere during sleep.