Relationship between Autistic Spectrum Trait and Regional Cerebral Blood Flow in Healthy Male Subjects
Article information
Abstract
Objective
Autistic spectrum traits are postulated to lie on a continuum that extends between individuals with autism and individuals with typical development. The present study was carried out to investigate functional and network abnormalities associated with autistic spectrum trait in healthy male subjects.
Methods
Subjects were 41 healthy male subjects who underwent the social responsiveness scale-adult (SRS-A) and magnetic resonance imaging.
Results
There was significant positive correlation between the total score of SRS-A and the regional cerebral blood flow (CBF) in posterior cingulate cortex (PCC). Also, there were changes in functional network such as in cingulate corti, insula and fusiform cortex. Further, we also found the significant difference of functional networks between the healthy male subjects with high or low autistic spectrum trait, and these points were congruent with the previous perceptions derived from autistic-spectrum disorders.
Conclusion
These findings suggest a biological basis for the autistic spectrum trait and may be useful for the imaging marker of autism symptomatology.
INTRODUCTION
Autism spectrum disorder (ASD) is a neurodevelopmental disorder characterized by deficits in social interaction, communication, and the presence of repetitive or stereotypic behaviors [1]. According to a recent epidemiological study, ASD is currently estimated to be 1% to 2% of the adult population [2,3]. To identify the level of autistic spectrum traits, several instruments have been developed. The social responsiveness scale-adult (SRS-A) questionnaire is a useful instrument that was developed for identifying the extent of autistic spectrum traits [4]. Moreover, SRS-A is a validated measure of autistic spectrum trait found within both the normal subjects and individuals with a diagnosis of autism [5-7], and can measure autistic spectrum traits in individuals with non-autistic psychiatric disorders [8]. Previous family, clinical, and epidemiologic studies have suggested that although autistic disorder, as currently characterized in DSM-5, represents the upper extreme of a constellation of deficits in social and communicative behavior, autistic spectrum trait would be continuously distributed in nature, in other words, autistic spectrum trait are found not only at high levels in individuals with ASD but also at lower levels among individuals without ASD [6,9].
In terms of ASD-related neuroimaging study, research findings have been accumulated [10,11]. However, these studies have primarily investigated correlations between the severity of autistic symptoms and the various kinds of brain images in individuals with ASD. Only a few studies estimated the correlation between the autistic spectrum trait and the functional brain images of healthy subjects by resting-state fMRI [12,13], and detected that there were significant correlation between the autistic spectrum trait and the activity of posterior cingulate cortex. However, the relationship between the traits and the regional cerebral blood flow (CBF) image of healthy subjects have not been evaluated. Arterial spin labeling (ASL) MRI is a novel noninvasive technique that can measure regional CBF. ASL could measure CBF by taking advantage of arterial water as a freely diffusible tracer, avoiding the need for gadolinium or radioactive ligands; thus ASL would be a noninvasive and repeatable method of measuring CBF. Although only one study focused on the functional network of regional CBF in youth with ASD [14], the evaluation of CBF functional networks in healthy subjects with subthreshold autistic spectrum trait have not been conducted.
In this study, we evaluate the relationships between autistic spectrum trait measured by the SRS-A and the regional CBF using with pseudo-continuous ASL (PCASL), and between the functional network of regional CBF and the autistic spectrum trait using with graph theoretical approaches.
METHODS
Subjects
From December 2012 to June 2015, 48 healthy male subjects, recruited from the community through local magazine advertisements and our website announcement. These participants were interviewed for enrollment by a research psychiatrist using the Japanese version of the Mini-International Neuropsychiatric Interview [15]. Participants were excluded if they had a prior medical history of central nervous system disease or severe head injury, or if they met the criteria for mental retardation, substance abuse or dependence, and other psychiatric illness. 6 subjects were excluded because of the deficits of SRS-A data and 1 subject with brain abnormality was excluded. As a consequence, 41 healthy male subjects were finally involved in this study.
Graph Analysis Toolbox (see below) could not do the correlation analysis but examine the two-sample t test, then, we separated these subjects to two groups. One is the 20 healthy male subjects with upper-half of the SRS-A score above 38, and the other is the 21 subjects with lower-half of the SRS-A total score below 38.
After the study was explained to each participant, his written informed consent was obtained for participation in the study. This study was performed in accordance with the Declaration of Helsinki and approved by the ethics committee of the National Center of Neurology and Psychiatry (XXXX-238), Japan.
Autistic-like traits assessment
SRS-A is a quantitative measure of the autistic-like traits/symptoms for adults with modified wording of the original SRS [4], which was developed for 4 to 18-year-olds. Similar to the SRS for children, each SRS-A item is scored on a 4-point scale with total scores ranging from 0 to 195. SRS-A total scores are divided into the following 5 subscales: social awareness, social cognition, social communication, social motivation, and autistic mannerisms. In this study, the Japanese version of the SRS-A was distributed to either a family member of the subject [7], who knows the subject well enough to provide an accurate account of his behaviors during the preceding 6 months.
MRI data acquisition and processing
The MR studies were performed on a 3-T MR system (Philips Medical Systems, Best, the Netherlands). 3D T1-weighted images, PCASL, conventional axial T2-weighted images, and fluid attenuation inversion recovery images were acquired using the same parameters as described previously, and details of the calculation of rCBF are also described elsewhere [16]. On conventional MRI, no abnormal findings were detected in the brain in any subject included in the study. The CBF maps were then normalized with the diffeomorphic anatomical registration using the exponentiated lie (DARTEL) registration method using a template made from the average CBF maps of healthy subjects previously recorded at our center [17]. Each map was then spatially smoothed with a 4-mm fullwidth at half-maximum Gaussian kernel in order to decrease spatial noise and compensate for the inexactitude of normalization.
Graph theoretical analysis
Graph Analysis Toolbox (GAT) was used for the graph theoretical analysis in this study [18]. We applied the normalized regional CBF images of two groups, 20 high SRS-A subjects and 21 low SRS-A subjects (see ‘Subjects’), to GAT running in MATLAB 2013a (The Mathworks, Natick, MA, USA) with age as a nuisance covariate. The details of the process are described elsewhere [19]. We set the threshold as from the calculated minimum network density (Dmin), (in this case, Dmin=0.2397) to 0.5.
Statistical analysis
Statistical analyses for graphical images were performed using SPM8 software (Functional Imaging Laboratory, UCL, London, UK). Correlations between the regional cerebral blood flow and the scores of SRS-A were assessed using the subjects’ age and education year as nuisance variables. Only differences that met the following criteria were deemed significant. In this case, a seed level of p < 0.001 (uncorrected) and a cluster level of p<0.05 (uncorrected) were adopted. For graph-analysis, a one-tailed two-sample t test was used to analyse the regional differences of the network measures between the two groups. False discovery ratio (FDR) p<0.05 was used to correct for multiple comparisons.
RESULTS
The characteristics of the participants are shown in Table 1. There was significant positive correlation between the total score of SRS-A and the regional CBF in posterior cingulate cortex (PCC) (Figure 1). Then we evaluated the difference of functional network of brain between the groups with high and low SRS-A total score. 20 healthy male subjects with upper-half of the SRS-A score showed the significant nodal betweenness increase of the regional CBF in right middle cingulate cortex, bilateral precentral regions, left middle part of temporal pole, while the significant decrease in right anterior cingulate cortex, left inferior frontal operculum, left fusiform cortex, right insula, right olfactory cortex and right precuneus was reduced (Figure 2A). Further, they showed the significant increase of degree in right middle cingulate cortex, bilateral parahippocampal regions, left precentral region, left inferior temporal region, and left middle part of temporal pole, and the significant decrease in left cuneus, left triangular part of inferior frontal cortex, left middle and superior part of the frontal region, left fusiform cortex, right insula, left inferior occipital region, and right precuneus (Figure 2B). Significant increase of clustering coefficient in left calcarine region, left fusiform cortex, right Heschel gyrus, right insula, and left inferior occipital region, and the significant decrease in right middle cingulate cortex, and left precentral cortex were also detected in healthy male subjects with upperhalf of the SRS-A score (Figure 2C).
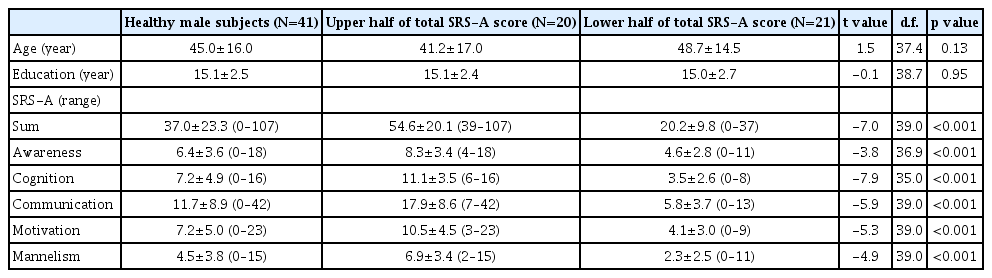
Characteristics of the study participants
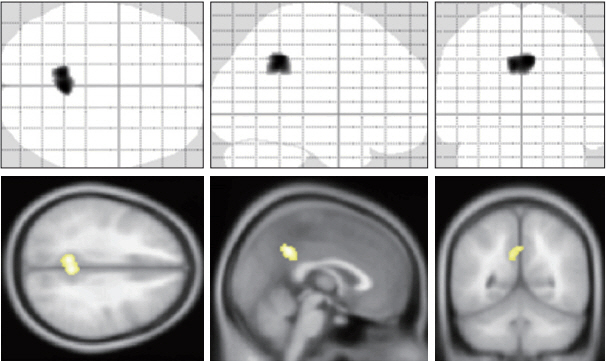
Correlation between the social responsiveness and the regional cerebral blood flow (CBF). There were significant positive correlations between the total score of social responsiveness scale-adult and the regional CBF in the posterior cingulate cortex.
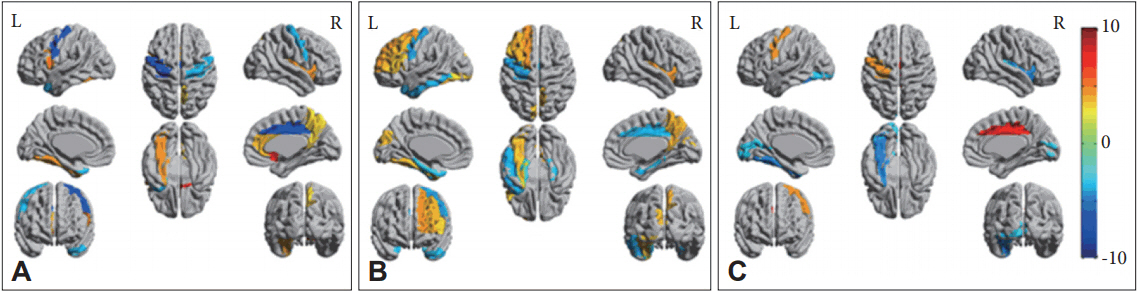
Findings of regional graph analysis. Regions that showed significant between-group differences in nodal betweenness (A), degree (B), and clustering coefficient (C) mapped on ICBM152 surface template. Hot color identifies the regions that have higher score in the low SRS-A subject, compared with high SRS-A subjects. While cold color identifies the regions that have higher score in the high SRS-A subjects. SRS-A: the social responsiveness scale-adult.
As for the subscales of SRS-A, we found the positive correlation between the social awareness subscale scores and the regional CBF in PCC (Figure 3A), between the social cognition subscale score and the CBF in medial prefrontal region and PCC (Figure 3B), and between the autistic mannerism subscale score and the anterior cingulate cortex (Figure 3C). There were no other correlations between the subscales of SRS-A and regional CBFs.
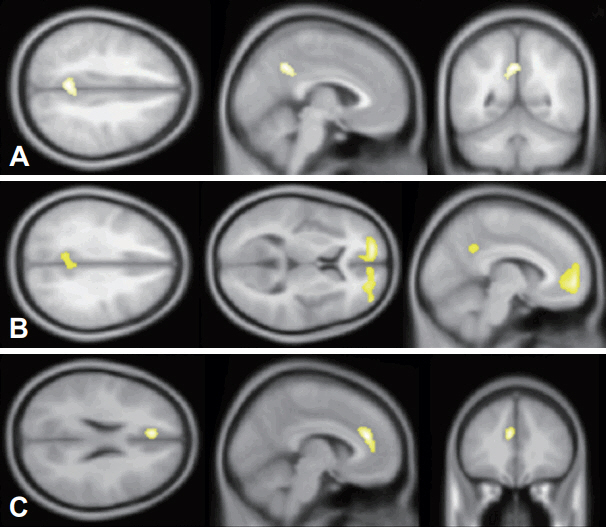
Autistic symptoms-specific regional changes of cerebral blood flow (CBF). A: There were significant positive correlations between the score of social awareness and the CBF flow in the posterior cingulate cortex (PCC). B: Significant positive correlations between the score of social cognition and the CBF in bilateral medial prefrontal corti and PCC. C: Significant positive correlation between the autistic mannnerism and CBF in the anterior cingulate cortex.
DISCUSSION
We evaluated the relationships between the regional CBF and the autistic spectrum trait in healthy male subjects. There were significant correlations between the regional CBFs and the autistic spectrum trait assessed by SRS-A. To our knowledge, this is the first study focusing on the relationship between autistic spectrum trait assessed by SRS-A and PCASL in healthy adults.
We found the significant correlations between the total score of SRS-A and regional CBFs in PCC. The functional connectivity analysis also detected the increase of integration indices, nodal betweenness and degree, and the decrease of segregation index, clustering coefficient, in PCC of the high SRS-A score subjects. Integration refers to the capacity of network to become interconnected and exchange information, while segregation refers to the degree to which network elements form separate clusters. In general, the larger degree, the lower the clustering coefficient. And these relationships were thought to be a possible compensatory mechanism that is triggered by the dysfunctional segregation [20]. Further, graph theoretical analysis detected the decrease of integration index in precuneus of the high SRS-A score subjects. These areas coincide with the common descriptions of the default mode network (DMN) [21]. DMN includes mPFC, PCC, precuneus, and parietal cortex [22-24], and being activated during not only the state when subjects are engaged in the introspective tasks [25], but also the state processing the social and emotional tasks [26-28]. Activity changes in mPFC were frequently related to social cognition, defined as information processing related to human individuals as opposed to the physical world [29]. Even though there is a considerable uncertainty about the function of the posterior cingulate cortex, functional neuroimaging studies assume a role in regulating the balance between internally and externally directed cognition [30]. Network impairments of default mode have been frequently found in the ASD [13,24,31,32]. As for healthy subjects, previous studies showed the relationship between the total score of the autism-spectrum quotient (AQ) [33] and the functional connectivity between mPFC and temporal regions using with resting-state functional MRI [13], and between autistic spectrum screening questionnaire (ASSQ) [34] and the network degree of PCC calculated by diffusion tensor imaging [12]. These points might suggest that DMN is associated with autistic spectrum trait.
GAT also showed the functional network differences in the temporal pole, fusiform cortex, precentral gyrus, and insula between the subjects with high and low SRS-A scores. Empirically the region with higher degree shows a lower local clustering coefficient on average. Our results also showed the negative relationship between integration index and segregation index, such as in fusiform and precentral cortex, and insula, while there was no region showing adverse trend between the nodal betweenness and degree in this study. It is known that the temporal pole and parahippocampal regions are associated with the mentalizing and related tasks [35,36], and the fusiform region with facial recognition [37]. Previous studies detected the atypical motor functioning in ASD patients [38-41], and that the strength of connectivity within and between distinct functional subregions of the precentral gyrus was related to ASD diagnosis and to the severity of ASD traits. These points were congruent with our results. We found the functional network differences in the insula between the subjects with high and low SRS-A scores. It is known that the insula modulate the DMN and executive control network [42-46], then the functional network differences of insula would be related to the autistic spectrum trait.
As for the subscale analysis of SRS-A, we found the CBF change along with the social awareness in the PCC, and social cognition in PCC and mPFC. [15O]H2 PET activation studies focusing on the story comprehension task necessitating the attribution of mental states showed the significant change of the regional CBF in mPFC [47], and changes of the CBF in PCC in healthy subjects [48], and these results were congruent with our findings. Past studies showed the relationship between the brain function of ACC and cognitive flexibility [49,50], and between the brain function of ACC and stereotyped thinking in healthy subjects [51]. The increasing activity of anterior cingulate cortex in subjects with higher autistic spectrum traits found in this study may be interpreted as a compensatory effort to overcome the apparent difficulties in attending to, selecting, and processing the emotionally significant experiences.
There was a limitation in this study. We sampled only male healthy subjects.
Previous study showed the prevalence of ASD is higher in men than that of women [52], and that men generated higher scores of SRS-A than women in the normative samples [7], then we evaluated the relationship with the male CBF. Further study with female subjects would bring the new findings about the sex-difference of the autistic spectrum trait and the brain function.
In conclusion, we found the significant correlations between the total score of autistic spectrum trait scale and the regional CBF in PCC, and the social awareness, cognition, and autistic mannerism were related to the mPFC, PCC and ACC, respectively. Further, we found the difference of functional networks between the healthy male subjects with high or low autistic spectrum trait. These findings in healthy subjects were the same as those in ASD patients, and these points suggest that autistic spectrum trait are postulated to lie on a continuum that extends between individuals with autism and individuals with healthy subjects.
Acknowledgements
This study was supported by the Intramural Research Grant (21-9, 23-25, 24-11) for Neurological and Psychiatric Disorders of the National Center of Neurology and Psychiatry (KH). The funders had no role in study design, data collection and analysis, decision to publish, or preparation of the manuscript. All authors declare that they have no conflicts of interest.