INTRODUCTION
The Block Design Test (BDT) is a subtest of the Wechsler Adult Intelligence Scale-IV (WAIS-IV) and is a widely used prominent neuropsychological measure in assessing visual spatial ability, constructional praxis, motor skill, and problem-solving skill ability [1-4]. The BDT is considered the most sensitive of the WAIS-R subtests to observe central nervous system dysfunction [1,5] and is used particularly for evaluating changes in cognitive status between being cognitively healthy, with Mild Cognitive Impairment (MCI), or in dementia [6]. The performance is a timed measure for visuospatial constructional ability. The BDT requires performer to arrange a set of four or nine blocks with different colored sides to duplicate a maximum of fourteen patterns presented in ascending order of difficulty with time limitation. Korean version of BDT WAIS-IV was used, which contains the same stimuli and follows the same procedures as original WAIS-IV version.
The normative data for the BDT was obtained from Caucasian residing in the United State who are between 16 to 74 years old [1], with educational attainment ranging from 7 years to college or more. The BDT has been known to be highly related to the demographic factors; age, education, gender, race, occupation and cultural background [3,6-15]. Previous BDT normative data did not report gender differences [6,8,10,12,15,16]. Yet, there are consistent findings on gender effects on visuospatial neuropsychological testing, generally reporting better performance by men [17-19]. Gender effects on the BDT were also reported consistently, showing men outperforming women [7,17,20-22]. Despite consistent reports of the effects of gender on visuospatial test performance, previous BDT normative data do not incorporate gender effects.
Consideration and incorporation of gender difference when developing normative data is particularly important for the Korean adults because of different educational and/or occupational opportunities depending on gender for the aging population in South Korea. Therefore, consideration of gender effect is necessary in addition to the effects of education. Inappropriate application of normative data that dismiss the cultural factors may pose a major challenge to clinical research and clinicians. Taken together, we aim to report on the joint effects of age, education and gender demographic variable on BDT performance in non-demented aging population and to provide normative data.
METHODS
Study population
This study included 432 non-demented Korean between 55-90 years old. Research participants were recruited from an ongoing prospective cohort study, Korean Brain Aging Study for Early diagnosis and prediction of AlzheimerŌĆÖs Disease (KBASE). All participants underwent comprehensive clinical and neuropsychological evaluations. Psychiatrists with advanced training in neuropsychiatry and dementia research; individually examined all participates using the clinical assessment batter in the Korean Version of the Consortium to Establish Registry for AlzheimerŌĆÖs Disease (CERAD) [23]. The battery consists of a standardized clinical interview on demographic information, cognitive and functional status, drug inventory, depression and medical history, a cognitive state examination and a general physical and neurological examination. Reliable informants were also interviewed to acquire accurate information regarding the cognitive and functional changes and medical history of participants [24].
Older adults with normal cognition (NC) or mild cognitive impairments (MCI) were analyzed. The inclusion criteria for NC were: 1) age 55-90 years (inclusive), 2) CDR score of 0, and 3) no diagnosis of MCI or dementia. Secondly, individuals who met the following inclusion criteria based on core clinical criteria for diagnosis of MCI according to the recommendations of the NIA-AA guidelines were included: 1) age 55-90 years (inclusive), 2) memory complaint corroborated by self, an informant, or clinician, 3) objective memory impairment for age, education, and gender, 4) largely intact functional activities, and 5) not demented.
Participants with dementia and other serious medical psychiatric and neurological disorders that could affect mental function were excluded from the analysis. A diagnosis of dementia was made according to the criteria of the fourth edition of the Diagnostic and Statistical Manual of Mental Disorders (DSM-IV) American Psychiatric [25]. Participants who successfully completed whole neuropsychological tests are included in the current study. This study was ethically approved by Seoul National University/Seoul National University Hospital Intuitional Review Board (IRB No. H-2006-101-1132).
Measurement
WAIS-IV-K Block Design Test
The BDT used in this stud is from Korean Wechsler Adult Intelligence Scale, 4th Edition (WAIS-IV-K) [26]. It involves subjects to reconstruct the two-dimensional designs using either four or nine, red and white colored blocks. Each trial is timed, and bonus points are given for faster completion. Scores on the BDT range from 0 to 48, with bonus points up to 66. The higher score reflects better visuospatial functioning. In this study, BDT performance was scored in the standard manner; we used the bonus timed score of the test for the performance analysis.
Statistical analysis
Statistical analyses were conducted with SPSS (version 24.0; Statistical Package for the Social Sciences for Window; IBM Corp, Armonk, NY, USA). A stepwise multiple linear regression analysis was performed to assess the influence of age, educational years and gender on BDT score. Age and educational years were entered as continuous variables and gender was coded as 1 or 0 for man or women. A series of 2├Ś5├Ś2 analyses of variance (ANOVA) were also performed to determine the main effect of age (55-74 and 75-90 years), education (0-3, 4-6, 7-9, 10-12, and Ōēż13), and gender (women versus men) on the test performance. Post hoc contrasts with TukeyŌĆÖs method were conducted when the main effects were significant at the p<0.05 level.
RESULTS
Demographic characteristic
The demographic characteristics of participant who completed the BDT are presented in Table 1. The mean age of the participants was 70.8 years (SD=8.0) and ranged from 55 to 90 years. 56% were composed of women. The average score of the men on the BDT was 29.9 (SD=10.3) and the women average score was 26.1 (SD=8.7). There was a significant difference between men (M=13.1, SD=4.17) and women (M=9.7, SD=4.67) in educational years [F(1,430)=61.4, p<0.001] and BDT score [F(1,430)=17.02, p<0.001].
Effect of age, education, and gender on BDT score
Stepwise regression analysis showed age, education and gender showed significant main effects by each variable on BDT score. Age [F(1,431)=67.36, p<0.001], education [F(1,431)=79.28, p<0.001] and gender [F(1,431)=17.03, p<0.001] were found to independently have significant effects on BDT scores. There was significant interactions between gender and education [F(1,431)=61.37, p<0.001] and between age and education [F(1,431)=10.75, p<0.001] were found to have significant effects on BDT scores. Age and gender interaction effect was not significant [F(1,431)=17.54, p=0.602].
Among the variables, education explained the largest variance of BDT performance (Table 2). To see the education effect of the sub groups (ie, 0-3, 4-6, 7-9, 10-12, and Ōēż13 years) were compared using post hoc contrasts. There were no significant differences between 0-3 with 4-6, and 7-9 with 10-12 years group. Therefore, groups were divided into three groups (0-6, 7-12, and Ōēż13 years). Similar to the previous studies, age also significantly affected BDT performance [13,14]; as age increased the performance of BDT declined significantly. Also, ANOVA was performed [F(1,430)=20.9, p<0.001] to identity the differences between age groups.
Normative date of the BDT
Stepwise multiple linear regression analyses revealed that, age, education years, and gender significantly predicted BDT scores. Tables 3 and 4 shows the normative data of each age group according to the level of education and gender. Given that BDT performance is influenced by age, educational levels and gender, participants were divided into five age overlapping stratification groups for the normative data. The over overlapping strata was used to maximize the clinical usefulness of normative test data [27]. Tables composed of overlapping age strata with midpoint ages occurring at 5-year intervals (ie, 67, 72, 77, and 82 years of age, respectively for four strata) were developed as shown in Tables 3 and 4. In each table, the user should select the age strata with a midpoint closest to the subjectŌĆÖs age to interpret BDT performance. As a result, normative data from ages 55-64, 60-74, 65-79, 70-84 and 75-90 years were used for persons whose ages ranged from 55-64, 70-74, 75-79, 80-90 years, respectively. Each of these ranges was derived to encompass all ages closer to one midpoint age than to the other adjacent midpoints. Educational groups were divided into three strata (ie, 0-6, 7-12, and Ōēż13 years of education).
DISCUSSION
The present study was conducted to examine the effect of demographic factors on the performance on the BDT and to provide normative data for middle to older aged adults in an educationally diverse population with consideration of the effects of gender, which is anticipated to better assist clinicians and researchers when making interpretation of the test performance [17,20,22,28]. The result showed age, education, and gender were independently associated with BDT performance.
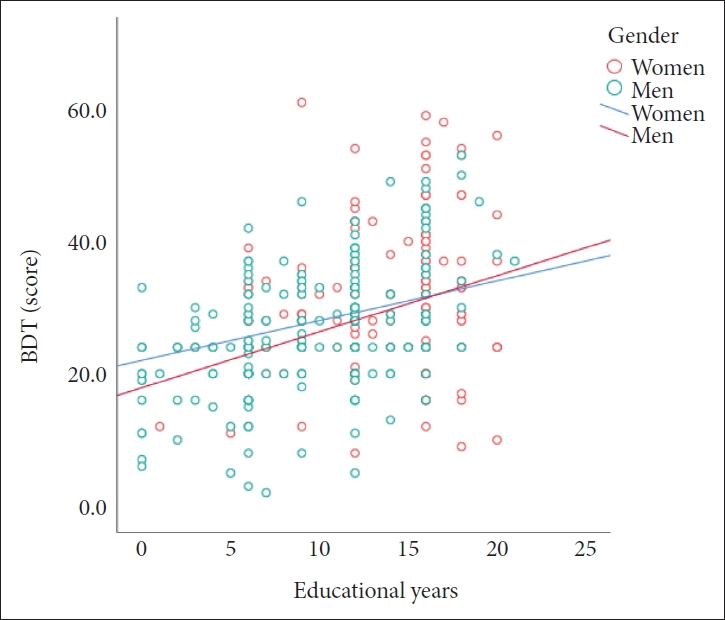
In the present study, BDT performance declined with age, which is consistent with previous findings [6,7,14]. The results of age-related decline in BDT indicate that visuospatial ability declines with normal aging. Educational years were associated with better performance on the BDT and lower educational years were associated with poorer performance. Our finding is consistent with other normative studies that showed a significant association between education and BDT performance [7-10,12,13]. Moreover, men performed better than women on visuospatial tests independent of years of education. There was also significant interaction effects of gender and education on BDT (Figure 1).
The findings on age and education are consistent with those reported in other normative studies. The contribution of gender to the BDT performance found in our study, however, was unique from that of previous studies [6,8,12], given that the previous normative studies on BDT either reported non-significant gender effects or chose to not consider the effects of gender due to sample size. Korean older adults have significantly different educational attainment by gender, which is reflected in the results. This may be above and beyond the implicated underlying biological differences of gender. It has been speculated that the differences in neuropsychological performance between genders, especially in the old population, may be due to the reduced education, employment, and social engagement in women in less developed countries in the past. The present study supports the earlier studies of men having higher performance in visuospatial ability tests [3,15,20,22,29]. Notably, higher educational attainment of men might be related with intellectual activates during a lifetime, leading to the protection of aging individuals against cognitive decline possibly through increased intellectual activities as well as better economic resources to protect against dementia [6,14,30].
Gender effects shown in the current study compared to previous reports may appear to be amplified for AsiansŌĆöparticularly South Koreans. Previous studies suggested influence of not only gender and socio-economic factors but also ethnicity on educational attainment [30,31]. In other words, understanding of the effects of education on cognitive function of elderly living in South Korea cannot be separate from the effects of gender. Furthermore, the difference in the educational attainment levels leads to discrepant future employment prospects and access to opportunities. Such gender-based disparities are notable and reflected in this normative study. Many older women in South Korea were required to tend to household duties from a very young age to older adulthood and were often not supported to attend schools. It was considered that womenŌĆÖs role in life was to support men and their children. Men, on the other hand, had more opportunities to work outside, to have social roles, and be more independent [32]. Even with less or unschooling, men had greater opportunities working outside the home environment and interacting with others as a primary income earner of the family, which enabled men but not women to strengthen cognitive or literacy skills. Consequently, less educated men were able to educate themselves through exposure to diverse or stimulating environment, which was not the case for women. The effect of such disparity disappears in the age cohorts where women received equal or similar education as men, such as shown in the current normative data. The cultural or ethnic differences can be observed by the similar social experiences when the gender effect is lessened to a significant degree [8,33]. These previous studies were mostly made up of the Caucasian population. Although women may serve a similar social-economic role in society, their educational attainments were higher, leading to results have less significant differences between men and women [33].
There is a limitation that should be acknowledged. The participants who are young (between 55-64 years of age) and less educated (between 0-6 years of education) are limited in size, which is due to changes in societal and educational system in South Korea in recent decades. If possible, future studies including middle-aged adult participants with various educational levels may be helpful.
In conclusion, taking together the findings from the analyses, we developed the normative data to adjust for age, gender, education factors for BDT. By adopting the overlapping age stratification method proposed by Pauker [27], we were able to present more diverse and stable normative data of older adults with a sufficient number of participants in each normative block. This study provides demographically well-adjusted normative data for BDT score for a large diverse and rapidly growing population. Because earlier normative data for BDT were mostly based on a well-educated population, this study provides normative data for the educationally diverse sample and, therefore, offers more accurate information that will be more helpful in determining the severity of cognitive decline due to aging.