 |
 |
- Search
| Psychiatry Investig > Volume 20(1); 2023 > Article |
|
Abstract
Objective
Methods
Results
Conclusion
Notes
Availability of Data and Material
The raw data supporting the conclusions of this article will be made available by the authors, without undue reservation.
Conflicts of Interest
The authors have no potential conflicts of interest to disclose.
Author Contributions
Conceptualization: Jaeun Ahn. Data Curation: Manjae Kwon, Deokjong Lee, Jaeun Ahn. Formal analysis: Manjae Kwon. Investigation: all authors. Methodology: Young-Chul Jung, Jaeun Ahn. Project administration: Jaeun Ahn. Resources: Young-Chul Jung. Software: Young-Chul Jung. Supervision: Young-Chul Jung, Deokjong Lee. Validation: Young-Chul Jung, Deokjong Lee, Jaeun Ahn. Visualization: Manjae Kwon. Writing—original draft: Manjae Kwon. Writing—review & editing: Young-Chul Jung, Deokjong Lee, Jaeun Ahn.
Funding Statement
None
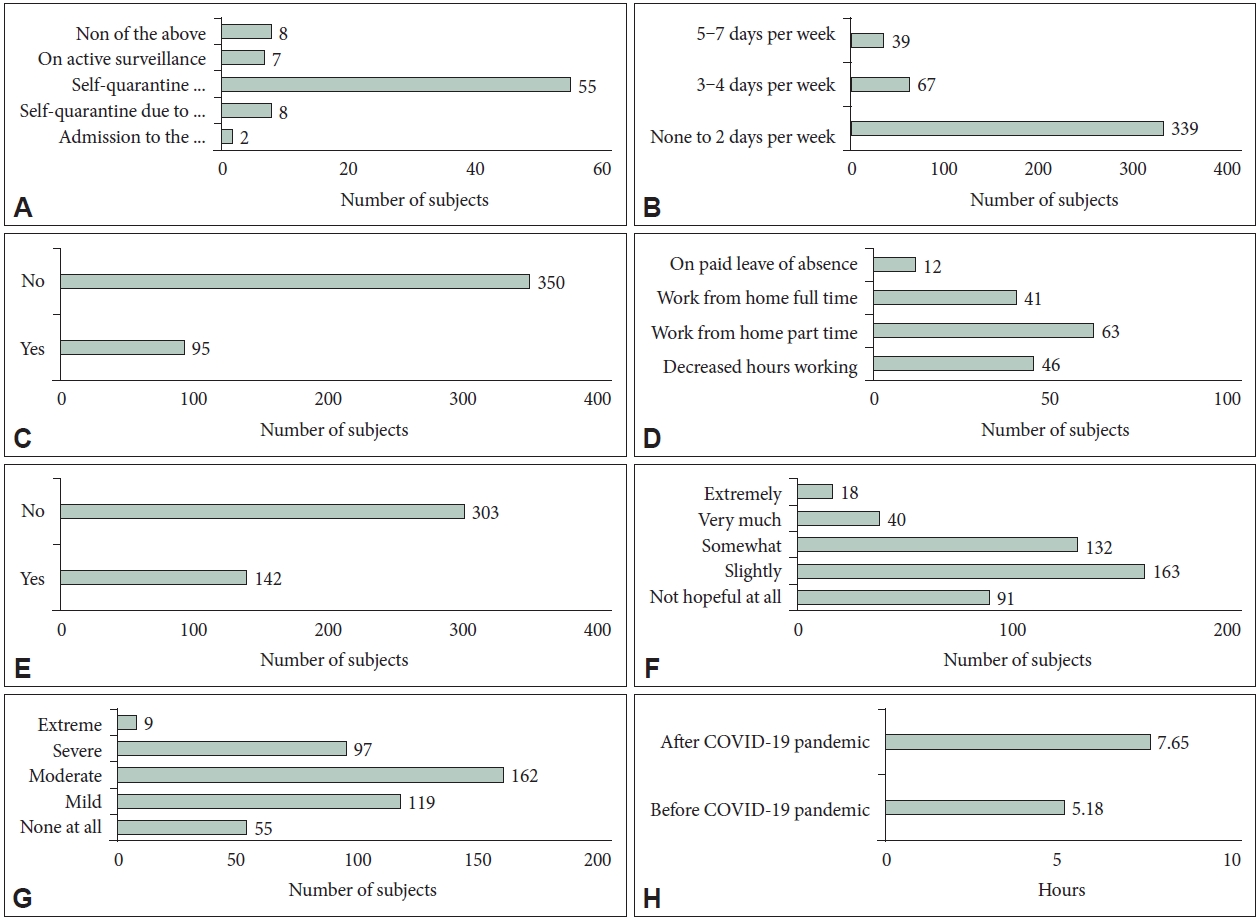
Figure 1.

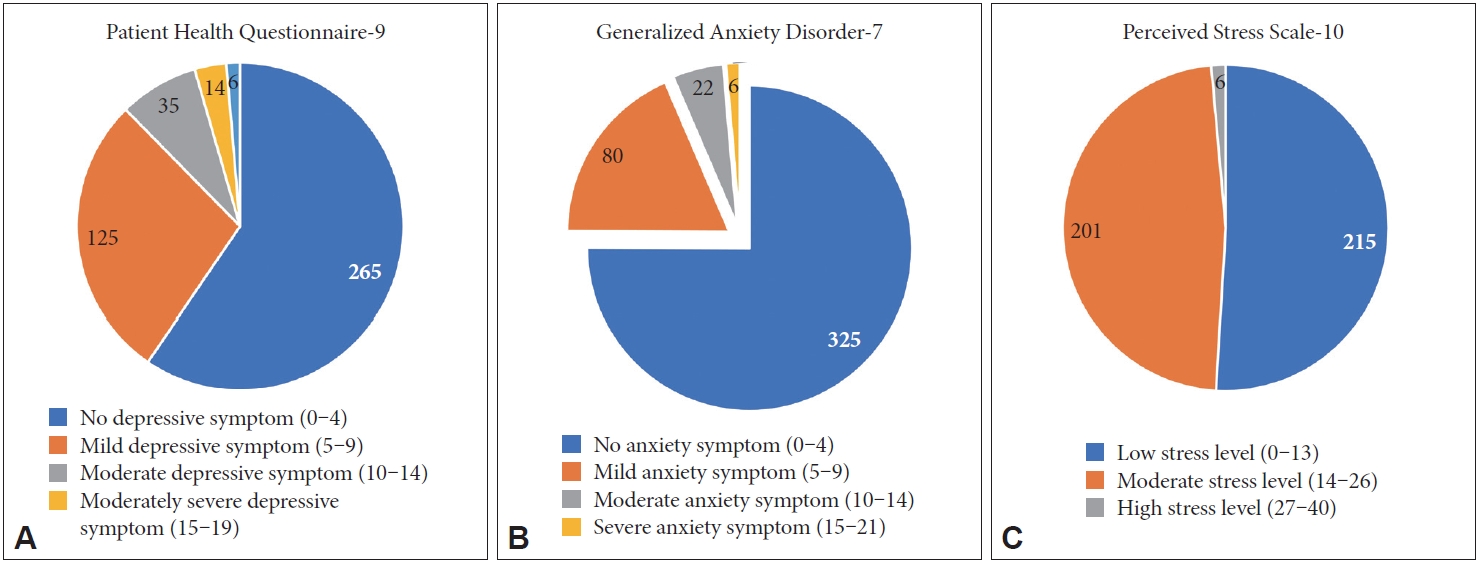
Figure 2.

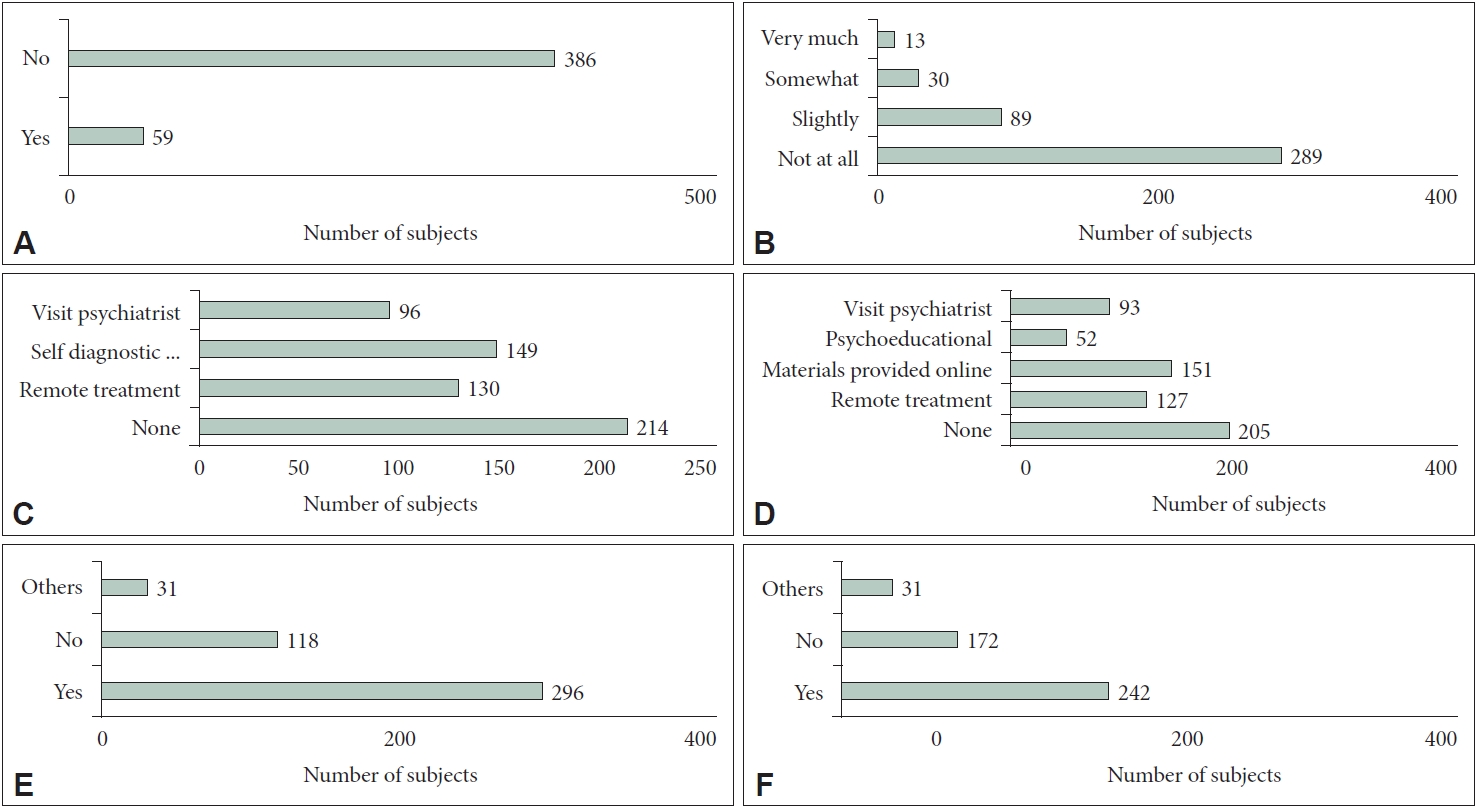
Figure 3.

Table 1.
Data are presented as or N (%). PSQI, Pittsburgh Sleep Quality Index; DSM-5, Diagnostic and Statistical Manual of Mental Illness-5; GAD, Generalized Anxiety Disorder; MDD, Major Depressive Disorder; PHQ-9, Patient Health Questionnaire-9; GAD-7, Generalized Anxiety Disorder-7; PSS-10, Perceived Stress Scale-10
Table 2.
| Variable [reference category] |
MDD (PHQ-9 ≥10) |
GAD (GAD-7 ≥10) |
Significant stress (PSS-10 ≥14) |
Insomnia (PSQI ≥ 5) |
|||||||||
|---|---|---|---|---|---|---|---|---|---|---|---|---|---|
| OR | 95% CI | p | OR | 95% CI | p | OR | 95% CI | p | OR | 95% CI | p | ||
| Age [30-39 years] | |||||||||||||
| 20-29 years | 3.05 | 1.21-7.72 | 0.019* | 6.11 | 1.68-22.31 | 0.006** | 0.79 | 0.47-1.34 | 0.39 | 1.40 | 0.79-2.50 | 0.25 | |
| 40-50 years | 1.71 | 0.51-5.70 | 0.38 | 0.85 | 0.09-8.30 | 0.89 | 0.73 | 0.38-1.43 | 0.37 | 1.46 | 0.68-3.11 | 0.33 | |
| Female [no] | |||||||||||||
| Yes | 2.61 | 1.25-5.48 | 0.011* | 3.12 | 1.12-8.74 | 0.03* | 2.18 | 1.40-3.38 | <0.001*** | 1.10 | 0.68-1.79 | 0.70 | |
| Residence [non-capital region] | |||||||||||||
| Capital region | 1.51 | 0.66-3.49 | 0.33 | 2.73 | 0.85-8.81 | 0.09 | 1.26 | 0.76-2.10 | 0.38 | 1.41 | 0.81-2.45 | 0.23 | |
| Comorbidity | |||||||||||||
| Currently being treated for medical or surgical disease | 2.32 | 1.09-4.92 | 0.03* | 4.22 | 1.54-11.54 | 0.005** | 1.37 | 0.84-2.25 | 0.21 | 1.57 | 0.89-2.77 | 0.123 | |
| Average daily hours spent self-isolating | 0.98 | 0.94-1.03 | 0.40 | 1.01 | 0.97-1.06 | 0.56 | 1.00 | 0.98-1.03 | 0.81 | 0.97 | 0.94-1.00 | 0.06 | |
| Change in the amount of time spent on mobile device or computer after COVID-19 pandemic | 1.14 | 1.00-1.29 | 0.04* | 1.07 | 0.90-1.26 | 0.45 | 1.03 | 0.95-1.12 | 0.49 | 1.125 | 1.02-1.25 | 0.025* | |
| Decrease in the household income due to COVID-19 | 2.18 | 1.04-4.60 | 0.04* | 1.47 | 0.51-4.17 | 0.48 | 1.11 | 0.69-1.79 | 0.67 | 1.08 | 0.64-1.83 | 0.78 | |
| Change in work environment due to COVID-19 [No change] | |||||||||||||
| Decreased hours or days working | 0.69 | 0.23-2.10 | 0.51 | 1.54 | 0.41-5.80 | 0.52 | 1.33 | 0.64-2.76 | 0.45 | 1.04 | 0.46-2.35 | 0.92 | |
| Work from home part time | 1.62 | 0.67-3.93 | 0.28 | 0.25 | 0.03-1.97 | 0.19 | 1.52 | 0.83-2.80 | 0.17 | 1.09 | 0.56-2.14 | 0.80 | |
| Work from home full time | 0.47 | 0.12-1.80 | 0.27 | 0.27 | 0.03-2.38 | 0.24 | 0.98 | 0.46-2.11 | 0.97 | 0.88 | 0.37-2.06 | 0.76 | |
| On paid leave | 5.24 | 1.23-22.29 | 0.03* | 2.82 | 0.27-29.15 | 0.38 | 2.95 | 0.57-15.24 | 0.20 | 0.61 | 0.14-2.57 | 0.50 | |
REFERENCES


