INTRODUCTION
Delirium is a psychiatric disorder with disturbances in memory, learning, orientation, language, and perception, and is caused by medical conditions, drugs, and substance abuse, showing one or more symptoms among defective memory and learning, disorientation, language issues, and perceptual distortion [1]. In particular, it worsens at night with the accompanying decrease in external directional stimuli [1]. Though the pathophysiology of delirium is not well understood, the overall reduction of oxidative metabolic processes in the brain, enzymatic system, blood-brain barrier, cell membrane damage, acetylcholine synthesis, and consequent deficiency in choline, dopamine, and gamma-aminobutyric have been suggested as contributing factors. Acute brain failure is reportedly caused by a series of processes, such as an imbalance in neurotransmitters (gamma-aminobutyric acid, glutamate, serotonin, and norepinephrine), cortisol elevation due to acute stress response, and cytokine changes [2].
An estimated 70% of patients hospitalized for physical illness have delirium, and approximately 30% of elderly patients experience delirium during hospitalization [3,4]. The incidence of delirium increases with age and disease severity of the patients. Specifically, the risk of delirium was found to increase after surgical treatment in elderly patients and is closely related to complex surgical procedures, such as hip fracture and heart surgery [5-7]. Although delirium is reversible, in many cases, cognitive impairment persists, with an associated increase in medical costs and length of hospital stay [8-10]. Therefore, it is necessary to diagnose delirium at the earliest and intervene actively. Currently, delirium is screened based on history and physical examination performed by caregivers and medical staff; it solely depends on the skill and experience of the medical staff. As a result, only 28% of delirium patients admitted to the intensive care unit (ICU) were diagnosed by doctors and 34.8% by nurses; approximately 40% of patients who were believed to have depression and were referred by their physician to the Department of Psychiatry were diagnosed as having delirium [6,11]. To overcome this issue, scales, such as Confusion Assessment Method (CAM) and CAM-ICU, are used to diagnose delirium in clinical practice. However, a meta-analysis showed the sensitivity of CAM and CAM-ICU to be 82% and 81%, respectively; depending on the research environment and clinical situation, sensitivity decreased to 42.9% and 46.7%, respectively. Since these scales are used by clinicians, their accuracy inevitably varies according to factors, such as the aforementioned skill and experience [12-15]. As the diagnostic process is closely related to the clinical skill and experience of the medical staff, currently, it is difficult to intervene with just a preliminary diagnosis.
Recently, the US has focused on overcoming the drawbacks of individual approaches by developing objective disease markers, or biomarkers, in precision medical planning [16]. However, to date, no biomarker has been used to diagnose delirium, and a standardized approach has not been established [17,18]. Brain imaging techniques, such as computed tomography and magnetic resonance imaging, have limited use as biomarkers. Although a single nucleotide polymorphism of 16 genes has been detected, diagnosis involving genetic testing is still in its preliminary stage [19-23].
Meanwhile, electroencephalography (EEG) is one of the most promising tools as a diagnostic biomarker that can help to increase the diagnostic accuracy in delirium [24]. EEG provides data to support delirium diagnosis even when it is difficult to interview the patient due to symptoms, such as decreased attention span and decreased arousal [25]. A prospective cohort study among delirium patients by Kimchi et al. [26] demonstrated the usefulness of EEG delirium diagnosis and severity assessment. On performing EEG on 121 patients, those in the target group showed generalized theta or delta slowing. The degree of slowing was also correlated with the severity of the CAM scale. Recently, quantitative EEG (qEEG) has been in the spotlight as a useful tool for diagnosing delirium [24]. In qEEG, digitally measured EEG is processed using a computer and then converted into amounts of specific frequencies, resulting in power spectrum values across multiple bands [27-29]. In a recent qEEG study of 28 patients with delirium by van der Kooi et al. [24], the change in delta power of F8-Pz demonstrated superiority with sensitivity and specificity of 100% and 96%, respectively. To search for more objective indicators for diagnosing delirium, they investigated whether qEEG had diagnostic usefulness in delirium and the relationship between qEEG and the severity of delirium. The aforementioned studies were designed to compare a well-controlled group with a delirium group. However, in real-world situations, it is difficult to obtain a well-controlled group. As mentioned earlier, 40% of those who were referred to the Department of Psychiatry for depression had delirium; similarly, in real-world settings, patients with delirium have to be screened in a heterogeneous group [11]. We hypothesized that the present study would be more useful for diagnosing delirium and evaluating its severity than previous studies if the delirium and control groups were set up and compared using qEEG data collected from various patients in real-world clinical situations. Therefore, we conducted this study to explore whether qEEG had diagnostic usefulness in exploring the objective indicators of delirium in a heterogeneous group by reflecting on a real-world situation; further, the relationship between qEEG and the severity of delirium was also investigated.
METHODS
Data and participants
This study analyzed the characteristics of qEEG in patients with delirium. Sixty-nine participants were selected from patients who were referred to the Department of Psychiatry, Catholic University of Korea, Daegu, between January 01, 2018 and April 25, 2021, and a retrospective study was conducted using their medical records. Individuals referred to the Department of Psychiatry due to suspected delirium were included in the delirium group, and those who were referred due to other psychiatric disorders were included in the non-delirium group. The inclusion criteria for the delirium group were age Ōēź19 years and available records of EEG, clinical global impression-severity (CGI-S) rating scale, and delirium rating scale-revised-98 (DRS-R-98) rating scale. The groups were matched according to sex and age. Exclusion criteria for both groups included any history of neurological disorders, such as epilepsy, dementia or intracranial surgery, insertion of magnetic material into the head or eyeball, difficulty in communication (e.g., coma, intubation), or EEG data judged to be inappropriate for use in the study. In addition, drug history was evaluated before qEEG imaging, and only drug-naive subjects were included in the non-delirium control group. This study was approved by the Institutional Review Board of the Catholic University of Korea, Daegu (approval no: CR-21-090). The need for informed consent was waived due to the retrospective nature of the study.
Study design
From among the total number of participants, 30 patients diagnosed with delirium using the Diagnostic and Statistical Manual of Mental Disorders fifth edition (DSM-5) diagnostic criteria by a psychiatric specialist were classified as the delirium group, and 39 patients who were not diagnosed with delirium were classified as the non-delirium control group. Electronic medical records of all patients were analyzed, and data on sex, age, and delirium status were collected. In the delirium group, we analyzed the records of tests performed, such as the DRS-R-98 scale used to evaluate the symptoms and severity of delirium and the CGI-S. Finally, EEG data were retrieved and analyzed. This study followed the EQUATOR reporting guidelines for this type of study (RECORD-checklist).
Measures
CGI-S
The CGI-S is a widely used simple assessment tool in psychiatry. It is a clinician-administered scale and focuses on three aspects: the severity of disease, the pattern of improvement or change, and the evaluation of treatment responsiveness. It is a measure to evaluate the overall disease state, and clinicians can easily and quickly assess the patient and reflect it in treatment. In the present study, CGI-S was used to evaluate the severity of the disease [30].
DRS-R-98
The DRS-R-98 scale consists of 16 items, including three diagnostic items for initial evaluation and 13 severity items for evaluating severity concerning the differential diagnosis. Diagnostic items assess the time course of symptom onset, symptom variability, and the presence of physical diseases affecting symptoms. The severity items evaluate perceptual disturbance, delusion, affective variability, thought process, thought content, language, psychomotor delay or agitation, orientation, memory, attention, short-term or long-term memory, spatiotemporal ability, and degree of perceptual impairment. Severity items were scored 0-3 points, and diagnostic items were scored 0-3 or 0-2, with a total score of a maximum of 39 and 46 points, respectively [31]. The CronbachŌĆÖs alpha coefficient was 0.90 for the total scale and 0.87 for the severity scale [31]. In this study, a Korean-translated version of the scale (DRS-R-98-K) was used; CronbachŌĆÖs alpha coefficient was 0.91 for the total scale and 0.89 for the severity scale [32].
qEEG
EEG recording and pre processing
The EEG was performed with 19 channels of the international 10-20 system (Fp1, Fp2, F7, F3, Fz, F4, F8, T7, C3, Cz, C4, T8, P7, P3, Pz, P4, P8, O1, and O2), using a 64-channel Comet digital EEG (Grass; Natus neurology, Middleton, WI, USA), with a recording frequency of 800 Hz with reference to the ear electrode. The progress of the qEEG was measured for 5 minutes with the eyes open while sitting in a comfortable chair and immediately after that for 5 minutes with the eyes closed. The patient was instructed to focus on the ŌĆ£+ŌĆØ sign in front in the eyes-open condition, avoid movement, remain silent, and not fall asleep when the eyes were closed.
Method of EEG analysis
For the analysis of EEG, MATLAB 7.0.1 (MathWorks, Natick, MA, USA) and EEGLAB toolbox (https://sccn.ucsd.edu/eeglab/download.php) were used. First, down-sampling of EEG data to 250 Hz, detrending, and mean-subtracting were performed to remove the direct current component. Subsequently, frequencies less than 1 Hz and 60 Hz affected by eye movements and electrical noise were removed through the filter, and artifacts caused by blinking, muscle movement, and heart noise were removed through independent component analysis. Power spectrum analysis was performed on the EEG data for at least 2 minutes without artifacts. Finally, we performed EEG analysis using the fast Fourier transforms algorithm for each frequency band for each selected epoch: delta wave (1-4 Hz), theta wave (4-8 Hz), alpha wave (8-12 Hz), beta wave (12-30 Hz), gamma wave (>30 Hz). All EEG results were reconfirmed by psychiatric clinicians and EEG experts for error and noise.
Statistical analysis
The Žć2 test was used to analyze the categorical sociodemographic variables between the two groups (delirium and non-delirium control groups), and the StudentŌĆÖs t-test was used to compare continuous variables. For analyzing EEG data in the eyes-closed condition, frontal (FP1, F3, F7, Fz, FP2, F4, and F8), central (T3, C3, Cz, T4, and C4), and posterior (T5, P3, O1, Pz, T6, P4, and O2) channels were classified into three regions, and then the differences between groups were analyzed using the StudentŌĆÖs t-test [33]. The diagnostic performance and accuracy of qEEG were analyzed using the receiver operating characteristic (ROC) curve for the sub-groups that showed a significant difference between the groups in the EEG analysis; the effectiveness of qEEG was evaluated by analyzing the sensitivity and specificity between the two groups. Accuracy was measured in the lower area under the curve (AUC) of the ROC curve; the AUC value is considered an excellent tool for diagnostic accuracy evaluation when the ROC curve is close to 1 [34]. Finally, PearsonŌĆÖs correlation analysis was performed to examine the correlation between the severity of delirium and EEG data in the delirium group. Bonferroni correction was performed to control false positives in multiple comparisons, and statistical significance was set at p<0.017 (0.05/3). All analyzes were performed using the statistical program SPSS Version 25.0 for Windows (IBM Corp., Armonk, NY, USA).
RESULTS
Demographic and clinical characteristics
There were 30 participants in the delirium group and 39 in the control group. The diseases in the control group included depressive disorders (n=16), anxiety-related disorders (n=11), sleep-related disorders (n=6), somatic symptoms and related disorders (n=4), and trauma and stress-related disorders (n=2). There were no statistically significant differences in age (p=0.066) and sex (p=0.387) between the delirium and the control groups. In addition, in the inclusion criteria of this study, the minimum age was 19 years, but the actual age of the included participants was Ōēź49 years; therefore, there was no statistical error due to the young age (Table 1 and Figure 1).
Comparison of scores on clinical scales between delirium and control groups
The CGI-S (p<0.001) scores showed a significant difference between the two groups, and the overall clinical severity was higher in the delirium group (mean 5.30, standard deviation [SD] ┬▒0.70) than in the control group (mean 2.92, SD ┬▒0.74). The DRS-R-98 was administered only when delirium was clinically suspected; therefore, between-group analysis with the control group was not possible. The mean score on the severity scale of the DRS-R-98 in the delirium group was 20.90 points (SD ┬▒9.92), and the mean total score in DRS-R-98 was 26.73 points (SD ┬▒11.02) (Table 1).
Comparison of qEEG between the delirium and control groups
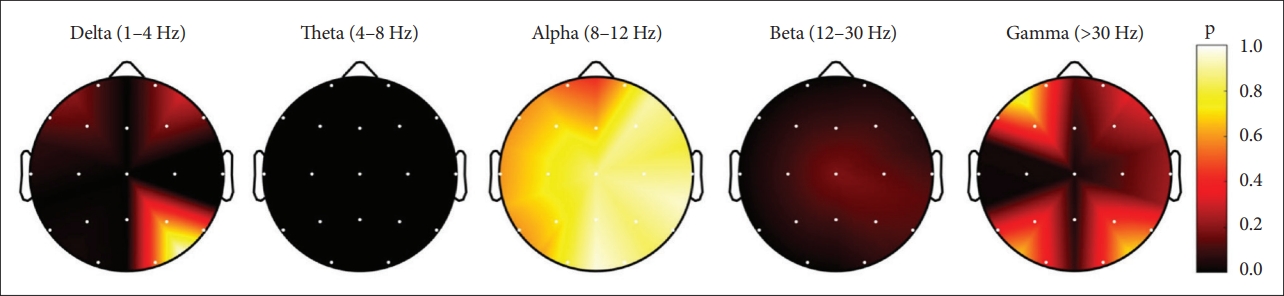
On comparing the average absolute power for the frontal, central, and posterior regions, a significant difference was found in delta and theta frequencies in all regions, and the absolute power was increased in the delirium group than in the control group. In contrast, beta power was decreased in all areas, especially the greatest decrease was observed in the posterior region. There was no significant difference in the alpha and gamma frequencies (Table 2).
Sensitivity and specificity of qEEG data using ROC curves
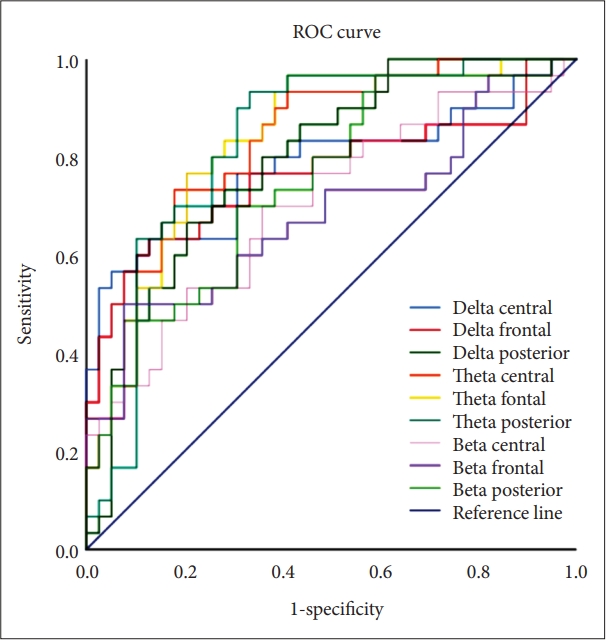
When the cut-off was set to 1.0 SD on dividing according to frontal, central, and posterior regions, the theta power of the frontal region showed the highest AUC (0.84) value, and the sensitivity and specificity were 77% and 79%, respectively. Additionally, the theta power in the central and posterior regions also showed an AUC of Ōēź0.8. In particular, the sensitivity of the theta power was highest in the posterior region (90%), while the delta power in the central region had the highest specificity (95%) (Figure 2).
Correlation of delirium severity with qEEG
PearsonŌĆÖs correlation analysis was performed on the EEG data of the delirium group and the scores on the DRS-R-98 scale. At p<0.017 (0.05/3), defined by Bonferroni correction, the only significant correlation with delirium severity was the central beta power (R=-0.457, p=0.011) (Figure 3).
DISCUSSION
In this study, qEEG was found to have a high diagnostic value in identifying delirium among patients referred to the department of psychiatry. We recorded the patientŌĆÖs EEG in the eyes-closed resting state for 5 minutes and acquired the absolute power through power spectrum analysis. In the delirium group, it was confirmed that the absolute power increased in slow waves, such as theta and delta waves, while it decreased in the beta wave. Moreover, as a channel parameter of the regions, the theta wave in the frontal region showed the highest accuracy (sensitivity, 77%; specificity, 79%).
Many studies have compared differences in EEG characteristics between patients with delirium and normal controls. Generalized slowing of theta and delta waves [26,35], an increase in absolute power [24,36], and a decrease in functional connectivity in the frontal region [7] have been reported. Excessive slowing on EEG in delirium is a phenomenon occurring not only when the level of consciousness is lowered but also at a normal level of consciousness, in relation to poor cognitive function, poor progress, and prognosis [26,35]. Furthermore, in investigating the usefulness of EEG-based diagnosis of delirium, van der Kooi et al. [24] reported that the relative delta power had high accuracy, with an AUC of 0.99 in the F8-Pz channel. Fleischmann et al. [37] reported 100% sensitivity and 99% specificity by combining 2 Hz (delta wave region) of F3-P4 and 19 Hz (beta wave region) of C3-O1 based on a large-scale EEG database.
Among the patients with delirium referred to the department of psychiatry, we observed an increase in slow wave and a decrease in fast wave (beta wave), which is consistent with previous studies [35,38]. Theta and delta waves appear as slow waves across a large area of the brain and have oscillators in structures below the cortex [39], such as the brainstem [40], thalamus [41], and hippocampus [42]. This increase in slow wave increase is commonly seen with lowered consciousness or encephalopathy [43], known to cause hypoarousal of the brain, and is a frequent phenomenon in neurodegenerative diseases, such as AlzheimerŌĆÖs and ParkinsonŌĆÖs diseases [44]. In contrast, beta waves are classified as fast on EEG, with oscillators primarily in the cerebral cortex [45]. A decrease in beta waves may reflect hypoarousal of the cerebral cortex and is common in traumatic brain injury along with symptoms, such as cognitive decline and concentration loss [46]. Therefore, the results of this study suggest that the decrease in cerebral cortex activity in patients with delirium causes thalamocortical dysrhythmia [47], with an increase in slow waves, such as theta and delta waves.
Notably, the sensitivity and specificity of the absolute theta power in the frontal and occipital regions, which may be potent biological markers of delirium, were relatively low (frontal: sensitivity 77%, specificity 79%; posterior: sensitivity 90%, specificity 67%) in the present study than in previous studies. van der Kooi et al. [24] reported 100% sensitivity and 96% specificity using the relative delta power of the F8-Pz (frontal-parietal) electrode, and Fleischmann et al. [37] reported that the F3-C4 electrode had 100% sensitivity and 90.98% specificity using relative delta power. The present results may partially depend on the selection method and heterogeneity of the control group; previous studies were conducted using the data of patients without delirium from among patients diagnosed with the same disease or undergoing the same type of surgery, or the general population [24,37]. However, in the present study, patients diagnosed with disorders other than delirium by a psychiatrist were included in the control group. The patients enrolled had various medical conditions, including depressive disorder (41.0%), anxiety disorder (28.2%), sleep disorders (15.4%), somatic symptoms and related disorders (10.3%), and trauma and stress-related disorders (5.1%). In previous studies with heterogeneous control groups, sensitivity and specificity were slightly low. For example, Kimchi et al. [26] reported that the generalized slowing of EEG had a sensitivity of 83.5% and a specificity of 67.1% in patients with delirium having various internal and external disorders. However, this should be considered from a more realistic perspective; EEG data used in this study were obtained for clinical use in a real-world setting. In clinical settings, delirium has to be screened in significantly heterogeneous groups, not in well-controlled groups. Many of the patients referred to the department of psychiatry had delirium [6]. As such, it is very difficult to distinguish delirium in patients with co-existing psychiatric symptoms in a clinical setting. The significance of this study is that the method demonstrated can secure a fairly high level of accuracy with the assistance of qEEG.
Conversely, it was reported that the severity of delirium had a significant negative correlation with the absolute beta power of the central region. According to previous studies, the severity of delirium correlated with changes in EEG, which may be interpreted as decreased alpha power and increased theta power, and generalized slowing with increased delirium severity [26,48]. In this study, the beta power belonging to the fast wave decreased, indicating hypoarousal of the cerebral cortex, similar to the aforementioned studies wherein eventually aggravation in the severity of delirium occurred. Moreover, the alpha and theta power corresponding to the slow wave did not represent the severity, which is thought to be because it reflected the real-world situation, unlike previous studies.
This study has a few limitations. The first and greatest limitation is the retrospective study design of reviewing medical records. Therefore, in the control group, the evaluation of delirium diagnosis and severity, such as CAM and DRS-R-98, was not performed. In future studies, it is necessary to prospectively administer the measures of delirium in the control group as well, thereby making between-group comparisons possible. Second, the number of participants included in the study was 69, which was relatively small compared to that in previous studies. This, along with the heterogeneity of the sample, makes it difficult to generalize the results of the study; a prospective follow-up study with a larger sample is required in this regard. Finally, delirium was characterized as varying attention and consciousness levels over a day, and the increase in the absolute power of the theta and gamma waves was similar to that observed in a vegetative state or a minimally conscious state patient [49]. The patientŌĆÖs condition at the time of EEG measurement may be largely reflected in the study results. Therefore, it is expected that more characteristic and accurate results for delirium can be obtained if future studies are conducted by considering pattern changes in intraday EEG through repeated EEG imaging.
In conclusion, power spectrum analysis of qEEG using single-channel parameters had high accuracy in screening patients with delirium from among patients referred to the department of psychiatry and correlated with the severity of delirium. The diagnosis and differentiation of delirium require a lot of effort, skill, and training, and early screening and diagnosis are important for a better prognosis; therefore, this study is relevant in its suggestion that in the future, it may be possible to support the diagnosis of delirium using qEEG. Large-scale, well-controlled, prospective studies are required in the future.