INTRODUCTION
Depression is a common and severe mental disorder, which can cause a considerable degree of disability to the individual and society. The molecular mechanisms of depression are poorly understood even though many studies have been attempted. Moreover, there are currently no distinctive biological markers to aid in the diagnosis and treatment of depression. The diagnosis, evaluation of medication effects, and prediction of relapse are carried out completely by clinical judgments based on the phenomenology of the disease. To increase the accuracy and speed of diagnosis and develop individualized treatments, more objective and biological measurements of depression are required. The first step requires identifying the molecular pathway for depression. Genomic approaches have attempted to find the underlying molecular pathways, but have not successfully identified the major genes for depression. This may be because there are multiple genes working together or interacting with the environment in a very complex way. In spite of this complexity, several genomic studies have reported CAPRIN1, CLEC4A, KRT23, MLC1, PLSCR1, PROK2, ZBTB16, and S100A10 as potential biomarker candidates of major depressive disorder (MDD).1,2
Although this genomic information is useful, it does not account for the important environmental influences on illness onset, and the presence of a gene does not necessarily reflect functioning protein expression in vivo.3,4 Studies on proteins related to diagnosis as well as associated features of depression have identified many candidate proteins as biomarkers. Serum brain-derived neurotrophic factor (BDNF) would be the most studied protein.5,6 A recent meta-analyses on 179 association studies concluded that serum BDNF concentrations in antidepressant-free depressed patients were lower than the healthy controls and the antidepressant-treated depressed patients.7 Specific clinical feature of depression such as history of childhood trauma has found to be correlated with high platelet BDNF.8 Besides, many other molecules have been reported for the association with depression, for example, serum interleukin-18 and depression,9,10 serum FSH and suicidal ideation or attempt in MDD under 45 years.11 TSH level was found to be associated with serum BDNF level during antidepressant treatment in MDD.12 However, one or two protein biomarkers are insufficient to diagnose MDD because proteins usually function in several networks rather than alone. Therefore, it is necessary to identify a set of proteins as a biomarker, and proteomics is the most powerful tool to develop a novel biomarker set.13 Proteomics has diagnostic advantages over genomics because it can reflect post-translational events.14 A proteome is the total set of proteins expressed by a cell, tissue, or organism at a given time under a determined condition.15 This includes gene-gene and gene-environmental interactions, as well as post-translational modifications.16 Using proteomics may help de-termine disease-specific markers by identifying and assessing all of the proteins in a certain physiological condition.17
In the proteomic approach to depression, the appropriate tissue is brain tissue or cerebrospinal fluid (CSF). Studies of the postmortem brain, especially the frontal cortex and anterior cingulate cortex, found expressional changes in dihydropyrimidinase-related protein 2, carbonic anhydrase, and aldolase C. This finding suggests that brain development and energy metabolism may be associated with depression.18,19 A recent study on the dorsolateral prefrontal cortex also found associations between MDD, energy metabolism, and synaptic function.20 However, these studies had limitations, namely that the investigations were done only in a limited brain area. Further, postmor-tem brain tissue itself is associated with technical difficulties because of differences in postmortem interval times and other factors such as pH.21 CSF studies of depressive patients found differences in several fatty acids, glycerol, and gamma-aminobutyric acid.22,23 A recent study on the proteome of CSF from MDD patients found 11 differentially expressed proteins in depression. These proteins are associated with neuroprotection, neurodevelopment, and sleep regulation.24 In clinical situations, brain tissue cannot be obtained from living patients and CSF can only be obtained through invasive spinal tapping. Proteomic studies of the blood are realistic alternatives to brain tissue or CSF because blood can easily be obtained without serious risk. Protein exchange occurs between the brain and peripheral blood circulation via the blood-brain barrier (BBB) and CSF absorption into the blood. Therefore, a blood proteome would be a promising biomarker for depression as a central nervous system disorder. A recent work on plasma proteome analysis of first-onset drug-naive MDD patients identified 9 differentially expressed proteins in the MDD patients. These proteins are mostly involved in lipid metabolism and the immune system.1,14
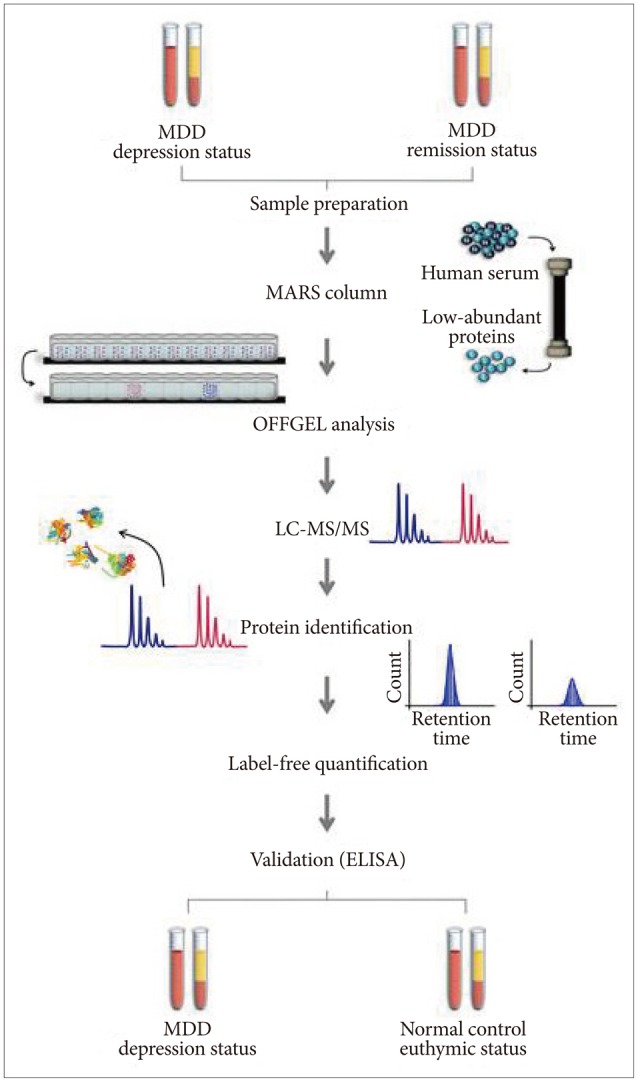
Using a proteomic approach, sets of differentially expressed proteins for different mood statuses can be identified, which would aid in deciphering the molecular pathway for development of depression. In doing so, a more comprehensive understanding of the pathophysiology of depression could be established, along with the identification of a biomarker for clinical applications.16 In this study, we compared the same patient's proteome between the depression status before treatment and during the remission status after antidepressant treatment. Each patient's protein expression was individually analyzed to identify biomarker candidates with accurate diagnostic ability. Thus, the proteins would be not trait markers but state-markers of depression. Finally, we validated the protein expression in MDD patients with matched normal control subjects using enzyme-linked immunosorbent assays (ELISA). The workflow of this study is shown in Figure 1. Here, we report 3 proteins that distinguish the depressive mood of MDD from the euthymic mood of normal controls, which may serve as potential serum biomarkers of depression.
METHODS
Subjects
Patients with MDD were recruited from the outpatient psychiatric clinic of Eulji General Hospital, located in Seoul, Korea. Diagnosis of MDD was based on the diagnostic criteria of the Diagnostic and Statistical Manual of Mental Disorders, Fourth Edition. When enrolled in the study, the patients were free of any psychiatric medications for at least 2 weeks. Besides routine clinical evaluations by a psychiatrist, patients were individually interviewed by research nurses using the Korean version of the Mini-International Neuropsychiatric Interview to exclude any other psychiatric diagnoses. Consensus diagnostic meetings of two psychiatrists and research nurses, including the psychiatrist in charge of patient treatment, made the final diagnosis of patients. Subjects with a history of any kind of organic abnormality of the brain, substance abuse problem, or other physical conditions possibly manifesting as psychiatric symptoms were excluded from this study.
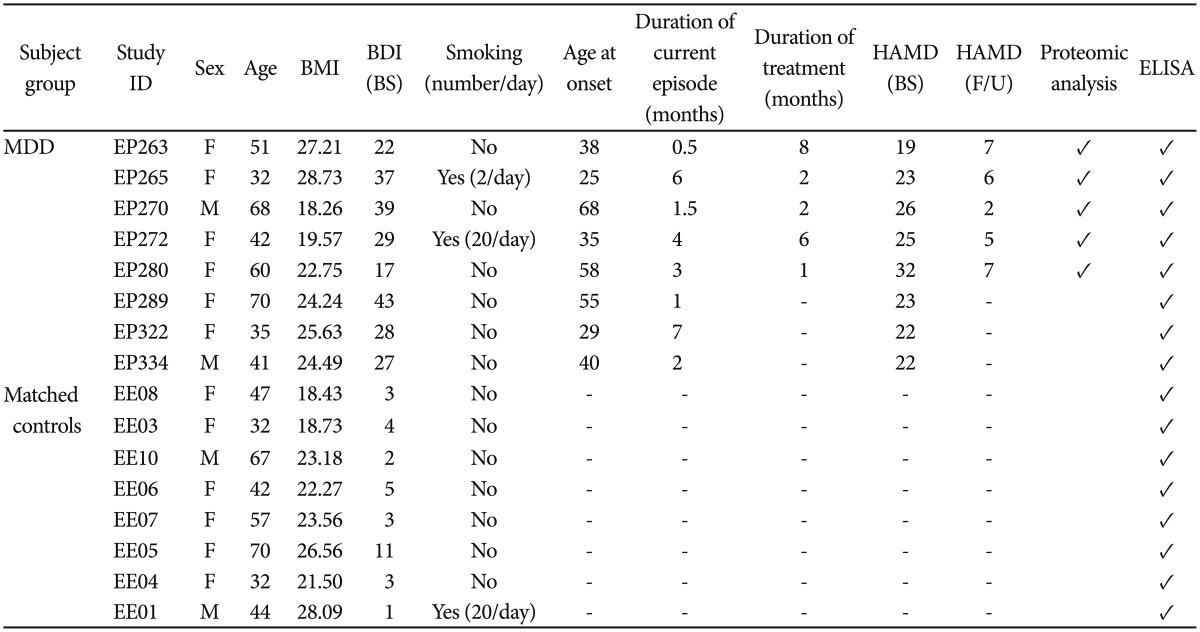
Initially, 5 patients, 1 male and 4 females, with MDD were included in the study. Their baseline Hamilton Depression Rating Scale-17 items score was between 19 and 26. The duration of their current depressive episodes was from 2 weeks to 6 months. Detailed information on each patient is presented in Table 1. All patients were treated and followed up as outpatients. Escitalopram was the only antidepressant prescribed in this study. Alprazolam and zolpidem were permitted only to control anxiety and insomnia. During the treatment period, 10 to 20 mg of escitalopram and 0.25 to 0.75 mg of alprazolam were prescribed to treat the patients. Blood sampling was performed twice: before beginning the medications and at the remission of depressive symptoms during the treatment period. When obtaining blood samples during remission, patients were on 20 mg of escitalopram and 0.25 to 0.75 mg of alprazolam, but did not need to use zolpidem. Blood was sampled randomly without asking subjects to fast or refrain from smoking. The patients were evaluated with the Hamilton Depression Rating Scale-17 items at each clinical visit until remission. Remission of depressive symptoms was defined as a Hamilton Depression Rating Scale-17 items score below 7. A period of 1 month to 8 months was required to achieve remission of depressive symptoms for the 5 patients. Additionally, 3 more patients (2 females and 1 male) were included for the validation process with ELISA. The same criteria for inclusion and exclusion were applied. Control subjects were also recruited for comparison. Controls were recruited from among the nurses and administrative officers of the hospital. The Beck Depression Inventory was applied to evaluate the depressive mood of control subjects and their Beck Depression Inventory range was from 1 to 11. A brief psychiatric interview was performed by psychiatric research nurses to evaluate current and past psychiatric illness. Subjects with a lifetime history of major psychiatric illness and/or brain trauma were excluded. Eight control subjects were matched for sex and age with the 8 MDD patients (Table 1). All subjects participating in this study signed a written informed consent form, and the study protocol was approved by the ethics committee of Eulji General Hospital.
Proteomic experiments
Serum collection
Blood samples were collected in a vacutainer with no anticoagulant tubes. Serum was prepared by placing samples at room temperature for 2 h for blood coagulation, followed by centrifugation at 4000├Śg for 5 min. The resulting supernatants were stored at -80Ōäā in Low Binding Eppendorf tubes prior to analysis.
Serum depletion by multiple affinity removal system LC column
Serum contains high-abundant proteins such as albumin and immunoglobulin, which comprise about 90% of total serum proteins. These high-abundant proteins inhibit the detection of low-abundant proteins in the proteomic analysis of serum. We depleted 6 high-abundant proteins (albumin, IgG, IgA, transferrin, haptoglobin, and antitrypsin) from individual serum using a multiple affinity removal system column (human 6, 4.6├Ś50 mm; Agilent Technologies, Santa Clara, CA, USA). In brief, the serum samples were loaded onto the column (Agilent Technologies, Santa Clara, CA, USA). The proteins in pools of flow-through low-abundance fractions for each sample were collected and then loaded onto the column. The depleted sample solutions were concentrated with an Amicon Ultra Centrifugal Filter Device (3000 NMWL; Millipore, Billerica, MA, USA).
Sample preparation and tryptic digestion
The concentrations of individual serum proteins from the multiple affinity removal system column were measured using a Quant kit (GE Healthcare, Piscataway, NJ, USA). Protein samples (1 mg) were treated with 5-mM Tris (2-carboxyethyl) phosphine (Pierce, Rockford, IL, USA), and then incubated at 37Ōäā at 75├Śg for 30 min for reduction. Next, 15-mM iodoacetamide (Sigma-Aldrich, St. Louis, MO, USA) was added to each sample and incubated at room temperature at 300 rpm for 1 h in the dark. Then, samples were incubated overnight at 37Ōäā with trypsin (Promega, Madison, WI, USA) to digest the proteins into peptides. The C18 cartridge (Waters, Milford, MA, USA) was used to clean up the peptide mixtures. The dried peptides were dissolved in 360 ┬ĄL of water for OFFGEL electrophoresis.
Peptide fractionation by OFFGEL electrophoresis
In order to identify more proteins, peptides from individual serum proteins were separated according to their isoelectric point through the OFFGEL Fractionator with a 12-well setup (3100 OFFGEL Low Res Kit, pH 3-10; Agilent Technologies, Santa Clara, CA, USA). The protocol was followed as per the manufacturer's instructions.
Microcapillary liquid chromatography-tandem mass spectrometry (LC-MS/MS)
The mass of each peptide fraction was analyzed using the high-performance liquid chromatography-chip/quadrupole time-of-flight (Q-TOF) system (Agilent Technologies, Santa Clara, CA, USA). The peptides from each patient's sample were analyzed without a pooling process to confirm individual protein expression patterns. The system consisted of an Agilent 1200 series nano-LC system and an Agilent 6520 Q-TOF coupled with a chip cube interface. The high-performance liquid chromatography-chip is comprised of a 160 nL enrichment column and a 75 ┬Ąm├Ś150 mm separation column packed with Zorbax 300SB-C18 (5 ┬Ąm). Each sample was run for 52 min at a flow rate of 4 ┬ĄL/min.
The Q-TOF mass spectrometer was set to positive ionization mode. The drying gas (nitrogen gas) flow was set at 5 L/min and 300Ōäā. Eluting peptides were selected for collision-induced dissociation during alternative procedures of an MS scan over the m/z range of 300-2400 at the rate of 4 spectra/s and an MS/MS scan over the range of 100-3000 m/z at 3 spectra/s. The isolation window was 4 m/z.
Protein identification by database search
We identified proteins from the peptide masses analyzed. In brief, tandem mass data from the Q-TOF instrument was converted to mzXML by Trapper 4.3.1 (Trans-Proteomic Pipeline, ISB, Seattle, WA, USA) for database searching in SEQUEST (Sorcerer 3.5; Sage-N Research, Lajolla, CA, USA). A UniProKB proteomes database (released in November 2012, HUMAN) was used to search each triplicate run with the following parameters: precursor mass tolerance, 20 ppm; product ion mass tolerance, 50 ppm; 2 missed cleavages allowed; fully tryptic peptides only; fixed modification of carbamidomethyl cysteine; variable modifications of oxidized methionine; and N-terminal carbamylation. A false positive rate of 5% was used for this result. In the case of a protein, we evaluate the quality of protein identification with an error rate of less than 1% from ProteinProphet (Trans-Proteomic Pipeline, ISB, Seattle, WA, USA).
Label-free quantification of protein expression
Each patient's protein expression was quantified for the depression and remission statuses using IDEAL-Q software (http://ms.iis.sinica.edu.tw/IDEAL-Q). IDEAL-Q software enables label-free quantification, which determines the relative amount of proteins in biological samples. Unlike other protein quantification, label-free quantification does not have to bind to an isotope. In brief, IDEAL-Q was used to continuously process all peptides in each LC-MS/MS run, both identified and unidentified, to quantify as many peptides as possible. Then, the predicted elution time was used to detect peak clusters of the assigned peptide. Detected peptide peaks were processed by statistical and computational methods and further validated by a signal-to-noise ratio >3, correct charge state, and isotopic distribution criteria to filter out noisy data. Based on the peptide ratio distribution, the peptide normalization step could be processed. The protein abundance ratio was determined by the weighted average of non-degenerate peptides.
Bioinformatics analysis
Bioinformatics analysis was carried out to confirm whether biomarker candidate proteins could differentiate mood status (depression vs. remission). The functional annotation network for Gene Ontology terms was visualized and statistically evaluated using ClueGO (v 2.0.6) plug-ins integrated in Cytoscape v 3.0.1 (ISB, Seattle, WA, USA). The protein expression profile of biomarker candidates was imported to the DanteR software v 1.0.0.10 (http://omics.pnl.gov/software) for proteomic analysis. Statistical calculations, such as hierarchical clustering, correlation studies, and principal component analyses were carried out using the DanteR software. The correlation coefficient between samples was calculated for all paired samples in a correlation matrix. GeneGo MetaCore v 6.15 (GeneGo, St. Joseph, MI, USA) was used to assign functional pathways. The significant pathway maps based on GeneGo analysis were mapp-ed and analyzed.
Validation
Validation of identified proteins by ELISA
An ELISA was performed as a validation process for the proteins differentially expressed in the depressive status. Thus, the current proteomics study identified 10 differentially expressed proteins. An ELISA measures the exact expression levels of proteins. Assays were done for the depressive status of MDD patients and the euthymic status of matched normal control subjects. The same 5 patients from the proteomic experiment and 3 additional new MDD patients were included. Eight matched normal control subjects were also included. The serum protein levels in 7 of the 10 proteins were measured using a commercially available sandwich ELISA kit (Cusabio, Wuhan, China), except for the immunoglobulin heavy chain V-III region BUR, apolipoprotein C-III, and immunoglobulin J chain proteins. These proteins could not be validated because of restricted availability. The protocol was followed as per the manufacturer's instructions.
Statistical analysis
In order to evaluate the diagnostic ability of biomarkers to predict the depressive status of MDD, receiver operating characteristic (ROC) curve analysis was conducted. Areas under the ROC curve (AUC) that are close to 1 have a high power to distinguish the two populations (normal controls vs. MDD patients). ROC curves were analyzed using MedCalc (v 12.7.2, MedCalc Software, Mariakerke, Belgium). Comparison of protein expression by ELISA was performed using the Mann-Whitney U test between normal controls and MDD patients with the Statistical Package for the Social Sciences software, for windows version 16.0 (SPSS 16; SPSS Inc., Chicago, IL, USA).
RESULTS
Comparative proteomic analysis was performed using label-free quantification by LC-MS/MS analysis. The depression status before treatment and remission status after antidepressant treatment of MDD patients were compared. Proteins identified as differentially expressed in depression were validated by ELISA, which compared MDD patients with matched normal controls.
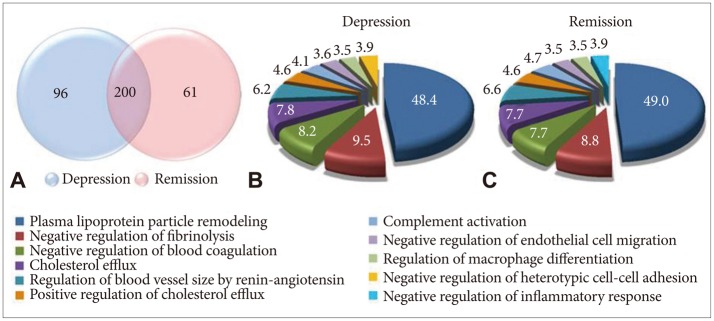
Serum samples showed altered protein expression depending on mood status (Figure 2). A total of 6467 peptides and 357 proteins were identified by LC-MS/MS analysis, 157 proteins of which were altered depending on mood status. We categorized proteins according to their biological functions using Gene Ontology. The 10 most promising biological functions are shown in the pie charts in Figure 2. After antidepressant treatment, there were some alterations in the proportions of protein functions. Negative regulation of the heterotypic cell-cell adhesion function disappeared and negative regulation of the inflammatory response function appeared during the remission status achieved by antidepressant treatment.
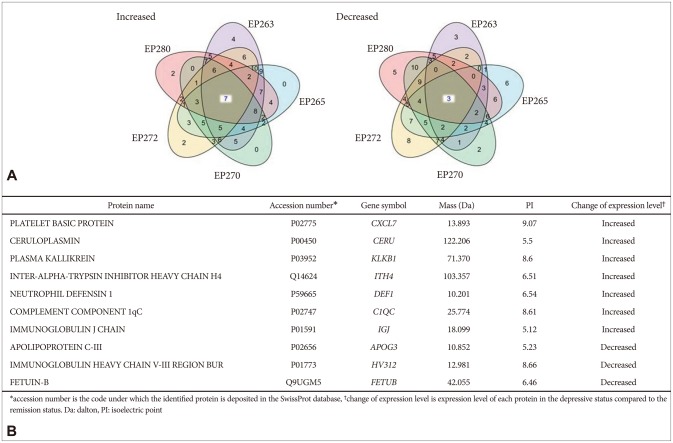
We identified upregulated and downregulated proteins in the depression status compared with the remission status after antidepressant treatment. Among them, 10 proteins were consistently upregulated or downregulated in the same direction in the 5 MDD patients. There were 7 upregulated proteins and 3 downregulated proteins in the depression status (Figure 3A). The platelet basic protein; ceruloplasmin; plasma kallikrein; immunoglobulin J chain; inter-alpha-trypsin inhibitor heavy chain H4 (ITIH4); neutrophil defensin 1; and complement com-ponent 1qC (C1QC) were increased, while the apolipoprotein C-III, immunoglobulin heavy chain V-III region BUR, and fetuin-B were decreased in the serum obtained before antidepressant treatment compared with the serum levels after antidepressant treatment. The accession number, gene symbol, mass, and isoelectric point of the 10 proteins are summarized in Figure 3B.
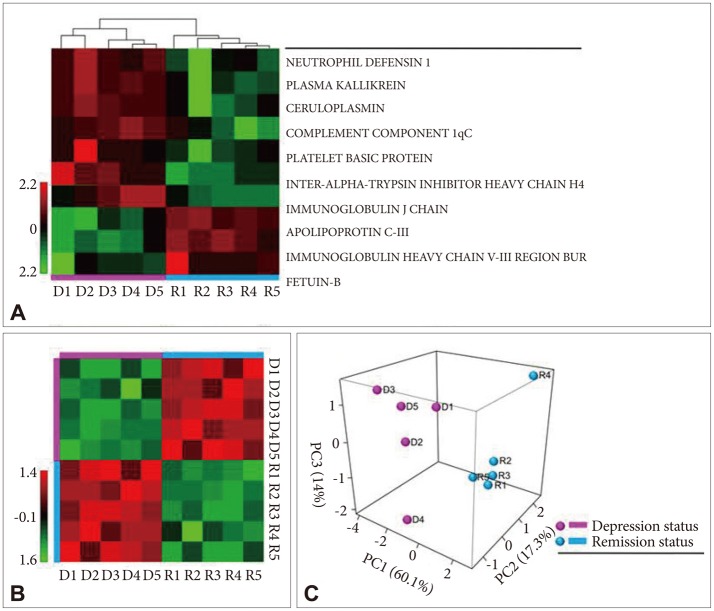
The relative intensities of the 10 proteins are shown in Figure 4A. All 5 patients showed the same direction of expression regulation. There was a distinction in the expression direction of proteins between the depression and remission statuses. Sample grouping in a heat map also showed that the 10 proteins were able to distinguish between the depression and remission statuses (Figure 4A). The correlation matrix showed a high correlation between the same mood status patients and low correlation between the depression and remission status group patients (Figure 4B). Similar results were obtained in the principal component analysis. For the principal component analysis, the 10 proteins were sorted into two groups: depression or remission status (Figure 4B). The results show that these 10 proteins could be reasonable biomarkers for distinguishing between a depression status before treatment and remission status after treatment.
In the validation process with ELISA using matched normal controls, 3 proteins showed results consistent with the label-free quantification by proteomic analysis (Figure 5A, C, and E). In addition, ELISA protein quantification identified a statistically significant difference between the normal control subjects and patients with MDD. The 3 proteins were ceruloplasmin, C1QC, and ITIH4. The serum levels of these proteins show-ed upregulation in the depression status. ROC curves for these proteins are presented in Figure 5. The AUCs of ceruloplasmin, C1QC, and ITIH4 were 0.798, 0.653, and 0.819, respectively. When we calculated the AUCs of the 3 proteins together, the AUC increased to 0.911. These figures indicate these proteins can discriminate between a depressive and euthymic status (Figure 5G). However, we could not find any dose dependency of depressive mood in our 3 candidates proteomic change (data not shown).
DISCUSSION
A proteome, rather than a single protein, could represent biological changes as a whole according to mood status. Multiple gene-gene interactions and gene-environmental interactions may be reflected in a proteome. We found 3 potential biomarker candidate proteins for MDD through comparative proteomic study and a validation process using matched normal control subjects. Ceruloplasmin, C1QC, and ITIH4 seem to be associated with the depressive mood status.
Neurotransmitters such as serotonin, noradrenaline, adrenaline, and dopamine are activated or inactivated by enzymes. It has been reported that ceruloplasmin plays a role in the oxidation of neurotransmitters.25 The ceruloplasmin protein carries copper in the blood and contains 95% of the copper found in human serum.26 Copper is a co-enzyme that plays a crucial role in the action of ceruloplasmin. Increased ceruloplasmin in the blood causes decreased copper in the serum and brain. Copper reduction in the brain produces inappropriate enzymatic reactions and leads to an imbalance of neurotransmitters. Our finding of an increased ceruloplasmin level in the depressive status suggests that the alteration of ceruloplasmin may cause the reduction of copper in the brain, which then contributes to the development of MDD. There have been studies reported that copper is associated with MDD.27,28 There is increasing evidence that metal ions such as copper play a role in neurodisease via mediating neurotransmitter receptor proteins.29 Alternatively, the increased ceruloplasmin may be a result of the biochemical changes in depression. Similar to our findings, there have been studies reporting that the ceruloplasmin level in the blood of MDD patients was increased, along with other acute-phase plasma proteins.30,31 Another study reported that the ceruloplasmin level was decreased in MDD, however this finding was not supported by individual protein validation.14 These inconsistencies between studies could originate from differences in study design or sample characteristics. Further studies to determine the exact relationship between MDD and serum ceruloplasmin levels, as well as the biological meaning behind the relationship are warranted.
C1QC is the first component of the classical pathway in complement activation.32 Because the brain is an important organ that controls human behavior and thought, it has a defense function called the BBB to protect it from harmful foreign bodies such as bacteria. The BBB forms a compactly closed structure by connecting capillary endothelial cells that are surrounded by a pedicle of astrocytes. The increased permeability or breakdown of the BBB by several factors is hypothesized to lead to psychiatric illnesses or brain damage. Increased permeability of the BBB may cause serum-derived components to leak into the brain.33 Neurospecific proteins may also pass into the blood, and be recognized as non-self, resulting in autoantibody production. Subsequently, the autoimmune system will trigger the classical pathway via C1QC and increase complement protein synthesis.34 In this way, complement activation would be related to the alteration of the BBB. In addition, when we investigated the patients' proteomes more broadly, we found that several proteins were upregulated or downregulated in the same direction in least 4 out of 5 patients. C1QC and 7 other proteins drew the classical complement pathway as the top-ranked pathway in the network analysis using GeneGo software. Furthermore, it was reported that the expression of C1QC is dramatically upregulated in animal models of central nervous system disease. Lynch et al.35 also suggested that increased synthesis of C1QC precedes BBB dysfunction in rats. Altogether, it is suggested that C1QC upregulation may result from activation of the autoimmune system in the depressive status of MDD. This finding would support the increased permeability hypothesis of MDD.
The ITIH4 protein is secreted into the blood and is known to be very sensitive to cleavage by plasma kallikrein. It is one of the acute-phase proteins and its plasma level is slightly raised in patients with inflammatory disorders.36,37,38 Acute-phase proteins are a class of proteins whose plasma concentrations increase or decrease in response to inflammation. Previous studies have shown an increase of acute-phase proteins in MDD patients.39,40,41,42 In this study, the level of ITIH4 was altered during the depressive mood in MDD patients. A genomic study by Tochigi et al.43 suggested that ITIH4 was upregulated in the prefrontal cortex of postmortem brains of MDD patients. These increases in acute phase proteins are consistent with the results of biological function classification of proteins in depression (Figure 2). The 'negative regulation of inflammatory response' in the remission status group after antidepressant treatment implies that any process that stops, prevents, or reduces the frequency, rate, or extent of the inflammatory response. Thus, the inflammatory response is downregulated in depression. The reduction of the inflammatory responses that accompanies the acute-phase response indicates a reduction of positive acute-phase proteins such as ITIH4. In other words, functional category classification analysis suggests that positive acute-phase proteins such as ITIH4 increase in the depressive status. Interestingly, ceruloplasmin itself is also one of the acute-phase proteins.44 Our findings suggest that acute-phase proteins in the blood are associated with different mood statuses, and that inflammation may be an underlying biochemical response of depression. ITIH4 and ceruloplasmin could be potential diagnostic biomarkers for depressive mood status.
MDD is a complex phenotype caused by various biological disturbances and may induce multiple physiological changes. Therefore, sets of proteins, rather than individual proteins, are much more likely to explain the physiological changes of MDD. These proteins may construct a physiological network that plays a role in MDD. Recently, there has been a study of a multi-assay, serum-based biological diagnostic test for MDD.45 The authors examined the composite value of biomarkers, which individually explained a very modest proportion of the variance in depression risk. The 9 serum biomarkers (alpha1 antitrypsin, apolipoprotein C-III, brain-derived neurotrophic factor, cortisol, epidermal growth factor, myeloperoxidase, prolactin, resistin, and soluble tumor necrosis factor alpha receptor type II) were selected from the proteins of biochemical domains associated with MDD. Those domains included inflammation, neurotrophism, hypothalamic-pituitary-adrenal axis, and metabolism. They confirmed 80% or greater sensitivity and specificity of the multi-assay, serum-based biomarker test. In comparison, our study was a trial to find a useful set of biomarker proteins, pulled from our own proteomic study. As expected, our candidate proteins have good diagnostic value individually, and even better predictive diagnostic value additively. Future biomarker discovery studies should target sets of proteins rather than single proteins.
Even though the sample size in this study was small, we tried to validate our own proteomic data using ELISA. Our intrasubject comparison design between the depression status before antidepressant treatment and the euthymic remission status after antidepressant treatment is unique, but cannot exclude antidepressant medication effects. Therefore, we collected matched normal euthymic control subjects in order to compare mood statuses exclusively. In the ELISA, the comparison was made between depressive patients without antidepressant medication and matched euthymic controls. Matching was done based on age and sex. This range of matching was not sufficient or com-plete, which should be taken into consideration when interpreting the ELISA results. Evaluating the results with an independent method enabled us to identify protein markers altered de-pending on the disease status and not depending on medication effects. Nevertheless, it is still possible that large number of altered proteins may also include those proteins whose function is altered due to medication.
Our results must be considered preliminary because of several limitations. First, the sample size in this study was small and did not have the necessary power to detect significant findings. Since multiple factors such as the genetic heterogeneity of human samples, effects of illness state, and medication history can influence gene expression, proteomic studies may require a bigger sample size to overcome these complex confounding effects.46 Second, several factors may influence serum protein levels, such as diet, exercise, and medication. Our study could not control for all of the possible confounding factors that may affect serum protein expression, as it is not possible to control these factors completely in humans. We tried to reduce the confounders in several ways. For example, repeated measurements of biomarker levels for any given patient over various time intervals was suggested.47 In this study, we analyzed the proteome of each patient at two different time points and compared them. In addition, our patients were treated with escitalopram and no other antidepressant was allowed. Lastly, we did not pool samples, but instead analyzed the data for each patient individually. The proteomic result was extracted only if every subject showed the same protein direction change depending on mood status. Third, we used blood samples instead of brain tissue or CSF. It is true that blood samples have limitations in terms of indirect representation of the brain. However, blood is likely a more useful and realistic sample for identifying biomarkers in clinical practice than the brain.
In conclusion, to our knowledge, this is the first proteomic study for MDD that was designed to consider not only different mood statuses, but also interindividual differences among patients. In this study, we employed label-free quantification using the high-performance liquid chromatography-chip/Q-TOF system to analyze the protein profile of blood samples in MDD patients. Based on the proteome data and ELISA validation, the ceruloplasmin, C1QC, and ITIH4 proteins were significantly upregulated in the depressive mood status. This upregulation might be a consequence rather than a cause of the disease state. This finding supports that inflammation is one of the main pathophysiologies associated with depression. In spite of the limitations of this study, our results provide a new proteome platform for diagnosing MDD. Additionally, these differentially expressed proteins may be potential biomarkers for MDD diagnostics and treatment. At this point, the evidences has just begun to accumulate for biological relationship between these proteins and depression, our findings should be considered carefully and further studies are definitely warranted.