Development of Efficient Brain Age Estimation Method Based on Regional Brain Volume From Structural Magnetic Resonance Imaging
Article information

Abstract
Objective
We aimed to create an efficient and valid predicting model which can estimate individuals’ brain age by quantifying their regional brain volumes.
Methods
A total of 2,560 structural brain magnetic resonance imaging (MRI) scans, along with demographic and clinical data, were obtained. Pretrained deep-learning models were employed to automatically segment the MRI data, which enabled fast calculation of regional brain volumes. Brain age gaps for each subject were estimated using volumetric values from predefined 12 regions of interest (ROIs): bilateral frontal, parietal, occipital, and temporal lobes, as well as bilateral hippocampus and lateral ventricles. A larger weight was given to the ROIs having a larger mean volumetric difference between the cognitively unimpaired (CU) and cognitively impaired group including mild cognitive impairment (MCI), and dementia groups. The brain age was predicted by adding or subtracting the brain age gap to the chronological age according to the presence or absence of the atrophy region.
Results
The study showed significant differences in brain age gaps among CU, MCI, and dementia groups. Furthermore, the brain age gaps exhibited significant correlations with education level and measures of cognitive function, including the clinical dementia rating sum-of-boxes and the Korean version of the Mini-Mental State Examination.
Conclusion
The brain age that we developed enabled fast and efficient brain age calculations, and it also reflected individual’s cognitive function and cognitive reserve. Thus, our study suggested that the brain age might be an important marker of brain health that can be used effectively in real clinical settings.
INTRODUCTION
“Brain age” is regarded as one of biomarkers for brain health, which can reflect risks of developing cognitive dysfunction and age-related brain diseases [1,2]. A variety of prediction methods, based on structural and functional neuroimaging, which can determine the individual trajectory of brain maturation and aging have been suggested in the field of neuroscience [3,4]. Most studies used subjects’ magnetic resonance imaging (MRI) of the brain and their chronological ages to develop and train machine learning model. The trained model than can be used to predict individuals’ biological age of the brain by analyzing their brain MRIs [2,5,6]. The difference between the biological age of the brain predicted by the model and individual’s actual chronological age is then used to infer degree of brain health or severity of cognitive decline.
The brain age predicting models developed so far was basedon so called data-driven strategies, so they inevitably contained multiple drawbacks which limited their widespread applications in real clinical practice. First of all, MRI images usually required complex and time-consuming preprocessing steps, which resulted in the data to be pipeline dependent [7]. In addition, the majority of the research on brain age has adopted a global approach, utilizing either data from the whole brain or total grey matter, to estimate the individual’s biological age of the brain [8]. In such approach, reducing whole-brain information from tens of thousands of voxels into a single number is “overly black-boxed [1]." As a result, it is difficult to determine which characteristics were used to predict biological age of the brain. In the other perspective, the prediction model could have ignored important clinical and neuroimaging information, and such erroneous decision can become unnoticed by the clinicians. Therefore, a method that can calculate individual’s brain age using a faster, simpler, and more transparent process based on neurobiological evidence is required for clinical practice.
Regional brain volume measurement is considered as one of the most important and reliable markers of cognitive functions. Previous longitudinal studies showed that spatial patterns of atrophic change were associated with the speed and extent of cognitive decline [9-11]. Some researchers claimed that the volume measurement of each brain region can also be used as a proxy for brain reserve [11-15]. Despite the above findings, developing a model predicting brain age based on regional volume measurement was difficult because calculating the regional brain volume with pre-existing neuroimaging tools required several hours per subject. However, multiple automatic brain segmentation technologies have recently been developed, which enabled researchers and clinicians to overcome the previous obstacles by utilizing pre-trained model [16,17].
Taken these together, we aimed to develop an efficient and valid predicting model which can estimate individuals’ brain age by quantifying the degree of atrophy present in their brain. We hypothesized that the model can quickly and accurately predict brain age reflecting the individual’s cognitive state using the brain volume of each region.
METHODS
Participants
We included a total of 2,560 structural MRI scans from adults who visited outpatient clinic at the Brain Health Care Center, Yeouido St. Mary’s Hospital, The Catholic University of Korea, Seoul, Korea. The participants were divided into three groups: cognitively unimpaired (CU), mild cognitive impairment (MCI), and dementia. The patients in MCI and dementia group were diagnosed based on National Institute on Aging and Alzheimer’s Association (NIA-AA) criteria [18,19]. Clinical dementia rating (CDR) was assessed by the two qualified geriatric psychiatrist (S.M.W and H.K.L) in our clinic [20]. The Mini-Mental State Examination in the Korean version of Consortium to Establish a Registry of Alzheimer’s Disease Assessment Packet (MMSE-KC) were also obtained from each individual [21]. The chronological ages were calculated by subtracting birth date from MRI acquisition date for each subject. The Institutional Review Board of The Catholic University of Korea (IRB SC22RIDI0153), which established ethical and safety guidelines, approved all study procedures, and written informed consent was waived because we used retrospective data.
Imaging acquisition and preprocessing
MRI images were scanned using a Siemens Skyra 3T scanner (Siemens Healthcare, Erlangen, Germany) equipped with a 20-channel head & neck coil. Structural T1-weighted images were obtained using a MPRAGE sequence with the parameters as follows: repetition time=1,860 ms, echo time=25.3 ms, flip angle=9°, field of view=224×224 mm, matrix size of 256×256, and 208 axial slices with a slice thickness of 1.0 mm. Acquired DICOM files were anonymized and converted to NIfTI format with dcm2niix [22].
Predicting brain age gap
The age of the brain can be determined through the calculation of its volume, which is obtained by analyzing brain MRI images using a commercially available segmentation tool developed by “Neurophet” Inc. (Seoul, Korea), “AQUA [16,17].” Specifically, regions of interest (ROIs) within the total brain volume are identified and quantified to derive the brain age. The selection of the ROIs is based on the identification of 12 regions as shown in Supplementary Table 1 (in the online-only Data Supplement). To account for variations in brain region size, we have taken the inverse of ventricle, as more dilatation of ventricles is associated with poorer brain health.
The process of determining brain age through mathematical computations entails several stages. First at all, the volumetric differences in the ROIs between the CU and cognitively impaired (CI) groups are quantified. The weight value, wc, reflecting the volume differences for certain ROI component, c, is calculated by following formula:
where Vc(p) is the participant p’s volume value for ROI component c, and nCU and nCI are the number of CU and CI group, respectively. We included individuals with dementia diagnosis into the CI group. Note that Vc(p) was normalized so it has float value between 0.0 and 1.0, and the higher value represents the higher rank in the total population and the larger regional volume. For the cases of left and right lateral ventricle, we used inversed values (subtracted Vc(p) from 1), because the enlarged ventricle is an indicator of brain atrophy.
Subsequently, the ROI volumetric values for each patient are multiplied by wc, and the resulting values are cumulatively summed to obtain the values of age gap, g(p), as following:
where
Finally, using the age gap obtained above, the brain age BA(p) for each patient p was calculated. In this process, different formulae were applied based on whether each subject contains “atrophic region” or not. An atrophic region was defined as an area where the volume is equal to or less than the bottom 5 percentile of the volume (
with the age gap g(p) and scaling parameter θ. The scaling parameter θ is set to 7, allowing for an estimation of brain age that ranges from 7 years younger to 7 years older than the actual age. Herein, the difference between each participant’s brain age and chronological age is defined as “brain age gap.”
Statistical analysis
The independent t-test and analysis of variance was performed on normally distributed data while the Mann–Whitney U and Kruskal–Wallis tests were performed for continuous variables that did not show normal distributions. Chisquare test was applied to test the difference of categorical variables for demographic and clinical characteristics. Correlational relationship was analyzed using Spearman’s rank correlation test because of the absence of normality for clinical variables. All statistical analysis was performed via “Scipy” package (version 1.10.0; https://docs.scipy.org/doc/scipy/release/1.10.0-notes.html) and Python 3.10.9 (https://www.python.org/downloads/release/python-3109/).
RESULTS
Demographics and clinical characteristics
The demographic and clinical characteristics of study participants are summarized in Table 1. The subjects were aged from 33 to 98 years, and 1,793 (70.0%) were females. The total participants in CU, MCI, and dementia groups were 1,009 (39.4%), 1,173 (45.8%), and 378 (14.8%), respectively. The three groups did not significant differences in sex. However, rate of ApoE4 carriers, chronological age, education level, and neurocognitive functions including MMSE-KC, CDR, and clinical dementia rating sum-of-boxed (CDR-SB) scores showed statistical differences among the three groups (all p<0.001).

Demographic and clinical characteristics of study participants
Regional volumes
Measure of bilateral regional volumes for four cortical regions (frontal, temporal, parietal, and occipital lobes), one bilateral subcortical region (hippocampus), and lateral ventricle volumes are described in Supplementary Table 1 (in the online-only Data Supplement), which all were statistically different among the three groups (for all p<0.001). The statistically significant differences among three cognitive groups were observed in all regions (all p<0.001). The proportions of the number of atrophic regions whose volume is under the lowest 5 percentile varied across the groups (Supplementary Table 2 in the online-only Data Supplement). In the CU group, almost two-third had no ROIs with below 5 percentiles. For the MCI group, a third had no atrophic regions, but the other third had one or two atrophic regions. In the dementia group, 2 to 4 atrophic ROIs were the most prevalent. For each number of atrophic ROIs, CU showed the highest rate in the case of no ROI or one ROIs, MCI in the case of two or three ROIs, and dementia in the case of four ROIs or more.
Brain age gap estimation
The distributions of brain age gap for subjects whose brain ages were older (brain age-old, BAup) (Figure 1A) or younger (brain age-young, BAdown) (Figure 1B) than their chronological ages are plotted in Figure 1. The values of calculated brain age gap were significantly higher in MCI than in CU and in dementia than in MCI for both cases. Averaged brain age gap was below zero only in CU or MCI groups with no atrophic regions, with stratifying the brain age gap by the number of atrophic ROIs (Table 2). For all three groups, mean values of brain age gap went higher as the number of atrophic regions are increased.
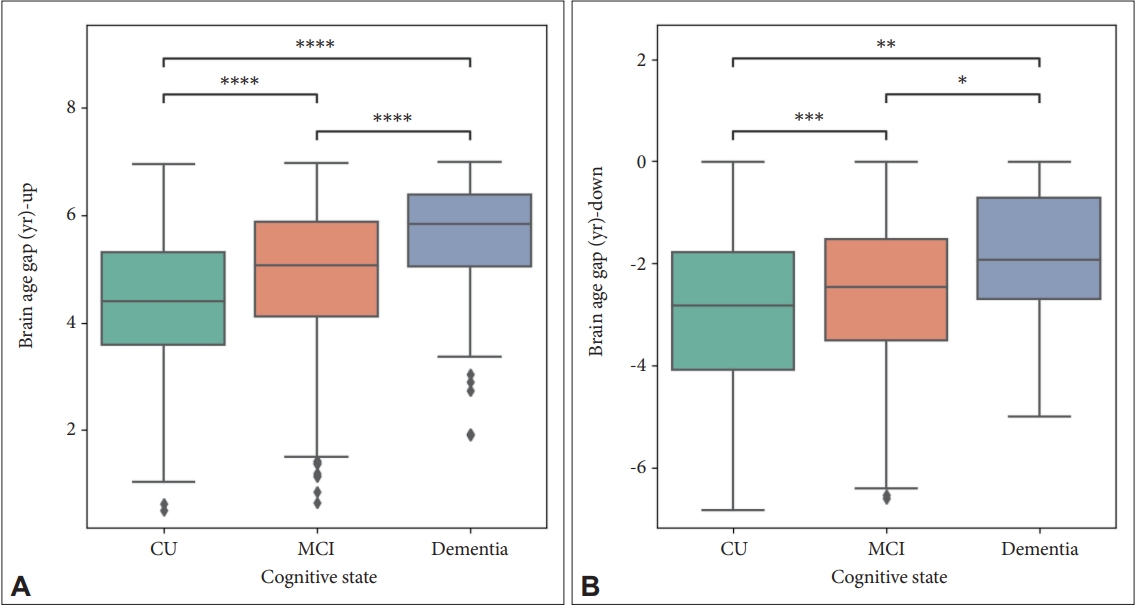
The distribution of estimated brain age gap which is older (A) or younger (B) than chronological age. Mann–Whitney U tests were performed. *denotes 0.01<p≤0.05; **denotes 0.001<p≤0.01; ***denotes 0.0001<p≤0.001; ****denotes p<0.0001. CU, cognitively unimpaired; MCI, mild cognitive impairment.

The average brain age gap for each group stratified by the number of region of interests (ROIs) whose volume is the lowest 5 percentile
Relationship between estimated brain age gap and demographic/clinical characteristics
Figure 2 represents the correlation between brain age gap and age, education, and cognitive status. The values of estimated brain gap were higher with increasing age (ρ=0.12 for BAup; ρ=0.18 for BAdown) and CDR-SB (ρ=0.41 for BAup; ρ=0.16 for BAdown) and decreasing educational level (ρ=-0.15 for BAup; ρ=-0.27 for BAdown) and MMSE-KC score (ρ=-0.39 for BAup; ρ=-0.20 for BAdown) for BAup (Figure 2A-D) or BAdown (Figure 2E-H). All p-values of correlation tests were lower than 0.0001.
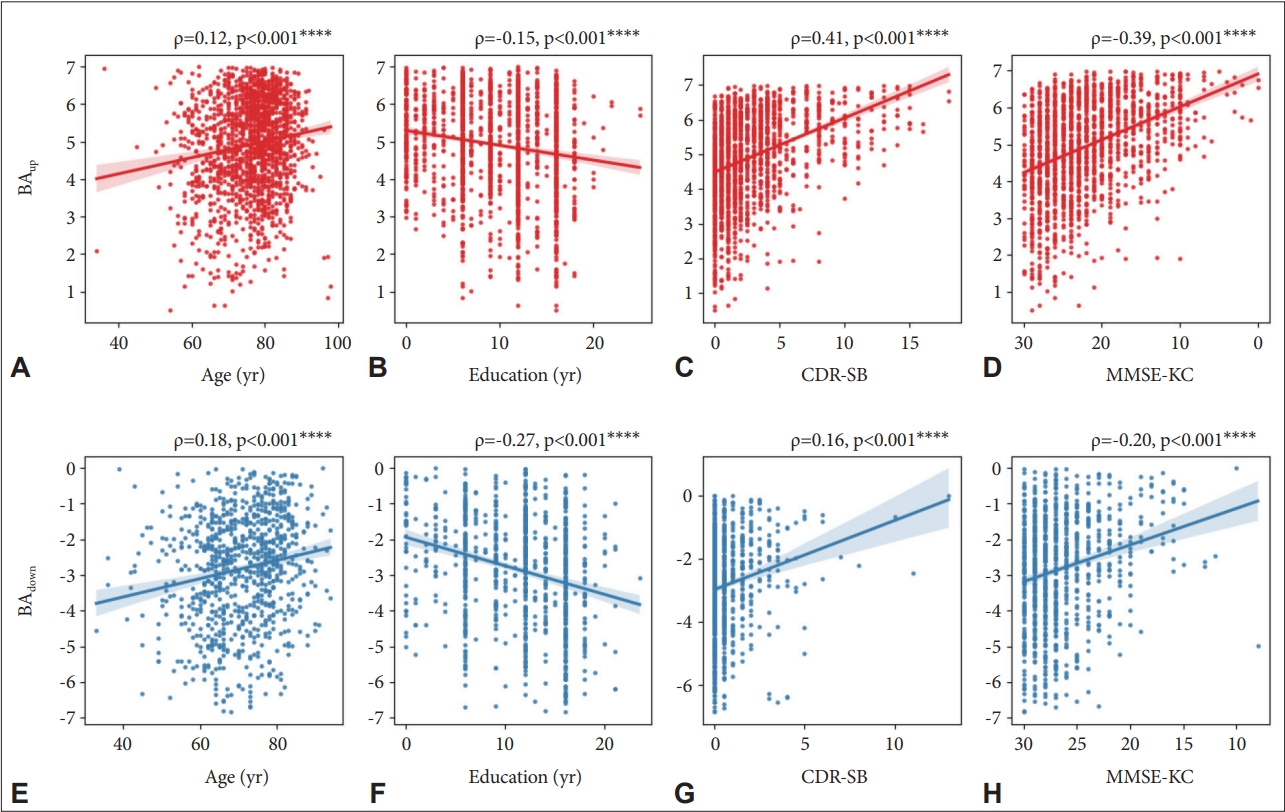
Correlation between brain age gap and clinical variables including chronological age, education years, clinical dementia rating sum-of-boxed (CDR-SB), and Mini-Mental State Examination in the Korean version of Consortium to Establish a Registry of Alzheimer’s Disease Assessment Packet (MMSE-KC). Subplots in the upper row (A-D) are the subjects with older brain age than their chronological age and those in the lower row (E-H) are the subjects with younger brain age. ****denotes p<0.0001. BAup, brain age-old; BAdown, brain age-young.
DISCUSSION
In this study, we aimed to develop an efficient and valid predicting model which can estimate individuals’ brain age by quantifying the degree of atrophy present in their brain. Specifically, a brain age estimation method using individual regional brain volume was devised by discriminating the atrophic regions using the normative regional volume of patients with CU, MCI, and dementia. We measured regional volumes of a large collection of structural MRIs by using automated parcellation and segmentation model, and we calculated brain age with the volumetric values from the 12 predefined ROIs. Our brain age estimation showed that the brain age was oldest, or the age gap between estimated brain age and chronological was highest, in patients with dementia followed by patient with MCI and CU.
The most remarkable advantage of this study was that the brain age was calculated quickly based on a simple and fast model. Unlike conventional machine learning-based methods, which utilized entire brain images as inputs for the brain age estimation [2,5,23-29], the model that we developed was able to calculate the brain age in real time using the brain volume values of 12 ROIs only. Moreover, the 12 ROIs that we used are common brain regions which are widely computed in diverse neuroimaging tools including surfaced-based analytic programs and voxel-based morphometries (VBMs) [30-33]. Thus, we were able to increase generalizability our estimation model. We also furthered previous models by giving larger weights to the ROIs having higher group differences. The mean volume difference between the CU group and the CI group, including MCI and dementia, for 12 ROIs were used to represent degree of these brain regions contribute to brain age calculation. By giving different weighted values, our model was able to reflect cortical atrophy more specific to MCI and dementia.
The estimated brain age of our model showed a clear association with severity of cognitive decline. The correlation coefficient of the brain age-old, or those having older brain age compared with their chronological age, for MMSE-KC and CDR-SB were 0.41 and -0.39, respectively. This correlation coefficient was comparable to the coefficient of a recently developed deep learning model, which showed 0.37 and -0.36 for MMSE-KC and CDR-SB, respectively [27]. However, the deep learning method required a huge amount of computational costs and training data, which limits its clinical utility and applicability. In contrast, the model that we developed did not require training in machine learning field, so we were able to minimize the computational costs.
In accordance with previous research, our model also showed a negative correlation between brain age and education level. Education level is known as one of the most important factors related to cognitive reserve [34-37]. In addition, those having a younger brain age relative to their chronological age or brain age-young showed relatively higher negative association with education level (ρ=-0.27) (Figure 2F). In other words, subjects with higher level of education tended to have larger regional brains, which resulted in brain age to be younger. This is in concordance with the study showing that the level of education might mediate the regional brain size of adults [38]. In this context, our study suggested that the brain age calculated using out estimation method not only might reflect each subject’s state of cognitive function but also might reflect their cognitive reserve.
There are several limitations in our study. First, our model showed a positive association between brain age gap and chronological age. The fact that the subjects’ chronological ages were not adjusted for brain age gap may have resulted in estimated age to decrease as the subjects’ chronological age increased. Thus, correction of this bias using normative regional volumes from each age group or regressing out the age from the regional volumes should be considered in the future study [29]. Second, all subjects were recruited from a single center from a single MRI scanner, which might limit generalizability our model. Studies containing MRIs of subjects from multiple centers and from diverse MRI scanners are needed in the future. Third, we only used global cognitive measures including CDR and MMSE-KC to define subjects’ cognitive status. A more detailed clinical characteristics obtained from the neuropsychological testing batteries could give us an opportunity to compare brain age and cognitive function more comprehensively. Thus, further studies are needed elucidate this important issue. Last, the value of parameter θ was arbitrarily selected. The ratio between brain age increases and g-value decreases should be more accurately determined through subsequent longitudinal studies and additional research involving cognitive reserves.
In conclusion, we proposed a new method to calculate brain age more efficiently and quickly using a large-scale brain structure MRI dataset. We also confirmed that the model we developed was a valid method to reflect cognitive function and cognitive reserve in patients having different trajectories of cognitive impairment. Thus, our brain age method might provide a valuable brain health biomarker which can be helpful in real clinical practice.
Supplementary Materials
The online-only Data Supplement is available with this article at https://doi.org/10.30773/pi.2023.0183.
Regional brain volumes of study participants for each group
The proportion of subjects by the number of region of interests (ROIs) which volume is the lowest 5 percentile or for each group
Notes
Availability of Data and Material
The datasets generated or analyzed during the current study are not publicly available due to Patient Data Management Protocol of Yeouido St. Mary’s Hospital but are available from the corresponding author on reasonable request.
Conflicts of Interest
Yoo Hyun Um and Hyun Kook Lim, a contributing editor of the Psychiatry Investigation, were not involved in the editorial evaluation or decision to publish this article. All remaining authors have declared no conflicts of interest.
Author Contributions
Conceptualization: Sunghwan Kim. Data curation: Sunghwan Kim, Hyeonsik Yang, Hyunji Lee. Formal analysis: Sunghwan Kim, Hyeonsik Yang, Hyunji Lee. Funding acquisition: Hyun Kook Lim. Investigation: Sunghwan Kim, Sheng-Min Wang, Dong Woo Kang, Yoo Hyun Um. Methodology: Sunghwan Kim, Hyeonsik Yang, Hyunji Lee. Project administration: Regina EY Kim, Donghyeon Kim, Hyun Kook Lim. Resources: Donghyeon Kim, Hyun Kook Lim. Software: Sunghwan Kim, Hyeonsik Yang, Hyunji Lee, Regina EY Kim. Supervision: Chang Uk Lee, Hyun Kook Lim. Validation: Sheng-Min Wang, Dong Woo Kang, Yoo Hyun Um. Visualization: Sunghwan Kim, Hyeonsik Yang, Hyunji Lee. Writing—original draft: Sunghwan Kim, Hyeonsik Yang, Hyunji Lee. Writing—review & editing: Sheng-Min Wang, Hyun Kook Lim.
Funding Statement
This research was supported by the Korea Health Technology R&D Project through the Korea Health Industry Development Institute (KHIDI) and Korea Dementia Research Center (KDRC), funded by the Ministry of Health & Welfare and Ministry of Science and ICT, Republic of Korea (grant number: HU20C0315).