INTRODUCTION
AlzheimerŌĆÖs disease (AD) could be characterized by a degenerative brain lesion that causes dementia symptoms [1]. Individuals with AD typically show a gradual decline in memory, and an ability to communicate or respond appropriately to the surrounding environment is lost in the late stage of AD, requiring a high level of supervision [1,2]. Thus, mild cognitive impairment (MCI), a prodromal stage of AD, has been highlighted along with the importance of early intervention for AD [2,3].
To date, although, a variety of methods have been implemented to distinguish MCI from normal aging in clinics, most heavily rely on traditional neuropsychological assessments such as the Montreal Cognitive Assessment (MoCA) [4]. However, prior studies have consistently indicated its low sensitivity and specificity to MCI as it can be highly affected by age, education levels of subjects, or assessorŌĆÖs proficiency [5].
To address this issue, brain imaging techniques such as functional magnetic resonance imaging (fMRI) and functional near-infrared spectroscopy (fNIRS) have been complementally adopted to differentiate MCI [6,7]. Out of these techniques, fNIRS is a relatively recently introduced technique that uses near-infrared light to non-invasively measure cerebral blood concentrations such as oxyhemoglobin levels [8,9]. A fNIRS has been widely used in clinics with its advantages such as high portability, relatively low cost, and high temporal resolution, compared to fMRI [8].
In related studies, fNIRS-derived brain data was found to sensitively discriminate MCI. Specifically, activity in the prefrontal cortex (PFC) during cognitive testing was measured and it was compared between healthy controls (HCs) and subjects with MCI. As a result, subjects with MCI showed an increase in prefrontal activity while showing similar levels of performance in cognitive tasks, compared to HCs [6].
On the other hand, to date, previous studies have mainly compared brain data using statistical methods to differentiate MCI and verify its clinical usefulness. However, statistical analysis was not appropriate as the standard deviation of an individualŌĆÖs brain activity was high and time series data were converted into simple average values and compared [10,11]. Recently, machine learning techniques have been developed and applied in medical fields for the purpose of personalized treatment and management [11,12]. Deep learning shows an excellent performance by learning a large amount of data using multiple structures modeled by artificial neural networks [13,14]. Notably, convolutional neural networks (CNNs) can achieve high accuracy and efficiency in the field of diagnosis using images, suggesting that they could be used to discriminate MCI using brain images [13,14].
Brain images have been mainly derived from fMRI, but recent studies have shown that fNIRS-derived time series data could be converted into images, which are used for CNNs [13,14]. Indeed, a previous study reported that CNN-trained images of spatial and temporal features from an fNIRS show higher accuracy than statistical analysis for discriminating MCI [13]. However, the clinical applicability of the fNIRS-derived data with CNNs remains unclear due to the absence of comparison with traditional screening tools such as the MoCA [13]. Therefore, the purpose of this study was to investigate the feasibility of using fNIRS-derived spatial features with CNNs for differentiating MCI.
METHODS
fNIRS data were measured while subjects were performing the N-back task. After the fNIRS-derived data preprocessing, brain images in the spatial domain were generated for the CNN model training. Finally, k-fold cross-validation was applied to assess the accuracy of the CNN model.
Participants
The original data set consisted of 82 subjects with MCI and 148 HCs. All subjects were older than 65 years of age and recruited from local senior centers in Asan-si, South Korea. According to a previous study [15], the inclusion criteria for MCI were as follows: 1) a subjective memory complaint; 2) an objective memory impairment confirmed by performance on neuropsychological assessments (below 1.5 standard deviations); 3) intact global cognitive function confirmed by the Cognitive Impairment Screening Test; 4) intact activities of daily living; and 5) without dementia confirmed by a physician. The exclusion criteria were as follows: 1) the presence of psychiatric disorders such as depression or schizophrenia and 2) the presence of neurological disorders such as stroke or traumatic brain injury. These criteria were based on amnestic MCI, which is one of the subtypes of MCI [15]. All subjects completed an informed consent form before participating in this study and all experiments were conducted in the laboratory setting. This study was implemented with the approval of the Institutional Review Board of Soonchunhyang University (202204-SB-056).
Procedures
As shown in Figure 1, the experiment consisted of three trials of the N-back task to evaluate working memory. Since working memory has been found to be correlated with the PFC function, the N-back task was chosen in this study.
Subjects were instructed to sit on a chair and asked to avoid their body movement. Firstly, all subjects took a 30-second resting state. During the resting state, subjects were directed to stare at the black cross shape on the white screen of the monitor. Then, the subject performed three trials of the N-back task, and each trial took 60 seconds, and a 30-second rest period was given between trials. This study used the computerized 2-back version of the N-back task wherein a number between one and nine was randomly presented on the monitor. When the current number on the monitor matched the second-last number displayed before, subjects were asked to press the keyboard. The reason why the 2-back version was selected is that this version could distinguish MCI from HCs with the highest accuracy [14]. All experiment procedures were based on a previous study [14]. Before the experiment, all subjects were allowed to perform the N-back task to make them familiar with the computer device. A hemodynamic concentration in the PFC of subjects was measured by fNIRS both at the rest state and during the N-back task. To ensure the fNIRS measurement, all subjects wiped their forehead with alcohol swap and had their hair trimmed.
Apparatus
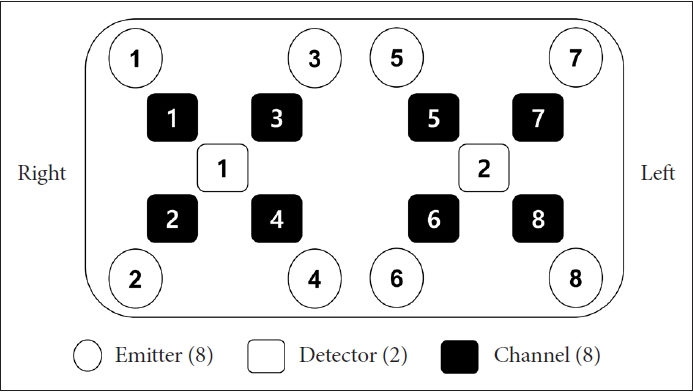
fNIRS data were measured by OctaMon (Artinis Medical System, Netherlands) which has a near-infrared multi-channel system using a sampling rate of 10 Hz. According to the international 10-20 electroencephalography placement system, a total of 8 channels were distributed to measure the PFC areas. Channels 1 to 4 were placed in the right PFC and channels 5 to 8 in the left PFC (Figure 2). The wavelengths for detecting hemodynamics, oxygenated hemoglobin (HbO2), and deoxygenated hemoglobin (HHb), were 780 and 850 nm, respectively. Considering that HbO2 is more sensitive to cognitive responses than HHb, only HbO2 was acquired in this study [16]. The pair of emitter and detector were placed 30 mm apart.
Data preprocessing
All data were preprocessed by the computation of statistical moments (mean, variance, skewness, and kurtosis). The modified Beer-Lambert law was used to convert the optical densities to HbO2 [17]. The converted signals passed a 4th-order Butterworth band-pass filter (cut-off 0.01-0.2 Hz) to remove physiological artifacts such as breathing (0.25 Hz) and heartbeat (0.1 Hz) noises according to previous studies [17,18].
Feature extraction
This study used the temporal-spatial feature identified to be the most powerful to discriminate MCI in a previous study [14]. The temporal-spatial feature describes the temporal information, specifically the slope of HbO2 within 20-60 seconds, in an fNIRS channel placement in the PFC. The slope indicates variations in the rate of activation, while the 20-60 second slope elucidates the hemodynamic response pattern associated with the plateau phase. After that, the fNIRS data was converted to two-dimension (2D) images, representing the spatial coordinates of 8 channels on the PFC. 2D image construction was implemented using a statistical activation map (Figure 3). A statistical t-value was analyzed to compare the slope of HbO2 from 8 channels between the baseline and the 2-back testing periods using a paired t-test [19]. All 2D images were split to the left and right, resulting in a total of 460 images for 230 subjects.
CNN
All images were resized to 200├Ś200 pixels to be fed into CNNs, and they were placed in a 300-dpi template and saved in the ŌĆ£.tifŌĆØ format. In this study, CNNs with four convolutional layers including max pooling layers after each convolutional layer and two fully connected layers were employed. To avoid overfitting, a drop layer (25%) was introduced between fully connected layers. There were 8 convolutions with 4├Ś4 kernels in each layer. The two fully connected layers had 256 and 128 neurons, respectively. A rectified linear unit function was used as an activation function. This CNN structure was established in accordance with a previous study [14]. Model training was performed to increase accuracy and its validation for a maximum epoch of 20 times, and the batch size was set to 32. To maximize the validating process, early stopping was arbitrarily applied based on the validation accuracy curve. Binary cross-entropy was used as a loss function, and the Adam optimizer was used. Considering that the CNN model might have suffered from an overfitting problem because of the small number of data sets, this study employed 5-fold cross-validation to decrease the influence of overfitting on the accuracy. Subsequently, the trained model was applied to the test sub-group to evaluate the CNN modelŌĆÖs performance to classify subjects with MCI from HCs. The accuracy, sensitivity, and specificity were measured to compare the CNN modelŌĆÖs performance with the MoCA-K [20].
RESULTS
General and clinical characteristics of subjects
There were no significant differences in general characteristics such as sex ratio, age, and education periods between both groups (pŌĆÖs>0.05) (Table 1). In addition, there was no significant difference in scores of the Mini-Mental State Examination between both groups (p>0.05) (Table 1), showing that no significant difference in global cognitive function was found between both groups.
Behavioral performance and hemodynamic response
There was a significant difference in the accuracy rate of the 2-back task between both groups (p<0.05) (Table 2). Specifically, the HC group outperformed the MCI group in the 2-back task. On the other hand, there were significant differences in averaged HbO2 values in the 2-back task in both left and right DLPFCs (p<0.05) (Table 2). The average hemodynamic response of the MCI group is considerably lower than that of the HC group in the 2-back task.
CNN classification
During the CNN analysis, the overfitting was not observed. Table 3 shows the CNNŌĆÖs performance for brain imaging in a time window in the spatial domain of the 2-back task. The performance of CNNŌĆÖs model across all the time windows was higher than that of the MoCA-K. In particular, the CNN model based on the left PFC in the time windows of 20-60 seconds showed the highest classification performance.
DISCUSSION
This study aimed to investigate the potential use of the neuroimaging biomarkers with CNNs for discriminating MCI. To attain this goal, neural images based on the fNIRS-derived spatial feature were measured for training the CNN model. As a result, the fNIRS-derived spatial feature in the 2-back task with CNNs could better discriminate MCI than the MoCA-K. Furthermore, the CNN model based on the left PFC achieved a higher accuracy than the right PFC. Considering that accurate and reliable biomarkers in a non-invasive, relatively low-cost, and highly portable way are necessary to distinguish MCI from healthy aging, the findings of this study highlighted that the fNIRS-derived biomarker with CNNs could be a promising way to detect MCI.
Prior fNIRS studies have revealed that individuals with MCI consistently showed a decrease in HbO2 during cognitive tasks compared to HC [4,21], which is consistent with the findings of this study. In addition, a previous study reported a decrease in HbO2 not only in the PFC but also in the inferior frontotemporal cortex and parietal cortex during cognitive tasks [6]. These findings suggest that hemodynamic concentration in the brain during cognitive tasks could be a hallmark of MCI.
To date, previous studies have highlighted the observation of hemodynamic responses in time series for the purpose of discriminating MCI. Although the detection technique based on temporal features provided evidence for differences in metabolism between both groups, it has a critical limitation. Time series analysis could result in a loss of information from the brain network. In a prior study, neurodegeneration was found to be associated with subtle declines distributed throughout the whole brain [22]. In other words, neurodegeneration is caused by a failure in the interaction of connected neural systems rather than a focal channel [4,23]. Accordingly, time series analysis would significantly hinder a better understanding of the symptoms of neural disorders [4]. Indeed, in a previous study, spatial-temporal features showed higher accuracy than biomarkers based on temporal features only [14], highlighting the importance of spatial features for the detection of MCI as well as temporal features. These findings support that this study utilized spatial-temporal features to classify MCI.
On the other hand, a previous study has reached a high accuracy for fMRI (97.0%) [24]. Similarly, the present study achieved the classification accuracy rate of 96.09% for fNIRS, suggesting that fNIRS could be also a promising tool for screening MCI. Considering the greater accessibility of fNIRS compared to fMRI, this implies that utilizing fNIRS for MCI screening could be extended to a larger pool of subjects. On the other hand, in a fNIRS study, the accuracy rates of CNN using neural images at/during various time points were compared [14]. As a result, fNIRS data during 20-60 seconds showed the best performance. This could be attributed to the fact that the initial peak time of hemodynamic responses generally occurs during the time windows of the first 20 seconds. During this time, while individuals with MCI show a lower hemodynamic response, it reaches its peak value faster in HC. Since this difference in hemodynamic responses could be visible in neural images, classification accuracy could be further improved than other time windows (0-15 and 60-70 seconds) [14], which supports the current findings. Considering that this study reported an accuracy similar to that of a previous study, analysis of the hemodynamic response during 20-60 seconds could be a way to maximize time efficiency rather than analyzing it for the entire time during cognitive tasks.
In contrast to a previous study [14], the current study compared the efficacy of the MoCA-K on screening MCI, thereby substantiating the clinical validity of utilizing fNIRS-derived data with CNNs. The MoCA-K stands as a prominent screening tool for MCI in clinics. However, its susceptibility to the impact of age and educational background limitations has prompted the need for alternative approaches [5]. The current findings demonstrate that fNIRS-derived data with CNNs outperformed the MoCA-K in MCI screening. Notably, fNIRS-derived data obtained from the left PFC with CNNs exhibited a higher level of sensitivity and specificity than the MoCA-K. This finding suggests the potential for using fNIRS-derived data to serve as a surrogate of the MoCA-K. Significantly, given the time of 5 to 10 minutes to administer the MoCA-K, this study emphasizes the feasibility of obtaining fNIRS-derived data during a 1-minute N-back task, rendering it applicable to a broader range of subjects.
On the other hand, the left PFC achieved a higher accuracy than the right PFC. The possible reason for this difference is a compensatory mechanism [25]. According to this mechanism, neural recruitment in the right PFC could be supplemented by other neural pathways to support cognitive function [25]. Accordingly, the gap in the right PFC function between MCI and HC could be diminished, which might cause a lower accuracy compared to the left PFC. In a previous study, the right PFC of people with MCI could be functioning as well as HCs [26], supporting this interpretation. In contrast to a previous study that failed to document distinctions between the left and right PFC [14], the findings of this study suggest a considerable insight: utilizing neural images from the left PFC is a more effective approach for improving accuracy.
Although the findings of this study highlighted the fNIRS-derived neuroimaging biomarker for MCI detection with fNIRS using the CNN method is promising, there are some limitations. Firstly, the fNIRS data were only measured from the PFC because having no hair in the PFC regions could reduce the effects of scattering and attenuation. In addition to the PFC, a previous study revealed that biomarkers from the parietal cortex achieve a relatively high accuracy [27]. Therefore, in future studies, it is necessary to investigate the potential use of neuroimaging biomarkers using a combination of both regions, which might give a better opportunity for discovering more effective biomarkers. Secondly, there was a small number of data. Although 5-fold cross-validation could overcome the overfitting issue which might be induced by the small number of data, the data augmentation would be considered in future works. Thirdly, this study did not compare its findings with other neuroimaging techniques to determine whether fNIRS-derived biomarkers are most efficient compared to traditional tools for screening for MCI. Fourthly, due to limitations in collecting additional demographic information, factors that may affect cerebral hemodynamic response were not controlled. Finally, the findings of this study could not be generalized to all MCI since the present study assessed a small number of amnestic-type MCI because of minimal cognitive bias compared to other types of MCI [2,3,18,28]. In the future, a broader brain region examination with an fNIRS technique with a greater number and types of MCI subjects would be helpful in ensuring the optimized neuroimaging biomarker.
Conclusion
The present study investigated the feasibility of using fNIRS-derived neuroimaging biomarkers for MCI detection. The CNN model based on the fNIRS-derived data within the time windows (20-60 seconds) during the 2-back task achieved a component accuracy (>88.70%). Notably, the CNN model was superior to the MoCA-K for discriminating MCI. Furthermore, non-equivalence of fNIRS-derived data according to the left and right PFC was found.
These findings suggest the possibility of using fNIRS with short time windows for discriminating MCI from healthy aging. Conclusively, this study demonstrates that fNIRS-derived data with CNNs could serve as a surrogate of conventional screening tools for MCI in clinics.