INTRODUCTION
Developmental disabilities (DDs) are conditions that manifest impairments in physical, learning, language, or behavioral development, encompass autism spectrum disorder (ASD), language disorder (LD), intellectual disability (ID), learning disorder and cerebral palsy [1]. The prevalence of children with DD has shown a marked increase worldwide, affecting 17.8% of children in the United States from 2015 to 2017 [2]. According to a recent study, the prevalence of DD in South Korea steadily increased by more than 4 times from 2003 to 2017 [3]. DDs significantly and negatively affect the quality of life for both the afflicted individuals and their families as a substantial amount of medical and social support is needed for children with DD [4]. The social costs of DD are significant and expected to grow, considering the increasing prevalence of DD [5,6]. Among DDs, ASD, ID, and LD often manifest as initial language delays at similar ages. These conditions can be challenging to distinguish, and sometimes a diagnosis changes within the course of early development [7].
Early childhood is a critical period for physical, cognitive, and socioemotional development, which forms the building blocks of childrenŌĆÖs later development [8]. Early identification of DDs is crucial for children to receive early evidence-based interventions, which have been shown to be highly effective in improving the outcomes of children with DD [9-13]. Although many studies emphasize the importance of early detection and intervention, difficulties in universal screening lead to delays in the age of identification and diagnosis [14].
Currently, DD is usually screened using caregiver questionnaire such as the Quantitative Checklist for Autism in Toddlers (Q-CHAT), Autism Behavior Checklist (ABC), Ages and Stages Questionnaire (ASQ), and the ParentsŌĆÖ Evaluation of Developmental Status (PEDS). But parentsŌĆÖ expectations or concerns can sometimes influence their responses, making it difficult to ensure reliable reporting [15]. ASD, ID, and LD are diagnosed by standardized instruments that evaluate the language, cognition, or social development, including Bayley Scales of Infant Development, Psychoeducational Profile-Revised (PEP-R), Autism Diagnostic Observation Schedule (ADOS) and the Autism Diagnostic Interview-Revised (ADI-R) [9,16,17]. However, these standardized tests usually take much time and need to be conducted by trained professionals [18]. This highlights the need for user-friendly and time-efficient mobile screening tools for children with DD.
As mobile devices are becoming widely distributed, the possibility that mobile-based screening tools could be useful in the early identification of DD was suggested. Mobile-based screening programs are easily accessible and are less time-consuming, do not require trained professionals, and may thus help speed up the identification of DD. Different types of mobile-based screening measures for DD are emerging, including Cognoa ASD Screener, a platform that examines home video by analysts [19], iTracker, an eye-tracking algorithm [20], and ASDTest, an application based on standardized tests such as the Autism Quotient 10 and Q-CHAT [21]. Video-analyzing platforms [19,22] and eye-tracking algorithms [23] are the most frequently studied mobile device-based methods for identifying DDs. In contrast, screening tools based on facial expression have only been recently introduced.
Facial expressions are indispensable in the sharing of emotions and human-to-human interactions. People with DD, especially those with ASD, have difficulties understanding and expressing facial emotions [24-26]. Although much research has been done on screening DD using facial expressions, not much research has been done on screening ASD [27]. Similarly, only few studies have been performed on facial expression in individuals with ID despite there being several studies regarding facial expression in individuals with ID [28,29]. Moreover, only a few studies have been conducted on LD and facial expression. Recently, some studies reported a significant difference in facial expression between children with DD and typically developing (TD) using models that categorize facial expression with facial landmarks [30,31]. Manfredonia and colleagues [31] recorded videos of participants and divided them into image frames. These studies suggest that programs examining the facial expression of children based on face recording video data could be useful for identifying children with DD [30,31]. Thus, we aimed to identify facial expressions and head pose based on facial landmark data extracted from face recording videos and differentiate between the characteristics of children with DD and those with TD.
METHODS
Mobile-based application
This study aimed to examine the effectiveness of a deep learning classification model using facial video data of children collected from a mobile-based application operating on a tablet PC. The goal was to identify facial expressions and head poses of children, comparing those with DD to TD. To achieve this, we integrated four animations and four paintings into the mobile application (Supplementary Figure 1 in the online-only Data Supplement). When children view these animations or paintings in the mobile app, their facial and head movements are recorded by the tablet PC camera. The app displays four different paintings, featuring friendly animal characters, blocks, different animal characters, and animal characters with blocks. The animation content presents four different pictures from the previous test but utilizes an animation method, testing whether more children engage when objects move and whether the results align with those of non-animation tests.
Participant enrollment
From May 2020 to July 2020, children with DD were recruited from special education centers, and a comparison group of typically-developing children was recruited from community-based childcare settings (daycare centers and kindergartens).The children were between 34 and 77 months of age. We obtained the participantsŌĆÖ previous medical history information from their parents. For participants with a medical history, we reviewed their childŌĆÖs medical record provided by the parent. Children were not included if they had 1) a history of neurologic diseases such as cerebral palsy, 2) any sensory disturbances (i.e., vision, hearing, taste, or smell), and 3) severe gross or fine motor problems that prevented them from participating in the psychometric tests. Of the 124 children, data from 35 children could not be analyzed because 1) facial data could not be extracted due to the use of facial masks (n=25), 2) facial data during video games were not available (n=5), and 3) landmark points were incorrectly extracted (n=5). As a result, a total of 89 children were analyzed in this study (Figure 1).
The participants of this study underwent a comprehensive developmental assessment. The children performed the Korean version of PEP-R, and their caregivers completed the Korean version of Vineland Adaptive Behavior Scales (VABS), the Korean version of the Childhood Autism Rating Scale (K-CARS), Social Responsiveness Scale (SRS) and Child Behavior Checklist (CBCL). Additionally, participants of this study underwent the most commonly used parent questionnaires for DD screening: Q-CHAT, ABC, ASQ, and the PEDS. Diagnoses of DD were made before the participants were enrolled, and the medical records were reviewed together with the results of developmental assessment by clinicians. If there was inconsistency between the clinician who interviewed the child and his or her caregiver, a diagnosis was made according to the Diagnostic and Statistical Manual of Mental Disorders Fifth Edition. Among TD children, those with confusing test results or developmental concerns were seen by clinicians and confirmed as TD controls. Informed consent was obtained from the parents of each child. Additionally, this study was performed in accordance with the principles of Good Clinical Practice and the Helsinki Declaration. The study was approved by the Institutional Review Board of Asan Medical Center (2020-0386).
Data collection and preprocessing
Video recording
We designed our experimental tasks to best elicit and capture facial expression in a structured environment to ensure reproducibility. The children were individually tested in a quiet room. Each child was seated on a height-adjustable chair with their right elbow and wrist resting on a table. At the beginning, the child was assisted or instructed to adjust the distance to the tablet PC so that the face could be recorded. Once the experimental environment is set up, the child watches the content on the table PC through a mobile app. Simultaneously, the mobile app records the childŌĆÖs facial expressions during this viewing. Throughout this procedure, a trained examiner sits across from the child, closely observing their behavior. If a child does not cooperate or refuses to participate in viewing content through the mobile app, the examiner will halt the video recording.
Facial landmark extraction
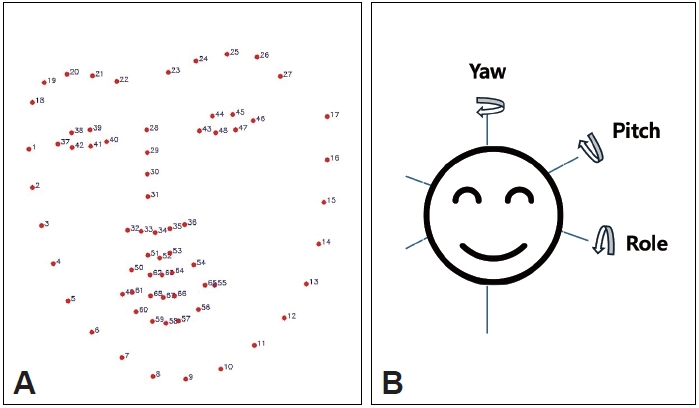
Facial landmarks are standard reference points, such as the inner and outer corner of the eye fissure where the eyelids meet. In many cases, the landmarks used in computational face analysis are very similar to the anatomical soft tissue landmarks used by physicians. These extracted landmark points can be applied in various fields, such as human emotion recognition, gaze detection, and face conversion. In our work, we use 2D-Face Alignment Net (FAN), a convolutional neural network-based method, to recognize childrenŌĆÖs faces in videos and extract 68 facial landmarks. The corresponding algorithm has been trained with an LS3D-W dataset consisting of approximately 230,000 face photographs including adult men and women, children, and showed higher performance when extracting the facial landmarks compared with other algorithms [32]. We decomposed the video into a frame unit image of 33 ms for each child, recognizing the childŌĆÖs face from each image, and extracting the facial landmark points (Figure 2).
Preprocessing
The extracted facial landmark points are stored in 68 coordinate values. For frames in which the extraction algorithm did not recognize faces, we interpolated the coordinate values of the landmark points by reflecting the information of the previous and subsequent frames of those frames. In video data, when a child bows his head or goes out of the video screen, the facial landmark may not be properly extracted. In this case, the video frame was regarded as an abnormal frame and removed (Figure 2).
Feature extraction
We utilized the OpenCV library to estimate the head pose in that frame through the landmark coordinate values. We measured three head poses (pitch, roll, yaw) by specifying six landmark points (i.e., eyes, nose, chin, and left and right mouth) and measuring the Euler angle to determine how much the points were rotated in the frame, assuming 3D coordinates with the orientation facing forward. The pitch was measured as the angle of nodding the head up and down, roll was measured archwise and left and right, yaw represented the angle of rotation of the head from left to right. Each value was measured within the range of -90 to 90 degrees (Figure 2).
To measure how much a childŌĆÖs face has moved over the previous frame in the current frame, we assumed the average position of 68 landmark coordinate values in the frame as the center point of the face and calculated the Euclidean distance to determine the distance traveled. Given that each frame was captured at a frame rate of 33 ms, the distance the face traveled was measured by reflecting the frame rate.
The changes between 68 landmark points were measured in the video. A combination of all landmark points allows the construction of a total of 2,284 combinations of distance variables. We calculated all Euclidean distances of those combinations and selected frames staring forward in each childŌĆÖs video. Based on the distance of the corresponding frameŌĆÖs landmark combination, the ratio of the remaining frames to the normal frame was obtained. Among all the obtained proportion variables, the top 40 variables were selected as derivatives based on significant differences in the distribution between children with DD and TD.
Model algorithm
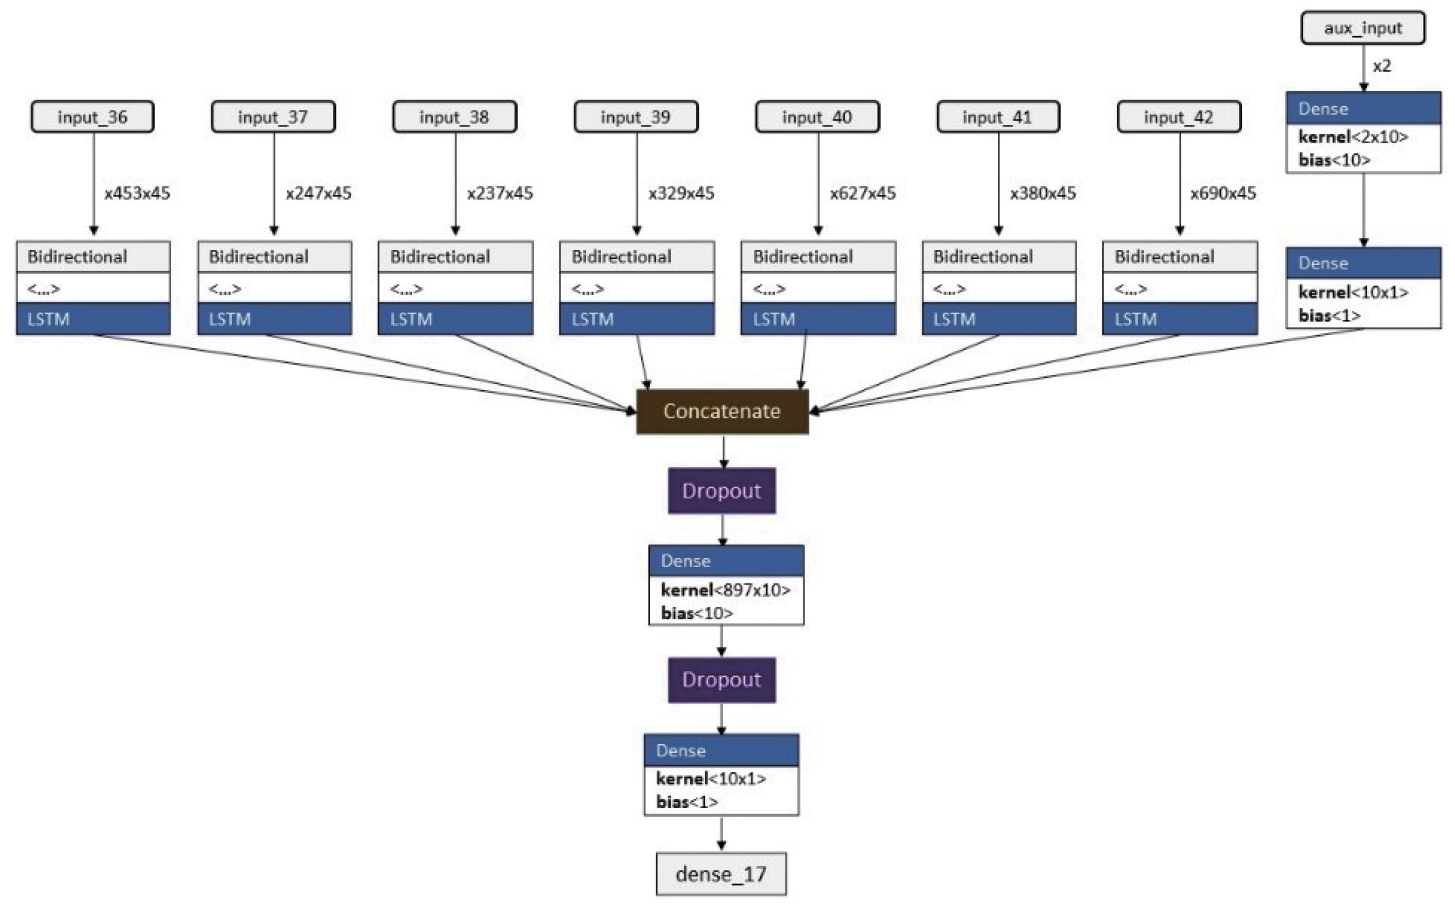
The data used in the current analyses were time-series data consisting of frames of video data recording the faces of children. Accordingly, we used the long short-term memory (LSTM) model for the binary classification of developmental disability. As a recurrent neural network (RNN) model, the LSTM model determines whether the weight value is maintained by adding cell states in an LSTM cell. The state obtained from an LSTM cell is used as input to the next LSTM cell, so the state of an LSTM cell affects the operation of the subsequent cells. The final target output at the end of the sequence represents a label classifying the developmental disability. The LSTM model can remove or add information to the cell state, carefully regulated by structures called the gates, which are a way of optionally letting information through. The LSTM model is more persistent than the existing RNN because it is possible to control long-term memory [33]. Since the lengths of each of the seven videos are vary, we created individual LSTM models for each video. We incorporated variables like sex and age as inputs in additional deep neural network (DNN) models. Subsequently, we constructed a model that integrated the results of seven LSTM models with those of a single DNN model to predict DD (Figure 3).
We also performed stratified K-cross fold validation for the robustness of the model. Stratification is the process of rearranging the data to ensure that each fold is a good representative of the whole. The stratified K-cross fold validation technique splits the dataset into K sets and the model uses K-1 folds for training and is validated on the Kth fold. This process is repeated until all the folds have been used to validate the model once. Stratification ensures that each fold is a good representation of the entire dataset, leading to parameter fine-tuning and helping the model better classify DD [34]. In our study, we used K equals five. For evaluating the trained model, the following standard machine learning metrics were employed:
1) Accuracy: Percenage of correctly classified data frames in the given test dataset.
2) Precision: Measure of exactness or quality of model prediction.
3) Recall: Measure of completeness or quantity of model prediction.
4) F1 score: Harmonic mean of the precision and the recall.
True positives are data samples that are classified as positive by the model and are actually positive. False positives are data samples that are classified as positive by the model but are actually negative. False negatives are data samples that are classified as negative by the model but are actually positive. When false positives and false negatives are close to zero, both the precision and the recall are closer to 1 and hence the F1-score is 1. In the worst case, the F1-score is 0, which means that the model is not performing any correct classifications.
After developing the DD classification model, we calculated the SHapley Additive exPlanations (SHAP) value to identify the main contributing variables of the model [35]. We calculated the SHAP values using the DeepExplainer of the SHAP package on five folds, which were divided from the train dataset. We then calculated the mean values of absolute SHAP values across all folds.
Statistical analysis
To compare the differences in the distribution of variables in the two groups, we tested the normality of the variables using the Shapiro-Wilk test. Variables satisfying normality were assessed using StudentŌĆÖs t-test, while those not meeting normality criteria were compared between groups using the Mann-Whitney U test. The statistical analysis was conducted using Python software (version 3.7, Python Software Foundation).
RESULT
Overall population
A total of 89 children were included in this study. Among them, 33 children had DD and 56 were TD children. Children with DD were significantly older than TD (56.7┬▒9.4 vs. 52.3┬▒8.2 months; p=0.024) (Table 1). Sex distribution was not significantly different between the two groups, as 20 (60.6%) of children with DD and 28 (50.0%) of children without were boys (p=0.589). Of the children with DD, 25 (75.8%) were diagnosed with ASD, 23 (69.7%) with ID, and 7 (21.2%) with LD. The mean scores of the PEP-R Developmental Quotient, VABS Adaptive Behavior Composite score, SRS total score, and K-CARS were all significantly higher in children with DD (p<0.001). The mean score of the internalizing, externalizing, and total problems on the CBCL for children with DD were not significantly different from those of TD children, indicating that comorbid psychiatric symptoms are not different between the two groups.
Model evaluation
We conducted a stratified 5-fold cross-validation, in which the mean accuracy was 0.88 (ranges, 0.78-1.00). The mean precision was 0.91 (range, 0.75-1.00). Recall exhibited the lowest performance among the evaluation metrics, with a mean value of 0.72 (range, 0.50-1.00). The mean F1-score was 0.80 (range, 0.60-1.00) (Table 2). When only landmark variables around the eyes and nose were selected to model learning, reflecting the coronavirus disease-2019 situation of mask-wearing, the average values of accuracy, precision, recall, and F1-score were 77%, 83%, 67% and 76%, respectively (Supplementary Table 1 in the online-only Data Supplement).
Model interpretation
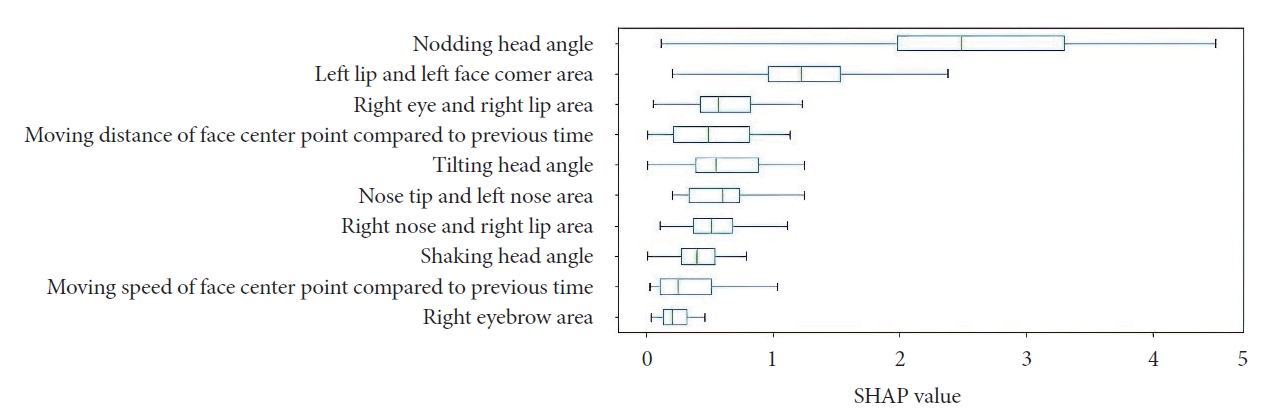
After validating the performance of the model through cross-validation, we used SHAP to interpret the model to find the variables that contributed significantly to DD prediction. After ranking the contributing variables by SHAP score, we found that the ŌĆ£nodding head angleŌĆØ variable scored the highest by a wide margin with a median SHAP score of 2.6, making it the strongest contributor to DD prediction (Figure 4). With a median of 1.3, the ŌĆ£left lip and left face corner areaŌĆØ variable was the next largest contributor.
DISCUSSION
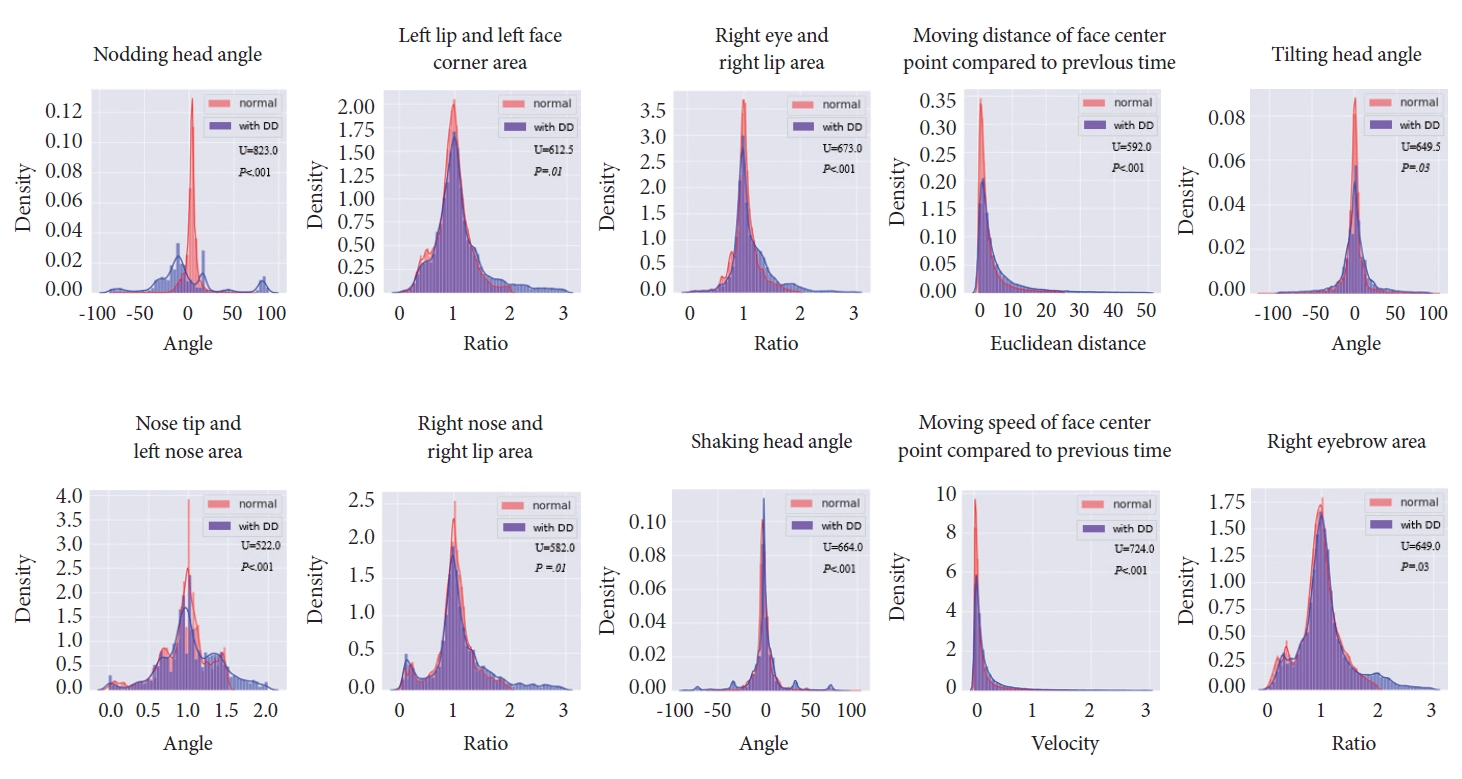
In this study, we present the effectiveness of deep learning classification model based on facial landmarks using a mobile-based video data. The model predicts the presence of DD by distinguishing facial characteristics between children with DD and TD. This is achieved by extracting 68 facial landmarks from the faces and generating derivatives including head pose estimation (pitch, yaw, roll) and landmark point distance. The deep learning classification model, utilizing mobile-based video data, predicted the presence of DD with an average accuracy of 88%. It revealed that in the pitch (head nodding) variable, children with DD exhibit a significantly broader distribution compared to TD. In the modelŌĆÖs interpretation process, we identified important predictive variables, such as pitch variables, all of which exhibited statistically significant differences in the distribution between children with DD and TD.
Caregiver questionnaires including Q-CHAT, ABC, ASQ, and PEDS are the most commonly used screening methods for DD. Of them, Q-CHAT showed a sensitivity of 71%-75% and a specificity of 63%-65% [21,36]. ABC was reported to have a sensitivity of 78.4% [37]. PEDS, which consists of two open-ended questions and eight yes/no questions completed by parents, showed sensitivities of 78.9% and 54.9% in severe and moderate-to-severe delays, respectively, and a specificity of 79.6% [38]. ASQ-3 showed sensitivities of 60.0% and 53.1% in severe and moderate-to-severe delays, respectively, and a specificity of 89.4% [39]. Thus, in terms of the accuracy of detection, our classification model seems to have comparable performance (88%) compared with the existing methods for screening.
Previous studies have suggested several digital screening methods for DDs [40-45]. Most web-based developmental surveillance programs involve trials of online versions of established questionnaires [42-45]. An example is the web-based Modified Checklist for Autism in Toddlers with Follow-up interview (M-CHAT/F), which is scored by parents. It operates as a two-stage screening test, wherein a positive result triggers a follow-up interview to clarify or correct the failed items. When administered by primary care pediatricians, the web-based M-CHAT/F demonstrated a sensitivity of 59% and a specificity of 71% [42]. In another study utilizing the digital M-CHAT-revised with follow-up, accurate documentation in the electronic health record of screening results increased from 54% to 92%. Moreover, appropriate action for children screening positive rose from 25% to 85%, as compared to the results obtained from the paper form of the M-CHAT [43]. In addition, the smartphone application PEDS operated by community healthcare workers, was shown to have a close correspondence with the gold standard paper-based PEDS tools operated by health professionals [44]. Most smartphone screening applications also focus on developing questionnaires answered by parents or medical professionals [45]. ASDTests is an application that is based on the autism-spectrum quotient and Q-CHAT, evaluating the possibility of having autistic traits [21]. Cognoa is a mobile screening application that includes both parental questionnaires and home video recording, with a sensitivity of 75% and a specificity of 62% [19,45]. These studies suggest that web-based or mobile-based screening tools could be reliably used for screening DD. Due to their quicker, cheaper, and more accessible, web-based or mobile-based screening tools could be helpful in improving the early identification of DD.
Some recent studies evaluated DD using digital observational methods, analyzing gazes, faces, or behaviors. Eye-tracking algorithms have shown progress in their potential use for screening ASD in rural areas [22,23]. Vargas-Cuentas and colleagues [22] recorded videos of participants watching social or non-social videos and analyzed the image frames from the video. Fujioka and colleagues [23] used infrared light sources and cameras to record the eye position. In one study from Bangladesh, a machine learning classifier trained by data from ADOS and ADI-R was able to detect developmental delay and autism by analyzing the behavior portrayed in home videos, and showed a sensitivity and accuracy of 76% [46]. Strobl and colleagues 20 also developed a smartphone application in which the participantsŌĆÖ gaze was analyzed by an eye-tracking algorithm. These studies show that digital methods could be used for the screening of DD.
Our study showed that facial landmark analysis, among mobile-based methods, could play a significant role in the detection of DD. In our study, out of 68 facial landmarks, the nodding head angle, left lip and face corner, and right eye and lip were the most important variables. These variables are consistent with existing analyses of head movement and facial expression for DD or ASD screening and they yield similar results to previous studies [47,48]. In previous studies examining head pose and facial expressions, Happy and Routray [30] utilized the Facial Action Coding System (FACS), which classifies facial expressions using salient facial patches and demonstrated a 94.14% accuracy in expression recognition. This study differs from ours in that the FACS extracts a maximum of 19 facial patches, while our study extracts 68 facial landmarks. Additionally, they utilized facial expression databases comprising a total 329 images, whereas our study directly collected data from 89 children. Another study employed a computer vision-based head tracking program (Zface) to illustrate differences between TD children and children with ASD [47]. In a different finding from our study, they found differences in the speed and quantity of head movement in yaw and roll, but not in pitch, between TD children and children with ASD. In another study, children with ASD and those with attention-deficit/hyperactivity disorder were differentiated with an accuracy of 94% using a red-green-blue-depth sensor from a depth measurement camera [48]. This study is similar to our work in that there was a difference in facial expressions using FACS. However, it is different from our results in that the study targeted adults aged 18 and older, and there was a difference in head movements in yaw. While these studies are computer-based programs that require special-purpose equipment, our study used a mobile-based application, making it more convenient and easy to use [30,47,48]. In one study, children watched movies on a smart tablet while the embedded camera recorded their facial expressions. Then, the computer vision analysis automatically tracked the facial landmarks and used them to classify the facial expressions into three types (positive, neutral, and other) with a maximum sensitivity of 73%, with different results depending on the type of movie being shown; notably, children with ASD displayed neutral expressions more often than children without ASD [49]. This study differs from ours in that we evaluated not only children with ASD but also those with DD.
Based on our results, we carefully suggest that facial landmarks and head poses may be used as screening tools for children with DD. A recent study that quantified head movement dynamics (displacement and velocity) showed that children with ASD had greater head movement dynamics than those without ASD [47]. Several papers hypothesized that turning away may be an adaptive strategy for individuals with ASD to regulate the overwhelming amount of information, which may explain the atypical head movement of individuals with ASD [50,51]. Therefore, using facial landmarks as a method of screening could aid the early identification of children with DD.
There are several limitations to this study. First of all, we were unable to find significant differences in facial landmarks or head pose when children were shown social videos and non-social videos. Second, our study did not analyze the results of the subgroups of DD (i.e., ASD, ID, LD). Third, since children with incorrect data were excluded, the sample size is relatively small and thus has limited generalizability. Fourth, the diagnosis of ASD was not based on structured interview such as ADI-R or ADOS. But the diagnosis of DD was based on thorough evaluation of clinician as well as comprehensive developmental assessment including PEP-R, VABS, K-CARS, SRS and CBCL. Fifth, we do not know whether these findings are limited to certain age groups. Sixth, CBCL data were not different between children with DDs compared to TD children. However, in our study, significant differences were observed in developmental assessments such as PEP-R, VABS, SRS, and K-CARS between DD and TP groups. Finally, our study did not consider body motion information because we used videos that recorded only the childrenŌĆÖs faces.
Despite these caveats, our study evaluated the utility of digital methods, especially facial landmarks from deep learning-based methods, in the screening of DD among community-based preschool children. Our results provide preliminary evidence that a deep-learning classification model utilizing mobile-based video of children, could be employed for early detection of DD.