INTRODUCTION
Traditional psychological evaluation faces a significant challenge due to its reliance on individuals’ self-report and subjective complaints. According to recent research by Lee et al. [1], approximately 20% of individuals lack insight into their own mental health issues. Additionally, multimodal approaches incorporating both subjective and objective measures can supplement the issue of self-report assessment [2]. To this end, biomarker-based mental health evaluation utilizing brainwave and heart rate variability has emerged as a promising solution. Accumulated evidence highlights the reliability of employing electroencephalography (EEG) and photoplethysmogram (PPG) for the assessment of mental health problems [3-6]. Furthermore, emerging evidence suggests that subtype classifications can be established using these biomarkers [1].
The development of individual subtypes based on biomarkers offers an intriguing and timely avenue for capturing individual factors pertaining to mental health. By leveraging EEG and PPG signals, we aimed to categorize individuals according to their mental health status, with a specific focus on general psychological distress and brain health. To facilitate assessments in non-hospital settings and reach a broader population, we adopted a practical and accessible 2-channel EEG and PPG approach. Firstly, various cognitive and affective characteristics can be captured by EEG signals. Research has indicated that higher power within the theta frequency band (4 Hz) in resting EEG is notably associated with cognitive decline in areas such as attention, working memory, and executive function [7-11]. This phenomenon is often referred to as ‘brain fog,’ indicating subjective cognitive complaints. In contrast, higher alpha (10-13 Hz) frequency power is linked to creativity and intelligence [12-14], suggesting a talented brain. Increased low alpha (8-10 Hz) activity is associated with meditation [15,16] and attention [12], reflecting a mindful brain. Beta (13-30 Hz) and gamma (30-70 Hz) power levels can provide insights into affective traits, being associated with predicting activities [17], trait anxiety [18], and heightened cortical arousal [19], indicating a tense brain.
PPG signals can also serve as an effective indicator of an individual’s mental health status. Total power (TP; 0.01-1.00 Hz) [20] represents the overall ability to control the autonomic nervous system [9,21], and a lower level of TP suggests decreased effectiveness in managing stress [22,23]. High-frequency power (HF; 0.16-0.40 Hz) is correlated with the parasympathetic nervous system 2 activity [24,25], reflecting the flexibility of overall ability to adaptively handle environmental fluctuations [26]. Low-frequency power (LF; 0.04-0.15 Hz) is linked to the activity of the sympathetic nervous system (SNS) [27], and decreased LF could come with mental stress [28]. Very low frequency power (VLF; 0.0033-0.04 Hz) serves as a secondary indicator for SNS, related to vasomotor and hormone activities [24,29]. Hence, a decrease in these indicators may suggest a weak mental state. Furthermore, it is generally thought that when the ratio of LF to HF is from 4:6 to 6:4, the atunomic nervous system (ANS) balance is ideal [21,30,31]. The ratio above 6:4 is commonly associated with SNS dominant state, anxiety, and hypertension [22], suggesting an anxious mental state. In contrast, the ratio below 4:6 reflects PNS dominant and depressive symptoms [32,33], indicating a depressed mental state.
Incorporating this knowledge, we aimed to develop a reliable subtype classification system with clinical relevance harnessing EEG and PPG. We postulated two hypotheses: 1) there would be varying proportions of subtypes between patients and the healthy control group, and 2) these subtypes would be reflected in psychological evaluation scales, resulting in distinct scores depending on the subtype. We sought to develop a reliable and valuable classification system for assessing mental health using EEG and PPG data, and subsequently evaluate the accuracy and efficacy of this classification within the scope of the current study.
METHODS
Participants
A total of 204 participants were initially recruited, comprising 101 healthy control individuals and 103 patients with psychiatric disorders. Their ages ranged from 19 to 75 years, with a mean age of 45.90±13.78. Five participants were excluded from the analysis due to incomplete responses, resulting in a final participant count of 199, including 100 healthy controls and 99 patients with psychiatric disorders.
Healthy control participants were recruited from the local community using flyers and online advertisements. To be eligible, individuals in the healthy control group had to report no history of or current psychiatric medical treatment or the need for clinical mental health services. Exclusion criteria included an inability to voluntarily read and sign the consent form, an education level below 12 years, and any history of organic brain problems or episodes of consciousness loss.
Patients with psychiatric disorders were recruited from the local community using multiple methods. Flyers were posted in local psychiatric clinics in the Goyang area, and online advertisements were placed on the website (https://bwaveeeg.com/). These individuals voluntarily participated in the study and were confirmed as patients with psychiatric conditions through the presentation of at least one medication prescription, a doctor-certified diagnosis, and their medical history. The psychiatric diagnoses in this patient group included major depressive disorder (n=69), panic disorder (n=14), posttraumatic stress disorder (n=5), bipolar disorder (n=2), schizophrenia (n=6), and cases with an unknown diagnosis (n=3). To be eligible for participation, individuals had to be capable of voluntarily reading and signing the consent form, possess an educational background of at least 12 years, and not exhibit aggressive or uncooperative tendencies. Those who did not meet these criteria were excluded from the study. Following a comprehensive briefing on the experiment’s procedures and protocol, written informed consent was acquired from all participants in accordance with the guidelines established by the Institutional Review Board (IRB no. 2022-0326-002).
Mental symptom evaluation
Psychological evaluation
Mental Health Screening Tool for Depressive Disorders
Mental Health Screening Tool for Depressive Disorders (MHS-D) is a depression screening tool consisting of 12 items that cover all nine diagnostic criteria of the Diagnostic and Statistical Manual of Mental Disorders, Fifth Edition (DSM-5) for major depressive disorder (MDD) [34]. Initially, there were 10 items based on DSM-5 criteria, and two additional items measuring helplessness and hopelessness were added to enhance the tool’s effectiveness in diagnosing depression in the Korean population [34]. Each item is evaluated on a 5-point Likert scale, ranging from 0 (not at all) to 4 (always).
Mental Health Screening Tool for Anxiety Disorders
Mental Health Screening Tool for Anxiety Disorders (MHS-A) is an 11-item self-report screening tool for Generalized Anxiety Disorder (GAD) based on DSM-5 criteria [35]. Respondents rate each item on a 5-point Likert scale from 0 (not at all) to 4 (always), indicating the intensity of symptoms experienced over the past two weeks.
Cognitive Stress Response Scale
Cognitive Stress Response Scale (CSRS) is a questionnaire with 21 items, using a 5-point Likert scale (ranging from 0 to 4). 36 The total score can range from 0 to 84 points. The questionnaire consists of three subscales: ‘extreme-negative thoughts’ (nine items), ‘aggressive-hostile thoughts’ (four items), and ‘self-depreciative thoughts’ (eight items).
Korean Version of the General Health Questionnaire
Korean Version of the General Health Questionnaire (GHQ-12) is a self-report tool used to identify mental disorders in non-clinical settings [37]. It consists of 12 items, and the scoring method involves assigning values of 0-0-1-1 and 1-1-0-0 for reverse-scored items. The total score ranges from 0 to 12, with higher scores indicating higher levels of psychiatric morbidity.
Clinical Global Impression
The current study assessed the severity and improvement of psychiatric symptoms using the Clinical Global Impression (CGI) [38]. Specifically, the CGI-Severity scale (CGI-S) was utilized, which rates the severity of psychiatric symptoms on a scale ranging from 1 (normal and not ill) to 7 (among the most severely ill).
Cognitive ability evaluation
Digit-Symbol Substitution Test
Digit-Symbol Substitution Test (DSST) involves presenting a list of digits and digit-symbol pairs [39]. Participants are instructed to draw as many paired symbols for each assigned digit as possible within a two-minute time frame. The score is based on the total number of correctly drawn symbols within the given time, with a higher score indicating a higher level of performance.
EEG and PPG bio-signal acquisition
Resting-state EEG and PPG data were simultaneously collected while participants were seated comfortably in a noise-isolated room with their eyes closed for a five-minute duration. A two-channel EEG device (Model: Amp AD8220) from SOSO H&C, Kyungpook National University, Daegu, Korea, was employed for data recording.
EEG data were recorded at Fp1 and Fp2 locations following the 10-20 system, with the reference electrode placed on the right ear lobe. A sampling rate of 256 Hz was used. Online notch filtering at 60 Hz was applied to eliminate powerline noise, and EEG signals were bandpass filtered with cutoff frequencies between 4 and 41 Hz. Automatic artifact rejection was performed using Maumgyeol Basic Solution software (version 2.0; Bwave Inc., Goyang, South Korea), with artifacts exceeding a maximum absolute value of 100 μV being rejected across all electrode sites. Eye movement-related artifacts were addressed using a standard deviation-based mathematical procedure for each epoch [40]. The data were divided into non-overlapping 2-second epochs. Participants with fewer than 30 usable epochs after pre-processing were excluded from the analysis. Following these steps, one participant from the healthy control group and four participants from the psychiatric disorder group were excluded, resulting in a final sample of 100 healthy controls and 99 patients with psychiatric disorders.
PPG signals were recorded from the right ear lobe and bandpass filtered between 0.5 and 5 Hz using a Butterworth filter. The signal amplitude was reconstructed when it fell outside the measurable range using a clipping detection function with spline interpolation [41]. All peaks in the filtered signal were detected and beat-by-beat RR intervals with a beats per minute below 40 or above 180 were excluded. To address amplitude variations, z-score normalization was applied to obtain clean RR intervals [42]. All pre-processing and analysis of EEG and PPG data were performed using Maumgyeol Basic Solution based on Python.
Maumgyeol basic biotypes: EEG-and PPG-based Bwave State Inventory (EBSI)
EEG-based biotype
The normal range was defined as the values falling within one standard deviation (σ) from the mean (μ) of the data acquired from 2,278 individuals without mental disorders by Bwave Inc. If theta activity (4-8 Hz) was higher than the upper limit of the normal range and the alpha peak power was lower than the average of the normal range, it was classified as the ‘fog’ type, indicating a state of cognitive decline. Low alpha activity (8-10 Hz) exceeding the upper limit of the normal range was classified as the ‘mindful’ type, which reflects a a state characterized by focus and meditation. The ‘talented’ type was categorized when high alpha activity (10-12 Hz) surpassed the upper limit of the normal range, indicative of creativity. If any of the activities of low beta (12-15 Hz), middle beta (15-20 Hz), high beta (20-30 Hz), and gamma (30-40 Hz) were above the upper limit of the normal range, it was classified as the ‘tense’ type, indicative of an anxious state. If none of the five above-mentioned criteria applied, it was labeled as the ‘stable’ type.
PPG-based biotype
The classification utilized the same normal range as the EEG-based biotype. If two or more of the four indicators of ANS (TP, VLF, LF, and HF) fell below the lower limit of the normal range, it was categorized as the ‘mind weak’ type, representing a state vulnerable to stress. If two or more of the four indicators of ANS were lower than the lower limit of the normal range, and the proportion of parasympathetic nervous system (PNS) activity in the ANS balance exceeded 75%, it was classified as the ‘weak-depressive’ type. Similarly, if two or more of the four indicators of ANS were lower than the lower limit of the normal range and the proportion of SNS in the ANS balance exceeded 75%, it was labeled as the ‘weak-anxious’ type. If the proportion of SNS solely exceeded 75% of the ANS balance, it was categorized as the ‘anxious’ type. Conversely, if the proportion of PNS exceeded 75% of the ANS balance, it was classified as the ‘depressive’ type. In cases where none of the five above-mentioned criteria applied, individuals were classified as the ‘stable’ type.
Statistical analysis
Differences in distribution of subtypes between healthy controls and patients with psychiatric disorders were outlined. One-way multivariate analysis of variance (MANOVA) was conducted to determine whether there is a difference between brain subtypes and mind subtypes in psychological evaluation scales, cognitive evaluation scales and Maumgyeol scores, respectively. To determine how the dependent variables differ for the independent variable, univariate analysis of variances (ANOVAs) were subsequently conducted. Least significant difference post-hoc test was conducted. To verify that our classification system is reliable and valid, K-means clustering is employed [43]. This approach employs the average of comparable data points to cluster the signals. It is an iterative process performed to minimize the sum of squares within each class. In performing K-means clustering, we employed the same sample used to establish the normal range of subtypes. After filtering out low-quality data, our analysis included 2,319 individuals for EEG and 2,134 individuals for PPG. For EEG analysis, we employed the z-scores of absolute values across seven bands, while for PPG analysis, we utilized the z-scores of autonomic nervous system activity and balance. We compared the results of data-driven clustering with EBSI categorization.
RESULTS
EBSI subtype
EEG-based subtype
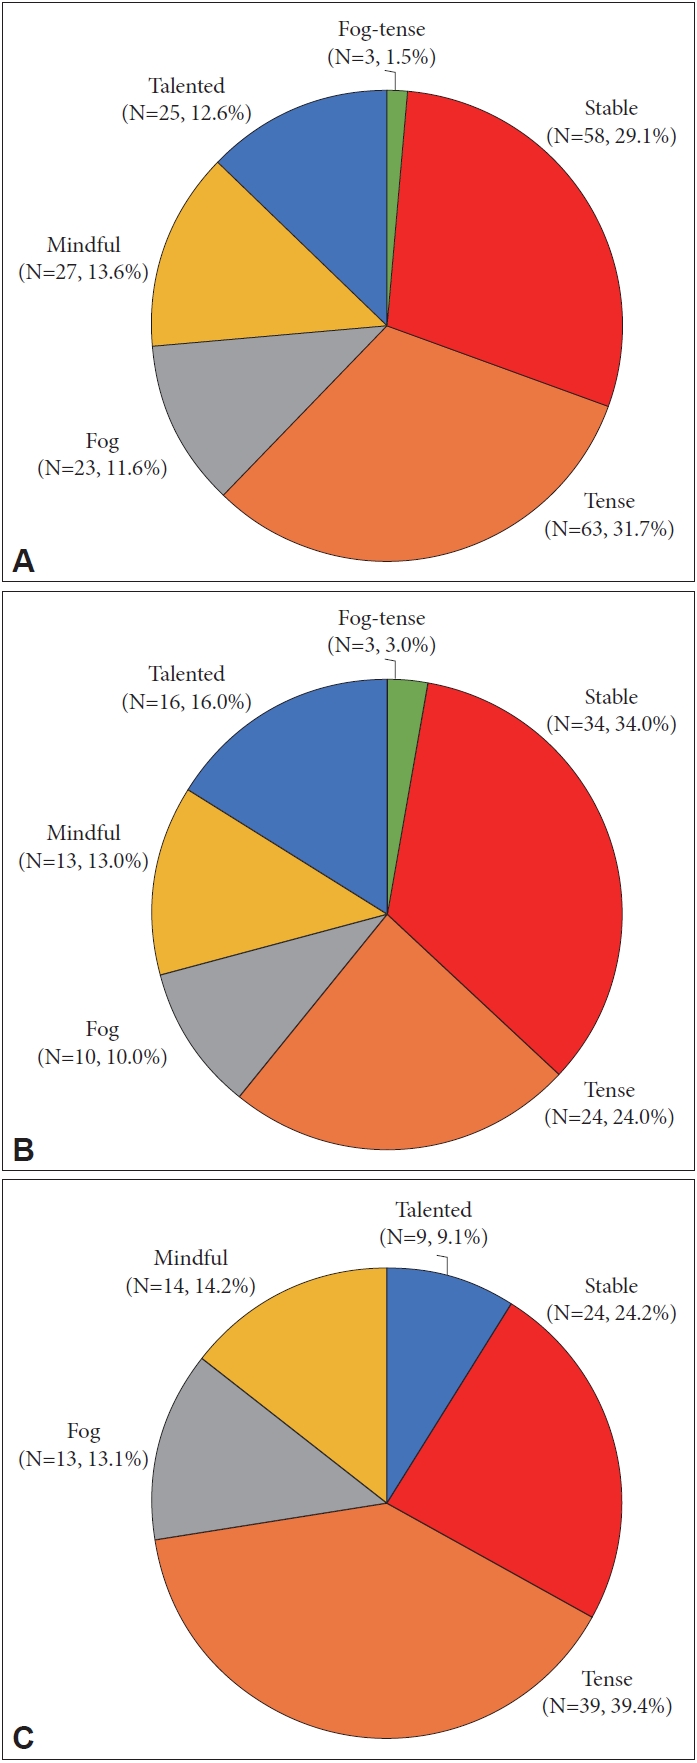
The distribution of EEG-based subtypes is as followings: 1) among all 199 participants, 58 individuals (29.1%) were classified as the stable type, 63 participants (31.7%) were classified as the tense type, 23 participants (11.6%) were classified as the fog type, 27 participants (13.6%) were classified as the mindful type, 25 participants (12.6%) were classified as the talented type, and 3 participants (1.5%) were classified as the fog-tense type. 2) out of the 100 healthy controls, 34 participants (34.0%) were classified as the stable type, 24 participants (24.0%) were classified as the tense type, 10 participants (10.0%) were classified as the fog type, 13 participants (13.0%) were classified as the mindful type, 16 participants (16.0%) were classified as the talented type, and 3 participants (3.0%) were classified as the fog-tense type. 3) among the patients with psychiatric disorders (n=99), 24 participants (24.2%) were classified as the stable type, 39 participants (39.4%) were classified as the tense type, 13 participants (13.1%) were classified as the fog type, 14 participants (14.2%) were classified as the mindful type, 9 participants (9.1%) were classified as the talented type (Figure 1). However, in case of the statistical analysis, mindful and talented were categorized as stable, and fogtense was categorized as fog (Table 1).
PPG-based subtype
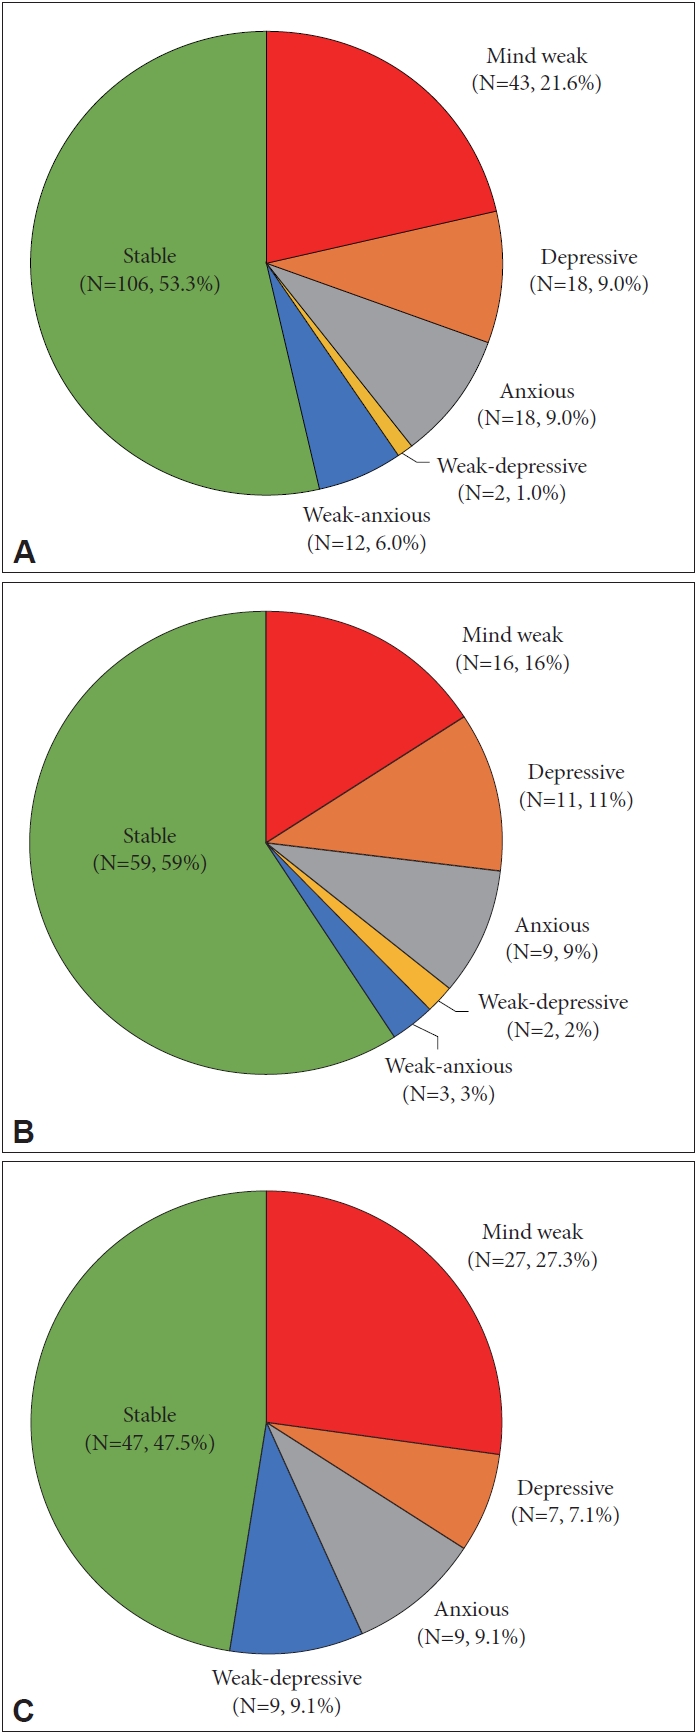
The distribution of PPG-based subtypes is as followings: 1) aamong all 199 participants, 106 individuals (53.3%) were classifed as the stable type, 43 particiapnts (21.6%) as the mind weak type, 18 participants (9.0%) as the depressive type, 18 particiapts (9.0%) as the anxious type, two participants as the weak-depressive type (1.0%), and 12 participants as the weak-anxious type (6.0%). 2) within the 100 healthy controls, 59 participants (59.0%) were classified as the stable type, 16 participants (16.0%) as the mind weak type, 11 participants (11.0%) as the depressive type, 9 participants (9.0%) as the anxious type, 2 participants (2.0%) as the weak-depressive type, and 3 participants (3.0%) as the weak-anxious type. 3) among the patients with psychiatric disorders (n=99), 47 participants (47.5%) were classified as the stable type, 27 participants (27.3%) as the mind weak type, 7 participants (7.0%) as the depressive type, 9 participants (9.1%) as the anxious type, and 9 participants (9.1%) as the weak-anxious type (Figure 2). However, in case of the statistical analysis, weak-depressive, and weak-anxious were categorized as depressive and anxious, respectively (Table 2).
EEG based brain biotype characteristics
One-way MANOVA was conducted to determine whether there is a difference between brain subtypes on psychological evaluation scales, cognitive evaluation scales and Maumgyeol scores. To enable a comparison between healthy participants and groups necessitating clinical attention, and to effectively capture the unique attributes of the clinical groups, we merged the mindful and talented types into the stable type prior to commencing the analysis.
There was a significant difference based on brain subtypes, F(18, 376)=6.631, p<0.001, Wilks’ Λ=0.576, partial η2=0.241. To determine how the dependent variables differ for the independent variable, univariate ANOVAs were subsequently conducted (Table 1). Univariate ANOVA revealed that brain subtype has a marginally significant effect on Maumgyeol mind excluding psychological scale score, F(2, 196)=2.505, p=0.084, partial η2=0.025, and DSST which represents cognitive ability, F(2, 196)=2.398, p=0.094, partial η2=0.024, respectively. Maumgyeol brain score was significantly different depending on brain subtypes, F(2, 196)=54.442, p<0.001, partial η2=0.357.
PPG biotype characteristics
Differences in on psychological evaluation scales, cognitive evaluation scales and Maumgyeol scores between mind subtypes were also examined with one-way MANOVA. To achieve sample balance and enhance comparability, the weak-depressive type was consolidated with the depressive type, while the weak-anxious type was combined with the anxious type before the analysis.
There was a significant difference between mind subtypes, F(27, 546.78)=7.952, p<0.001, Wilks’ Λ=0.380, partial η2=0.276. Presented in Table 2, results of consecutive univariate ANOVAs indicated that MHS-D (F[3, 195]=2.693, p=0.047, partial η2=0.02), CSRS (F[3, 195]=2.722, p=0.046, partial η2=0.04), GHQ-12 (F[3, 195]=4.380, p=0.005, partial η2=0.063), Maumgyeol mind including psychological scale score (F[3, 195]=34.962, p<0.001, partial η 2=0.350), and Maumgyeol mind excluding psychological scale score (F[3, 195]=80.093, p<0.001, partial η2=0.554) were significantly different depending on mind subtypes. Mind subtypes had marginally significant effect on CGIS, F(3, 195)= 2.475, p=0.063, partial η2=0.037, and Maumgyeol brain score, F(3, 195)=2.345, p=0.074, partial η2=0.035.
Mental health problems of EBSI
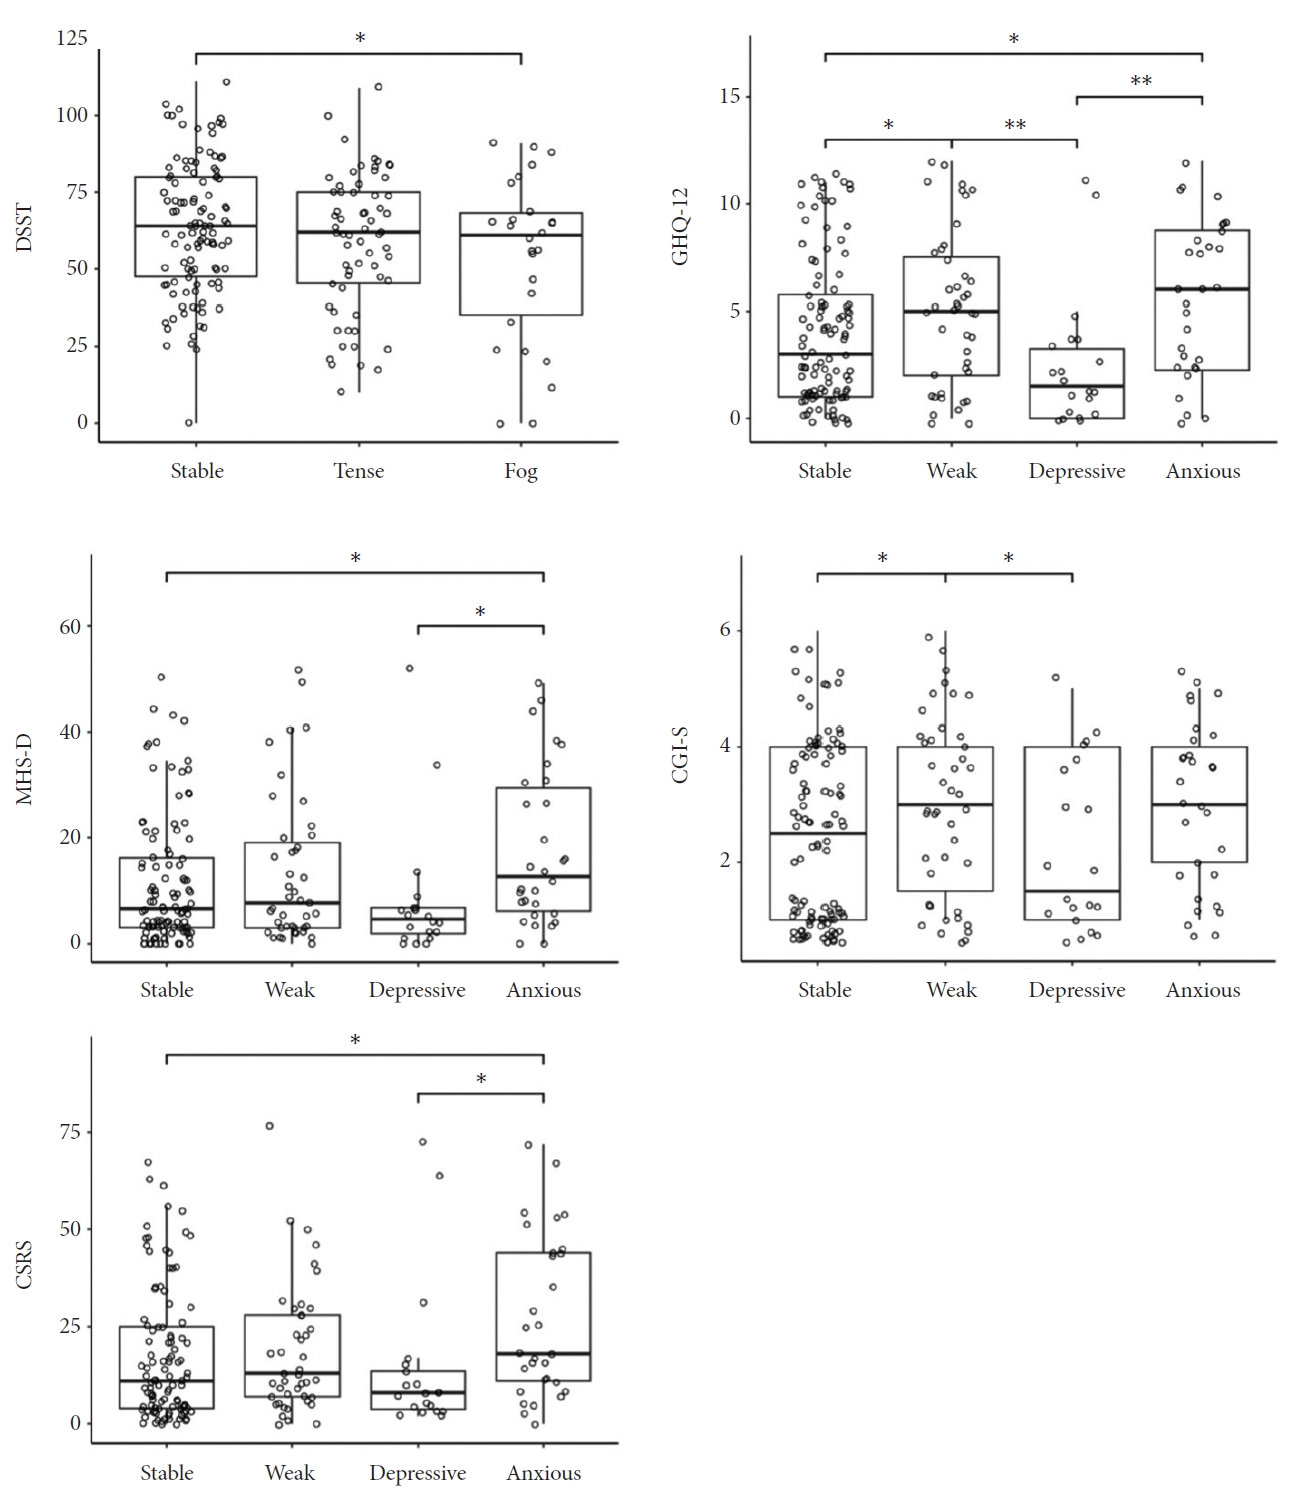
Figure 3 represents the results. In terms of Maumgyeol brain subtypes, the fog type exhibited a significantly lower DSST score when compared to the stable type (p=0.04). For Maumgyeol mind subtypes, the anxious type showed significantly higher scores on the MHS-D in comparison to both the depressive (p=0.011) and stable types (p=0.02). Additionally, for CSRS, the anxious type also reported significantly higher scores than the depressive (p=0.016) and stable types (p=0.01). The anxious type exhibited higher scores than both the depressive (p=0.002) and stable (p=0.02) types on the GHQ-12 scale, while the weak type also reported higher scores compared to the depressive (p=0.003) and stable (p=0.035) types on the GHQ-12 scale. Regarding the CGI-S, the weak type demonstrated higher scores than both the depressive (p=0.039) and stable (p=0.026) types.
Results of K-means clustering
For the Maumgyeol brain subtypes, principal component analysis (PCA) was utilized using brain health index indicators, encompassing the z-scores of absolute values from seven bands. The optimal number of components, determined through Pareto distribution, was three. Employing the elbow method, we generated three clusters. Within cluster 0, 59.8% of participants of the mindful type and 84.5% of participants of the talented type were categorized. In cluster 1, 94.4% of participants with the tense type were grouped, while in cluster 2, 90.1% of participants with the fog type were categorized. Participants of the stable type were evenly distributed across clusters, accounting for 24.5% in cluster 0, 40.0% in cluster 1, and 35.5% in cluster 2 (Table 3).
For the Maumgyeol mind subtypes, PCA was performed based on the z-scores of autonomic nervous system activity and balance. Two components were identified, and employing the elbow method, we determined four clusters. In cluster 0, 75.6% of participants with the depressive type were classified. In cluster 1, 100% of weak type participants, 100% of weak- anxious type participants, and 77.8% of weak-depressive type participants were distributed. Cluster 2 included 59.7% of participants of the anxious type. Cluster 3 encompassed 32.1% of anxious type, 21.8% of depressive type, and 39.2% of stable type participants. The stable type was relatively evenly distributed across all four clusters: 26.7% for cluster 0, 14.0% for cluster 1, 20.0% for cluster 2, and 39.2% for cluster 3 (Table 4).
EBSI brain and mind combination
In order to investigate the combination of brain and mind subtypes, MANOVA was conducted utilizing 12 brain-mind types as a factor and psychological evaluation scales, cognitive evaluation scales and Maumgyeol scores as predictors. There was a significant difference based on brain-mind types, F(99, 1274)=3.105, p<0.001, Wilks’ Λ=0.218, partial η2=0.156. Subsequent univariate ANOVAs were conducted. CSRS, F(11, 187)=1.965, p=0.034, partial η2=0.104; GHQ-12, F(11, 187)=1.930, p=0.038, partial η2=0.102; CGI-S, F(11, 187)=2.270, p=0.013, partial η2=0.118; Maumgyeol brain score, F(11, 187)=2.247, p=0.014, partial η2=0.117; Maumgyeol mind excluding psychological scale score, F(11, 87)=23.604, p<0.001, partial η2=0.581, and Maumgyeol mind including psychological scale score, F(11, 87)=10.425, p<0.001, partial η2=0.380, significantly differed depending on brain-mind types. DSST score marginally differed depending on brain-mind types, F(11, 87)=1.965, p=0.064, partial η2=0.094.
For the CSRS score, the tense-anxious type recorded the highest score (45.00), while the stable-depressed type had the lowest score (6.40). In terms of the GHQ-12 score, the tense-anxious type obtained the highest score (7.20), and the stable-depressed type had the lowest score (1.50). Similarly, the CGI-S score showed the tense-anxious type with the highest score (7.20), and the stable-depressed type with the lowest score (1.50). In another perspective, the CGI-S score indicated the tense-anxious type with the highest score (4.40), while the fog-depressed type scored the lowest (1.25), followed by the stable-depressed type (1.90). Regarding the Maumgyeol brain score, the stable-stable type had the highest score (81.15), while the fog-weak type had the lowest score (68.23). In the context of Maumgyeol mind scores excluding psychological scales, the tense-stable type achieved the highest score (78.57), followed by the stable-stable type (78.15), and the fog-weak type had the lowest score (48.53). Regarding Maumgyeol mind scores including psychological scale scores, the tense-stable type attained the highest score (78.72), followed by the stable-stable type (77.60), with the tense-weak type having the lowest score (51.36). Lastly, for the DSST score, the fog-depressed type recorded the highest score (85.75), while the fog-weak type reported the lowest score (45.33).
DISCUSSION
The current study aimed to establish a classification system for subtypes based on EEG and PPG signals, and subsequently assess the reliability and clinical relevance of the developed biotypes. First, there was a notable variation in the distribution of biotypes between healthy participants and patients with psychiatric disorders. Second, the EEG-based classification was indicative of cognitive ability. Third, PPG-based classification was associated with symptom severity, cognitive symptoms, and overall health quality. Fourth, a comparison between the theory-based classification system and data-driven classification yielded comparable outcomes. Fifth, the integration of EEG-based and PPG-based subtypes also demonstrated implications in clinical assessments.
Firstly, the distribution of biotypes differed between healthy participants and those with psychiatric disorders. EBSI brain subtypes included stable, fog, tense, mindful, talented, and fog-tense types. The fog and tense types were more prevalent among psychiatric disorder patients, while the stable and talented types were common in healthy participants. EBSI mind subtypes encompassed stable, weak, weak-depressive, weak-anxious, depressive, and anxious types. Psychiatric disorder patients showed a higher prevalence of weak, weak-depressive, weak-anxious, and anxious types, while stable and depressive types were more frequent in healthy participants. These findings highlight the clinical value of our classification system for distinguishing different mental health states.
Secondly, our EEG-based classification showed a link to cognitive ability, notably identifying the fog type with potential cognitive decline. The DSST testing shows this association, as fog types had lower scores. This aligns with prior research on EEG’s relation to cognition. EEG traditionally assesses cognitive [10] and affective [44] disorders, but the Maumgyeol service placed a greater emphasis on cognition.
The PPG-based classification system exhibited associations with symptom severity, cognitive symptoms, and overall health quality. Specifically, the anxious type correlated with anxiety and depressive symptoms, cognitive stress, and general health. The weak type aligned with higher symptom severity and poorer health in psychiatric disorders. These findings align with prior research associating SNS dominance with anxiety [22], while reduced ANS indicators link to stress vulnerability. Notably, the depressive type showed lower symptom severity, cognitive stress, and better health than anticipated, potentially due to enhanced PNS activation’s calming impact. This resonates with studies connecting greater PNS activation to happiness [45,46], even as depressed patients exhibit reduced PNS tone [47].
Fourthly, we acquired compatible results through the comparison between the theory-based EBSI and the data-driven classification utilizing K-means clustering. Regarding brain subtypes, three clusters yielded by K-means clustering were similar with the mindful and talented type (healthy groups; cluster 0), the tense type (cluster 1), and the fog type (cluster 2). Because the stable type was defined as subtypes without significant distinguishing features, it was evenly distributed among the three clusters. Concerning mind subtypes, the four clusters closely corresponded to the depressive type (cluster 0), the combination of weak, weak-anxious, and weak-depressive types (cluster 1), the anxious type (cluster 2), and a mixture of various subtypes (cluster 3). Similar to the brain subtypes, the stable type was evenly distributed. These outcomes serve to validate the credibility of our theory-based classification system. The fact that the clusters generated through data-driven K-means clustering closely align with our predefined theory-based EBSI subtypes underscores the robustness and applicability of our classification approach.
Lastly, we conducted an assessment to determine the potential value of combining brain and mind subtypes. The most noteworthy subtype was the tense-anxious type which exhibited the highest score among three scores including CSRS, GHQ-12, and CGI-S. This subtype presented the most severe clinical symptoms, marked by a compromised overall health condition and heightened cognitive stress. This can be attributed to its association with hypertension and an anxious state, which together contribute to its distinct clinical profile. Subsequently, the fog-weak type exhibited a lower Maumgyeol score and cognitive performance. The interplay of two subtypes’ distinctive characteristics appears to negatively impact cognitive function, which is reflected in their reduced cognitive ability scores. On the contrary, the stable-stable type and the stable-depressive type displayed preserved functional attributes.
The current study has several limitations. Firstly, due to an extremely small number of particular subtypes, we combined some of them to enable statistical analysis. However, it doesn’t substantially undermine our findings, as our primary focus was to compare healthy groups with subtypes requiring clinical attention. Secondly, because the judgment of the presence of psychiatric illness mostly depended on the medication prescription, a direct diagnosis was not made. Thirdly, the effects of medication were not controlled.
Despite these limitations, the current study provides a timely and prompt avenue for assessing mental health. The EEG-based classification mainly reflected cognitive ability, while the PPG-based classification captured overall symptom severity. By merging EEG- and PPG-based subtypes, we gained further novel results. We believe that utilizing EEG and PPG signals for subtype classification holds promise in future digital healthcare for mental health.